. 2019 Oct 4;294(40):14634-14647.
doi: 10.1074/jbc.RA118.005098. Epub 2019 Aug 6.

FRET-based analysis of the cardiac troponin T linker region reveals the structural basis of the hypertrophic cardiomyopathy-causing Δ160E mutation

Affiliations

FRET-based analysis of the cardiac troponin T linker region reveals the structural basis of the hypertrophic cardiomyopathy-causing Δ160E mutation

Salwa Abdullah et al. J Biol Chem. .

Abstract

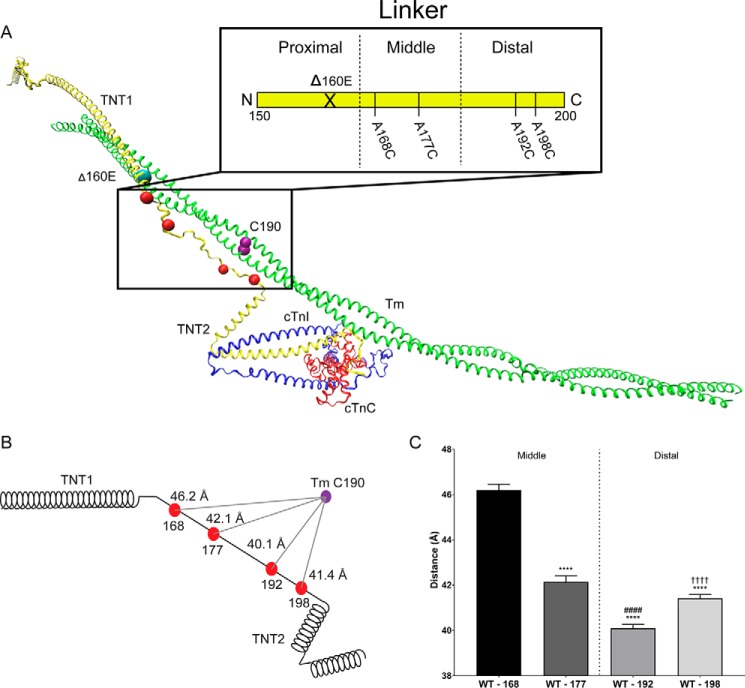
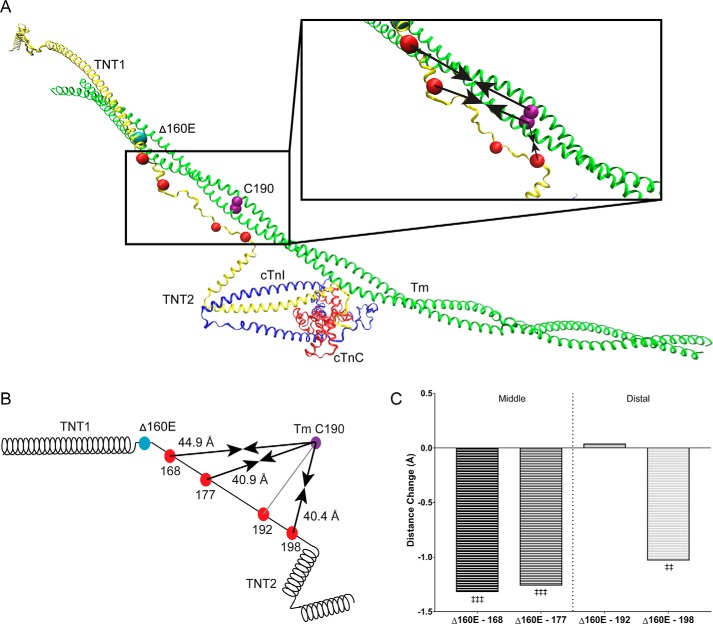
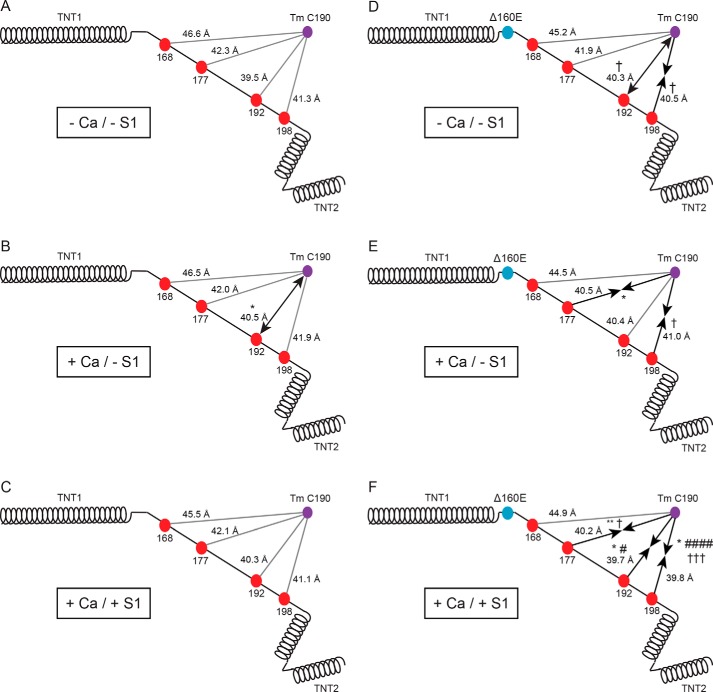
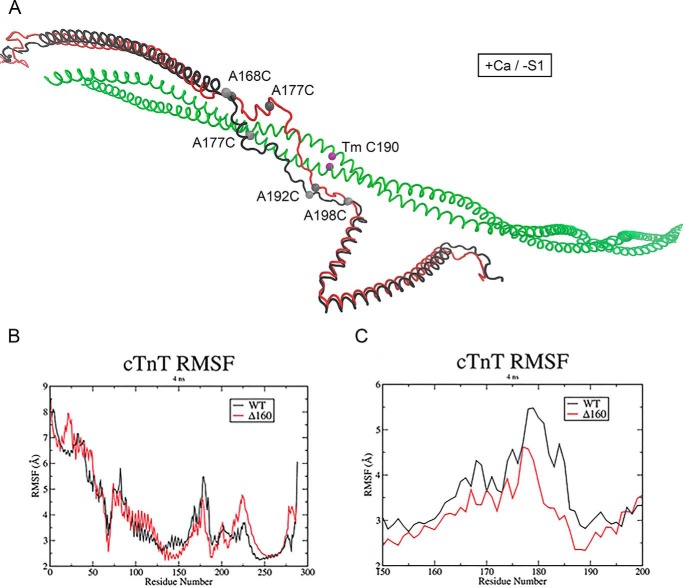
Mutations in the cardiac thin filament (TF) have highly variable effects on the regulatory function of the cardiac sarcomere. Understanding the molecular-level dysfunction elicited by TF mutations is crucial to elucidate cardiac disease mechanisms. The hypertrophic cardiomyopathy-causing cardiac troponin T (cTnT) mutation Δ160Glu (Δ160E) is located in a putative "hinge" adjacent to an unstructured linker connecting domains TNT1 and TNT2. Currently, no high-resolution structure exists for this region, limiting significantly our ability to understand its role in myofilament activation and the molecular mechanism of mutation-induced dysfunction. Previous regulated in vitro motility data have indicated mutation-induced impairment of weak actomyosin interactions. We hypothesized that cTnT-Δ160E repositions the flexible linker, altering weak actomyosin electrostatic binding and acting as a biophysical trigger for impaired contractility and the observed remodeling. Using time-resolved FRET and an all-atom TF model, here we first defined the WT structure of the cTnT-linker region and then identified Δ160E mutation-induced positional changes. Our results suggest that the WT linker runs alongside the C terminus of tropomyosin. The Δ160E-induced structural changes moved the linker closer to the tropomyosin C terminus, an effect that was more pronounced in the presence of myosin subfragment (S1) heads, supporting previous findings. Our in silico model fully supported this result, indicating a mutation-induced decrease in linker flexibility. Our findings provide a framework for understanding basic pathogenic mechanisms that drive severe clinical hypertrophic cardiomyopathy phenotypes and for identifying structural targets for intervention that can be tested in silico and in vitro.

Keywords: allosteric regulation; allostery; cardiac thin filament; cardiomyopathy; fluorescence resonance energy transfer (FRET); heart disease; hypertrophic cardiomyopathy; molecular dynamics; muscle contraction; mutant; troponin.


Conflict of interest statement

The authors declare that they have no conflicts of interest with the contents of this article

Figures

Figure 1.
Figure 1.
Average position of the WT-cTnT linker region. A, atomistic model of human cardiac thin filament components: troponin complex (cTnT, yellow; cTnI, blue; cTnC, red) and a single Tm dimer (green) with the position of the Δ160E mutation (cyan bead), FRET donor attachment sites (red beads), and FRET acceptor attachment site (purple bead). Inset, schematic of cTnT-Linker divided into three hypothetical regions (proximal, middle, and distal) for simplicity. F-actin was removed for clarity. B, schematic representation of cTnT including the donor (red beads) and acceptor (purple) sites. The distances reported reflect the average distance (across calcium and myosin S1 status) of the linker region relative to Tm Cys-190 (Table 1). C, bar graph of the average position of each linker residue separated into the middle and distal regions. The reported statistics are the results of a one-way ANOVA with Sidak correction. ****, p < 0.0001 versus A168C; ####, p < 0.0001 versus A177C; ††††, p < 0.0001 versus A192C.
Figure 2.
Figure 2.
Average position of the Δ160E-cTnT linker region. A, atomistic model of human cardiac thin filament components: troponin complex (cTnT, yellow; cTnI, blue; cTnC, red) and a single Tm dimer (green) with the position of the Δ160E mutation (cyan bead), FRET donor attachment sites (red beads), and FRET acceptor attachment site (purple bead). Inset, enlarged linker region. Black arrows indicate the change in the average distance between the donor and acceptor sites; arrows pointing inward indicate a decrease in distance. B, schematic representation of cTnT including the donor (red beads), acceptor (purple) sites, and arrows indicating the distance change caused by Δ160E. The distances reported reflect the average distance change (across calcium and myosin S1 status) of the Δ160E-linker region relative to Tm Cys-190 (Table 1). C, bar graph of the average distance change of each linker residue compared with WT separated into the middle and distal regions. The reported statistics are the results of a one-way ANOVA with Sidak correction. ‡‡, p < 0.01 versus WT; ‡‡‡, p < 0.005 versus average WT position.
Figure 3.
Figure 3.
Linker position with varying biochemical conditions. A–C, schematic representation of WT cTnT including the donor (red beads) and acceptor (purple beads) sites in the −Ca/−S1 (A), +Ca/−S1 (B), and +Ca/+S1 (C) biochemical conditions. D–F, schematic representation of Δ160E cTnT including the donor (red beads) and acceptor (purple beads) sites in the −Ca/−S1 (D), +Ca/−S1 (E), and +Ca/+S1 (F) biochemical conditions. Black arrows represent the direction of significant changes in distance; ←→ represents an increase in distance, →← represents a decrease in distance, and solid lines indicate no change. The statistics reported are the result of two-way ANOVA with Sidak correction of distances between three biochemical conditions (within genotype) and result of three-way ANOVA with Sidak correction of distances versus WT (between genotypes, within biochemical condition). Distances (means ± S.D.) measured under each condition can be found in Table 2. *, p < 0.05 versus −Ca/−S1 (within genotype); **, p < 0.01 versus −Ca/−S1 (within genotype); †, p < 0.05 versus WT (within biochemical condition); #, p < 0.05 versus +Ca/−S1 (within genotype); ####, p < 0.0001 versus +Ca/−S1 (within genotype); †††, p < 0.005 versus WT (within biochemical conditions).
Figure 4.
Figure 4.
Average in silico structure of the thin filament linker. A, WT (black) and Δ160E cTnT (red) in the +Ca/−S1 conditions. Acceptor site on tropomyosin (green) shown in purple, and donor sites on cTnT are shown in gray. B, RMSF analysis for cardiac troponin T. C, RMSF analysis of the cTnT linker region, cTnT residues 150–200, in the +Ca/−S1 conditions. WT and Δ160E RMSF are in black and red, respectively.

Similar articles

Cited by

References

    1. Maron B. J., and Maron M. S. (2013) Hypertrophic cardiomyopathy. Lancet 381, 242–255 10.1016/S0140-6736(12)60397-3 - DOI - PubMed
    1. Alcalai R., Seidman J. G., and Seidman C. E. (2008) Genetic basis of hypertrophic cardiomyopathy: from bench to the clinics. J. Cardiovasc. Electrophysiol. 19, 104–110 - PubMed
    1. Kimura A. (2015) Molecular genetics and pathogenesis of cardiomyopathy. J. Hum. Genet. 61, 41–50 - PubMed
    1. Alfares A. A., Kelly M. A., McDermott G., Funke B. H., Lebo M. S., Baxter S. B., Shen J., McLaughlin H. M., Clark E. H., Babb L. J., Cox S. W., DePalma S. R., Ho C. Y., Seidman J. G., Seidman C. E., et al. (2015) Results of clinical genetic testing of 2,912 probands with hypertrophic cardiomyopathy: expanded panels offer limited additional sensitivity. Genet. Med. 17, 880–888 10.1038/gim.2014.205 - DOI - PubMed
    1. Homsher E., Kim B., Bobkova A., and Tobacman L. S. (1996) Calcium regulation of thin filament movement in an in vitro motility assay. Biophys. J. 70, 1881–1892 10.1016/S0006-3495(96)79753-9 - DOI - PMC - PubMed

Publication types

MeSH terms