. 2019 Aug 6;10(1):3540.
doi: 10.1038/s41467-019-11483-4.

Cytokinin functions as an asymmetric and anti-gravitropic signal in lateral roots

Affiliations

Cytokinin functions as an asymmetric and anti-gravitropic signal in lateral roots

Sascha Waidmann et al. Nat Commun. .

Abstract

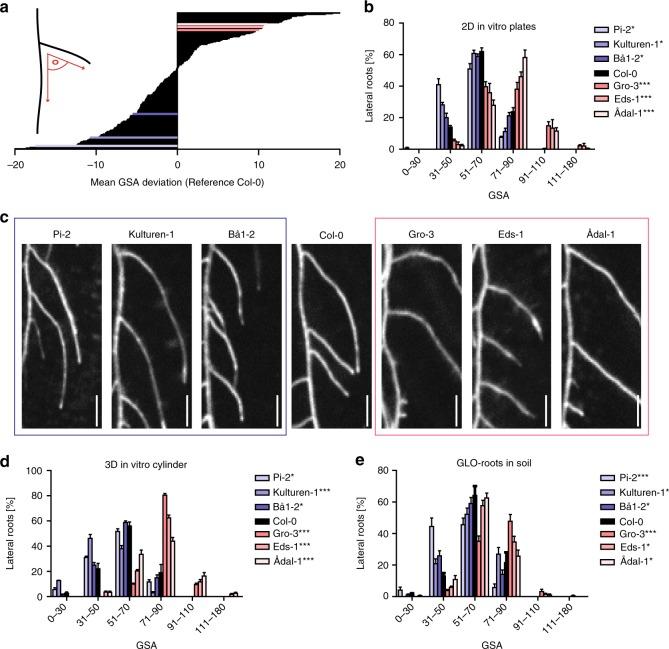
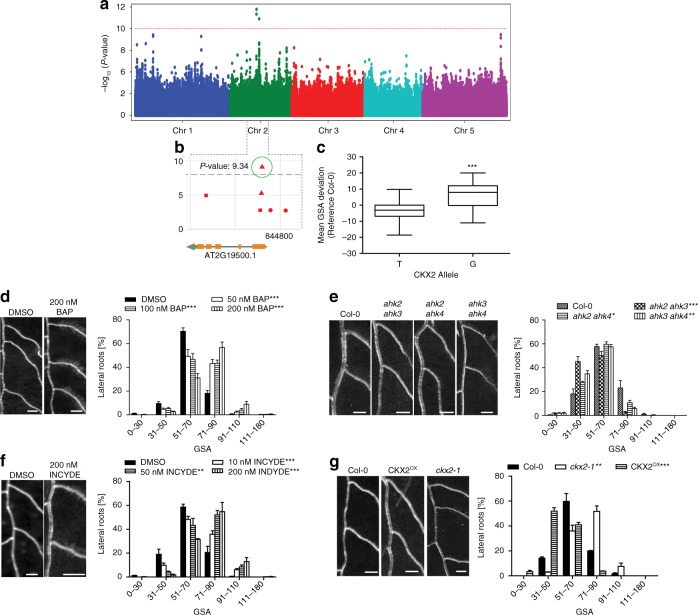
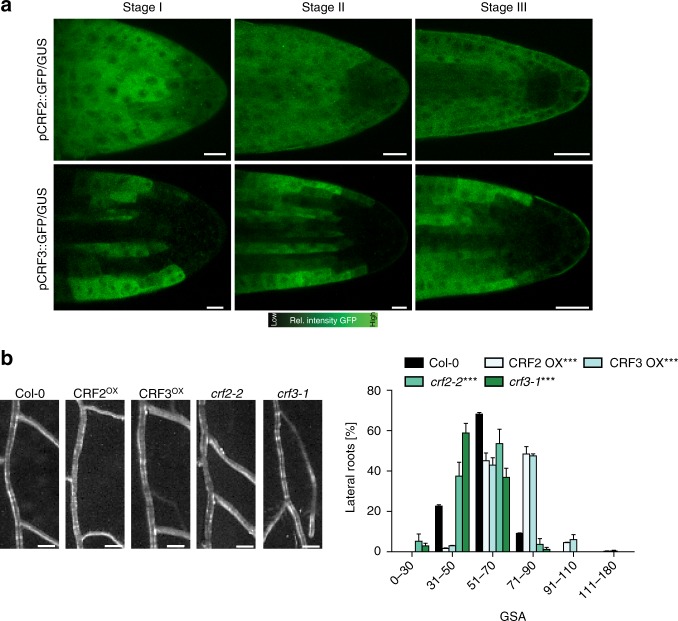
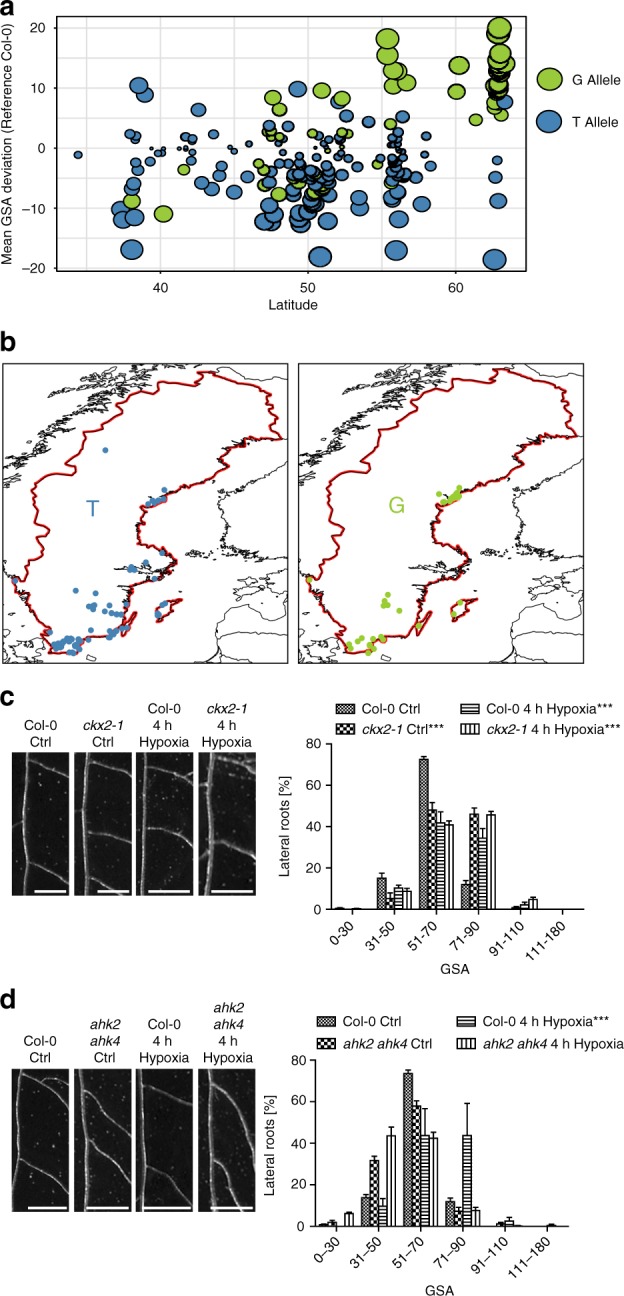
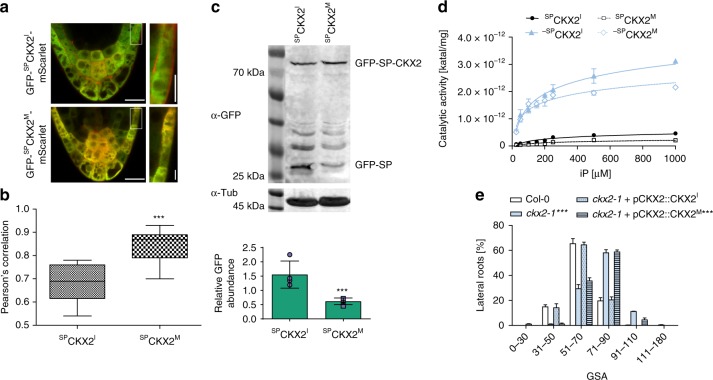
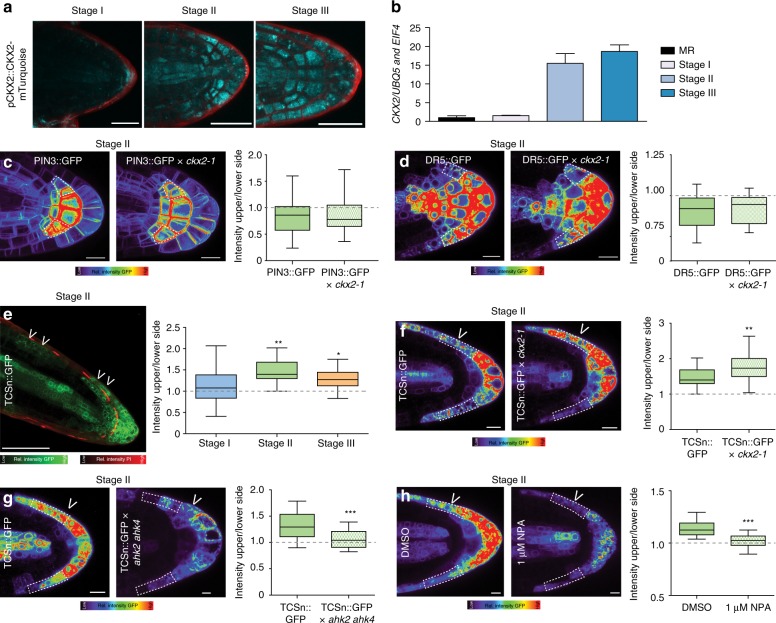
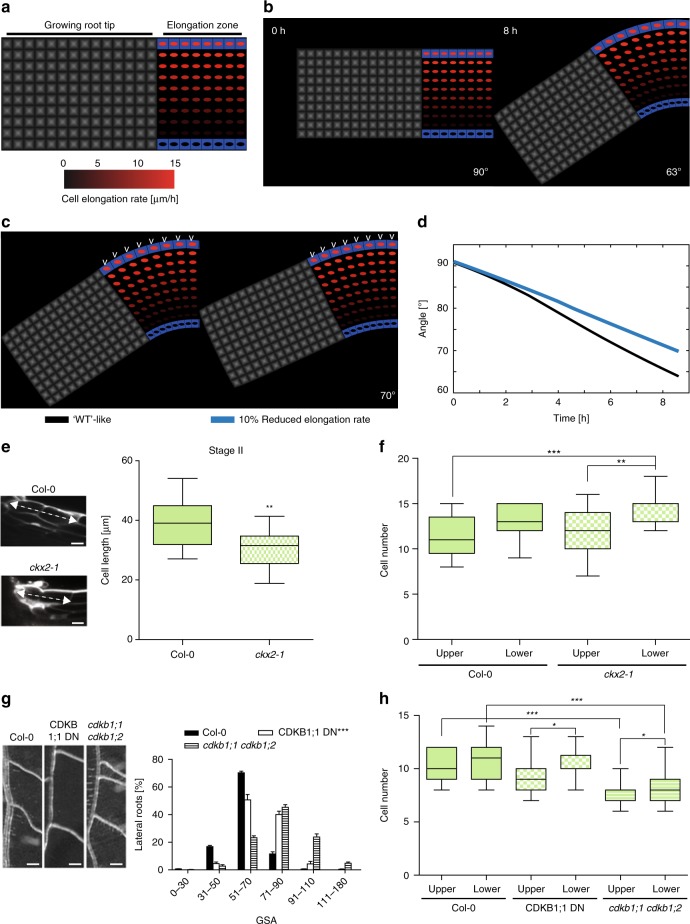
Directional organ growth allows the plant root system to strategically cover its surroundings. Intercellular auxin transport is aligned with the gravity vector in the primary root tips, facilitating downward organ bending at the lower root flank. Here we show that cytokinin signaling functions as a lateral root specific anti-gravitropic component, promoting the radial distribution of the root system. We performed a genome-wide association study and reveal that signal peptide processing of Cytokinin Oxidase 2 (CKX2) affects its enzymatic activity and, thereby, determines the degradation of cytokinins in natural Arabidopsis thaliana accessions. Cytokinin signaling interferes with growth at the upper lateral root flank and thereby prevents downward bending. Our interdisciplinary approach proposes that two phytohormonal cues at opposite organ flanks counterbalance each other's negative impact on growth, suppressing organ growth towards gravity and allow for radial expansion of the root system.


Conflict of interest statement

The authors declare no competing interests.

Figures

Fig. 1
Fig. 1
Natural variation of the primary GSA of lateral roots in Arabidopsis thaliana. a Mean gravitropic set point angle (GSA) values are normalized to reference accession Col-0. Three hyper-responsive (blue colors) and hypo-responsive (red colors) accessions were selected for further analysis. b GSA distributions of hyper-responsive and hypo-responsive accessions grown on 2D agar plates. n = 5 plates (16 seedlings with 30–120 LRs per plate). c Representative images of hyper-responsive and hypo-responsive accessions grown on 2D agar plates. Scale bars, 20 mm. d GSA distribution of hyper-responsive and hypo-responsive accessions grown in 3D agar cylinders. n = 5 cylinders (25–120 LRs per cylinder). e GSA distribution of hyper-responsive and hypo-responsive accessions grown in soil. n = 5–10 plants (25–75 LRs per plant). b, d, e Kolmogorov–Smirnov test P-values: *P < 0.05, **P < 0.01, ***P < 0.001 (compared to Col-0). Mean ± SEM. Experiments were repeated at least three times
Fig. 2
Fig. 2
Genome-wide association study (GWAS) on gravitropic set point angle (GSA). a Manhattan plot of GWAS results. The dotted horizontal line indicates a significance level of 0.1 after Bonferroni correction for multiple testing. b Magnification of the peak region on chromosome 2. A highly significant SNP was located at position 8,447,233 in the coding region of CKX2. c Mean GSA of T and G alleles of CKX2. Horizontal lines show the medians; box limits indicate the 25th and 75th percentiles; whiskers extend to the min and max values. Student’s t-test P-value: ***P < 0.001. dg Representative images and GSA distributions of untreated and 6-Benzylaminopurin (BAP)-treated Col-0 wild type d, Col-0 wild type, ahk2 ahk3, ahk2 ahk4 and ahk3 ahk4 e, untreated and INCYDE-treated Col-0 wild type f, Col-0 wild type, ckx2-1 and CKX2OX seedlings g. Kolmogorov–Smirnov test P-values: *P < 0.05, **P < 0.01, ***P < 0.001 (compared to DMSO solvent or Col-0 wild type control). Mean ± SEM, n = 5 plates (16 seedlings with 65–160 LRs per plate). Scale bars, 2 mm. dg Experiments were repeated at least three times
Fig. 3
Fig. 3
Characterization of cytokinin response factors (CRFs) in lateral roots. a Representative images of pCRF2::GFP/GUS and pCRF3::GFP/GUS in stage I–III LRs. Scale bar, 25 µm. b Representative images and GSA distribution of Col-0 wild type, crf mutants, and CRFOX lines. Kolmogorov–Smirnov test P- values: ***P < 0.001 (compared to DMSO or Col-0). Mean ± SEM, n = 5 plates (16 seedlings with 50–120 LRs per plate). Scale bars, 2 mm. a, b Experiments were repeated at least three times
Fig. 4
Fig. 4
Cytokinin signaling integrates environmental signals into angular lateral root growth. a Comparison of the mean GSA distribution and its geographical (latitude) distribution of the phenotyped accessions. T and G allele of CKX2 are depicted in blue and green, respectively. b Relative geographical distribution of the T and G allele of CKX2 in all sequenced Swedish Arabidopsis accessions. The distribution of accessions is visualized by R package “rworldmap”. c, d Representative images and GSA distributions of c Col-0 wild-type and ckx2-1 or d Col-0 wild type and ahk2 ahk4 with and without hypoxia treatment for 4 h. Scale bars, 2 mm. Kolmogorov–Smirnov test P-values: ***P < 0.001 (compared to DMSO solvent or Col-0 wild type control). Mean ± SEM, n = 4 plates (10 seedlings with 60–120 LRs per plate). Experiments were repeated at least three times
Fig. 5
Fig. 5
Signal peptide processing is required for CKX2 activity. a Localization of GFP-SPCKX2I-mScarlet and GFP-SPCKX2M-mScarlet in stage II LRs. Scale bar, 25 and 10 µm, respectively. b Quantification of the co-localization of GFP and mScarlet signal using Pearson’s correlation. Horizontal lines show the medians; box limits indicate the 25th and 75th percentiles; whiskers extend to the min and max values. Student’s t-test P-Value: ***P < 0.001, n = 10–12 individual LRs. c Immunoblot analysis and quantification of SPCKX2I and SPCKX2M expressed in N. benthamiana leaves using anti-GFP antibody. Anti-tubulin antibody was used as loading control. The signal of GFP-SP was quantified and normalized to tubulin. Student’s t-test P-Value: ***P < 0.001. Mean ± SEM, n = 4 biological replicates. d Saturation curves of isopentenyladenine (iP) degradation by CKX2. Reactions were performed at pH 7.4 in McIlvaine buffer with 0.5 mM DCIP as electron acceptor (black filled circle SPCKX2I, white square SPCKX2M, black filled triangle SPCKX2I, white diamond -SPCKX2M). Mean ± SEM, n = 8. e GSA distributions of ckx2-1 was complemented by pCKX2::CKX2I, but not by pCKX2::CKX2M. Representative lines are shown. Kolmogorov–Smirnov test P-value: ***P < 0.001 (compared to Col-0). Mean ± SEM, n = 5 plates (16 seedlings with 65–160 LRs per plate). ae Experiments were repeated at least three times
Fig. 6
Fig. 6
CKX2 modulates asymmetric cytokinin signaling in emerged lateral roots. a Representative images of pCKX2::CKX2-mTurquoise in stages I–III LRs. Propidium Iodide (PI) was used for counterstaining. Scale bar, 25 µm. b qPCR analysis detecting the levels of CKX2 transcript in the root tip and LRs stages I–III normalized against UBQ5 and EIF4. Bars represent means ± SD, n = 3. c, d Representative images and signal quantification of stage II LRs of c pPIN3::PIN3-GFP, and d DR5::GFP in Col-0 wild type and ckx2-1 mutant background. Horizontal lines show the medians; box limits indicate the 25th and 75th percentiles; whiskers extend to the min and max values, n = 10–15 individual LRs. Scale bars, 10 µm. e Representative image (stage II) and quantification of TCSn::GFP in stages I–III LRs. PI was used for counterstaining. Scale bar, 50 µm. fh Representative images and quantification of stage II LRs of f TCSn::GFP in wild type and ckx2-1, g TCSn::GFP in wild type and ahk2 ahk4 or h after treatment with DMSO or 1 µM NPA for 24 h. Scale bars, 10 µm. eh One-way ANOVA P-values: *P < 0.05, **P < 0.01, ***P < 0.001. Horizontal lines show the medians; box limits indicate the 25th and 75th percentiles; whiskers extend to the min and max values, n = 15–30 individual LRs. ah Experiments were repeated at least three times. White dotted lines outline lateral root cap cells (facing the columella cells) for quantification
Fig. 7
Fig. 7
Cytokinin affects cell elongation and number in lateral roots. a Sketch shows a simplified geometry of a lateral root (LR). LR model consists of tip and elongation zones. The cell elongation rate (visualized as red spot inside the cell) linearly increases from lower flank towards the upper flank of the LR (up to three-fold) based on estimates derived from previous work. Bottom panel, color coding bar for cell elongation rates. b Time-lapse model simulations (screenshots) which lead to the in vivo observed LR bending (63°) after ~8 h. c Left panel corresponds to b. Right panel, 10% decrease in elongation rate only on the upper root flank (white arrow heads). Each simulation represents LR status after 9 h of dynamic elongation. d Time evolution of set-point angle corresponding to different scenarios in c. e Representative image and quantification of first two elongated cells of lateral roots in stage II. f Quantification of the cell number in the upper and lower meristem of Col-0 and ckx2-1. g Representative images and GSA distributions of Col-0 wild-type, CDKB1;1 DN (dominant negative) and cdkb1;1 cdkb1;2. Kolmogorov–Smirnov test P-values: ***P < 0.001 (compared to Col-0). Mean ± SEM, n = 5 plates (16 seedlings with 100–180 LRs per plate). Scale bars, 2 mm. h Quantification of the cell number in the upper and lower meristem of Col-0, CDKB1;1 DN and cdkb1;1 ckdb1;2. e, f, h One-way ANOVA P-values: *P < 0.05, **P < 0.01, ***P < 0.001. Horizontal lines show the medians; box limits indicate the 25th and 75th percentiles; whiskers extend to the min and max values, n = 10–20 individual LRs. Scale bar, 10 µm. eh Experiments were repeated at least three times

Comment in

References

    1. Uga Y, et al. Control of root system architecture by DEEPER ROOTING 1 increases rice yield under drought conditions. Nat. Publ. Group. 2013;45:1097–1102. - PubMed
    1. Su S-H, Gibbs NM, Jancewicz AL, Masson PH. Molecular mechanisms of root gravitropism. Curr. Biol. 2017;27:R964–R972. doi: 10.1016/j.cub.2017.07.015. - DOI - PubMed
    1. Leitz G, Kang BH, Schoenwaelder MEA, Staehelin LA. Statolith sedimentation kinetics and force transduction to the cortical endoplasmic reticulum in gravity-sensing Arabidopsis columella cells. Plant Cell Online. 2009;21:843–860. doi: 10.1105/tpc.108.065052. - DOI - PMC - PubMed
    1. Kleine-Vehn J, et al. Gravity-induced PIN transcytosis for polarization of auxin fluxes in gravity-sensing root cells. Proc. Natl Acad. Sci. USA. 2010;107:22344–22349. doi: 10.1073/pnas.1013145107. - DOI - PMC - PubMed
    1. Friml J, Wiśniewska J, Benková E, Mendgen K, Palme K. Lateral relocation of auxin efflux regulator PIN3 mediates tropism in Arabidopsis. Nature. 2002;415:806–809. doi: 10.1038/415806a. - DOI - PubMed

Publication types