. 2019 Aug 6;10(1):3526.
doi: 10.1038/s41467-019-11428-x.

Incomplete influenza A virus genomes occur frequently but are readily complemented during localized viral spread

Affiliations

Incomplete influenza A virus genomes occur frequently but are readily complemented during localized viral spread

Nathan T Jacobs et al. Nat Commun. .

Abstract

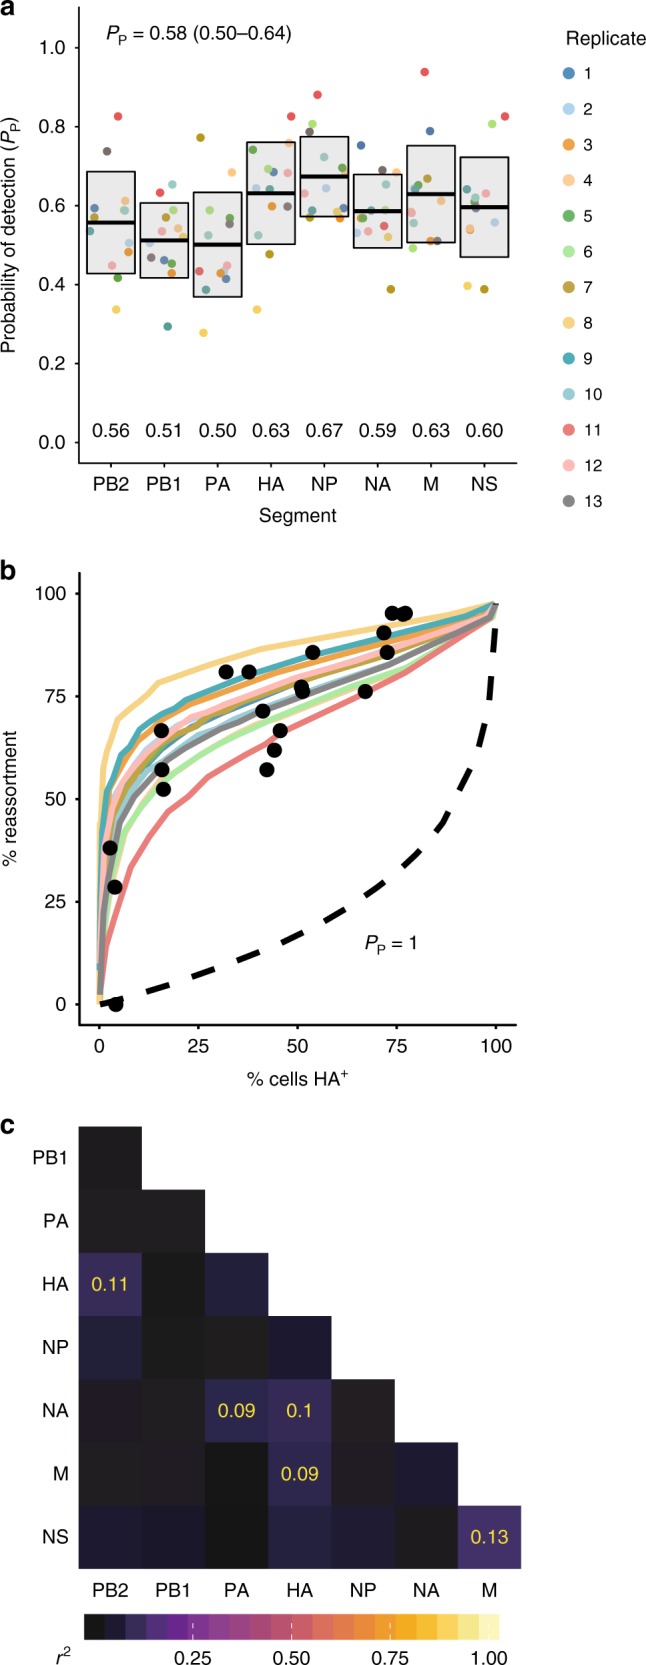
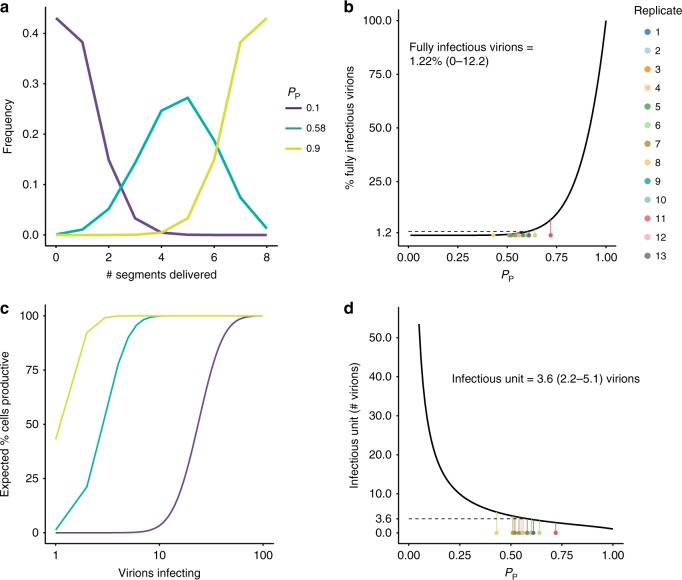
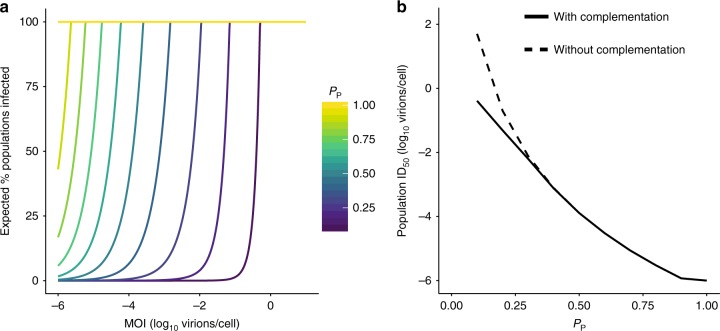
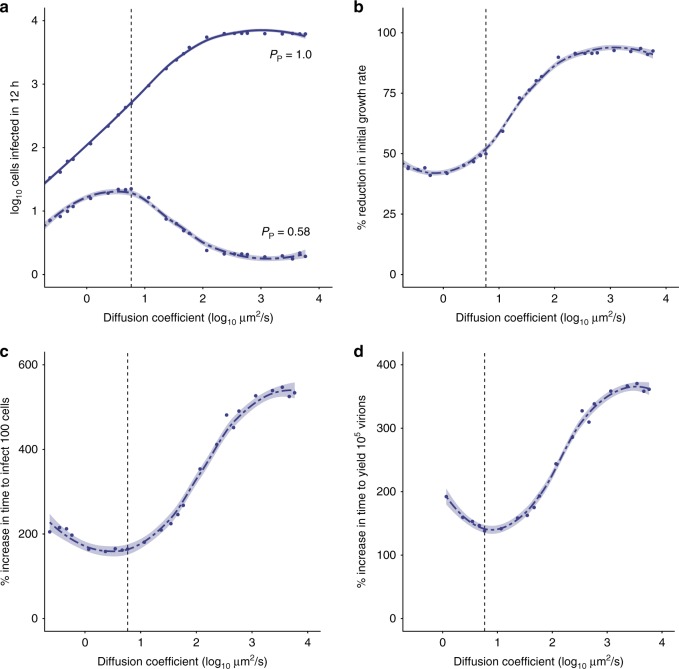
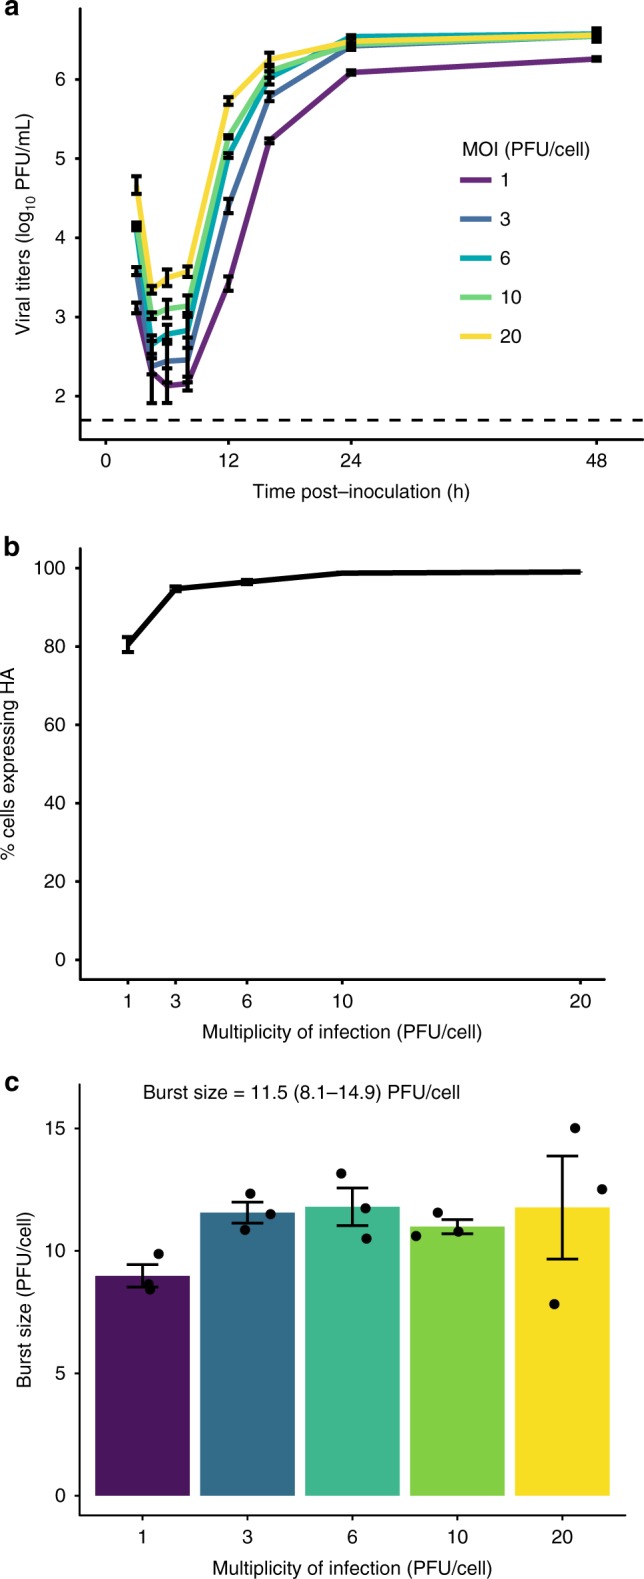
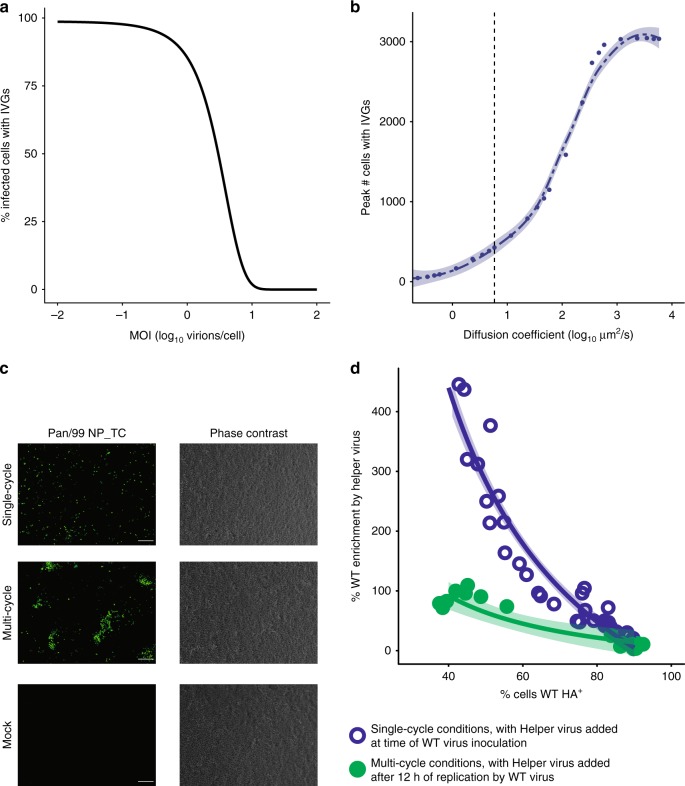
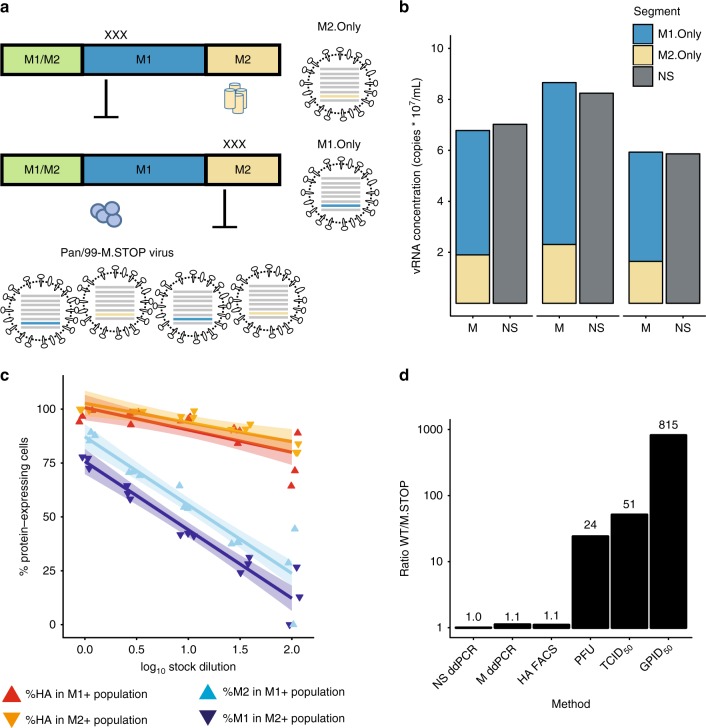
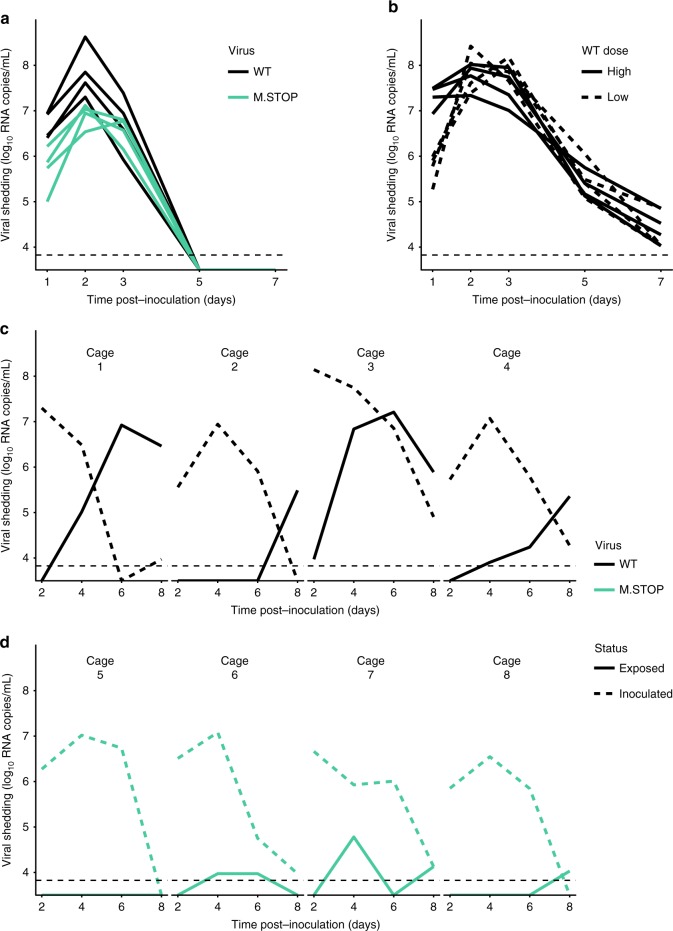
Segmentation of viral genomes into multiple RNAs creates the potential for replication of incomplete viral genomes (IVGs). Here we use a single-cell approach to quantify influenza A virus IVGs and examine their fitness implications. We find that each segment of influenza A/Panama/2007/99 (H3N2) virus has a 58% probability of being replicated in a cell infected with a single virion. Theoretical methods predict that IVGs carry high costs in a well-mixed system, as 3.6 virions are required for replication of a full genome. Spatial structure is predicted to mitigate these costs, however, and experimental manipulations of spatial structure indicate that local spread facilitates complementation. A virus entirely dependent on co-infection was used to assess relevance of IVGs in vivo. This virus grows robustly in guinea pigs, but is less infectious and does not transmit. Thus, co-infection allows IVGs to contribute to within-host spread, but complete genomes may be critical for transmission.


Conflict of interest statement

The authors declare no competing interests.

Figures

Fig. 1
Fig. 1
Incomplete genomes are common in Pan/99 virus infection. a Segment-specific PP,i values were measured by a single-cell sorting assay. Each set of colored points corresponds to eight PP,i values measured in a single experimental replicate, with 13 independent replicates performed. Horizontal bars indicate the mean (written above each segment’s name), and shading shows the mean ± SD (N = 13 independent experiments). b Using each replicate’s PP,i values as input parameters, the computational model from Fonville et al. was used to predict the frequency of reassortment across multiple levels of infection. Black circles represent the experimental data from Fonville et al. and show levels of reassortment observed following single-cycle coinfection of MDCK cells with Pan/99-WT and a Pan/99 variant viruses. Colored lines show the theoretical predictions made by the model, with colors corresponding to the legend shown in panel a. c Pairwise correlations between segments (r2) are shown as color intensities represented by a color gradient (below). r2 values are shown in yellow for significant associations (Nr2 (where N is the sum of p(1 virion) values, N = 186) follows a χ2 distribution with three degrees of freedom, p < 0.05 (χ2 test) after Bonferroni correction for multiple comparisons). Source data are provided as a Source Data file
Fig. 2
Fig. 2
Incomplete genomes require complementation for productive infection at the cellular level. a The expected number of segments delivered upon infection with a single virion was calculated for two extreme values of PP (0.10, 0.90) and the estimated PP of Pan/99 virus (0.58, mean ± SD 0.50–0.64). b The percentage of virions expected to initiate productive infection was plotted as a function of PP. Colored points along the bottom of the plot correspond to the average PP value of each experimental replicate in Fig. 1, with lines connecting them to their predicted value on the theoretical line, and therefore represent predicted frequencies for Pan/99 virus. Mean ± SD (given by Eqs (8) and (9)) interval is given in the text above the line. c The percentage of cells expected to be productively infected following infection with a given number of virions was calculated for the same PP values as in (a). d The expected number of virions required to make a cell productively infected is plotted as a function of PP. As in (b), colored points correspond to the average PP value of each Pan/99 experimental replicate in Fig. 1, and mean ± SD (given by Eqs (13) and (14)) interval is given in the text. Source data are provided as a Source Data file
Fig. 3
Fig. 3
Requirement for coinfection poses a barrier to establishing an infection in a population of cells. To define the impact of IVGs on the ability of a virus to establish infection in a population of cells, the probability that a population of 106 cells became infected by a given number of virions was calculated. a The percentage chance of at least one cell containing eight genome segments following delivery of virions was calculated for each PP and across a range of MOIs. b The MOI that led to 50% of cell populations becoming infected (ID50) was plotted as a function of PP, where complementation was possible (solid line), and where only complete viral genomes could initiate infection (dashed line). IVGs = incomplete viral genomes. Source data are provided as a Source Data file
Fig. 4
Fig. 4
The fitness costs of incomplete genomes may be mitigated by spatially structured spread. The dynamics of multi-cycle replication in a 100 × 100 grid of cells were simulated, starting from a single cell in the center of the grid. a The initial growth rate (estimated by the log-transformed number of cells that are productively infected in the first 12 h) is shown across a range of diffusion coefficients for a virus with PP = 1.0 (solid line) and PP = 0.58 (dashed line). bd The fitness cost of IVGs, as measured by the reduction in initial growth rate (b) or the increase in time taken to infect 100 cells (c) and produce 105 virions (d), is shown across a range of diffusion coefficients. The vertical dashed line represents the estimated value of D (5.825 µm2/s) for a spherical IAV particle in water. Each point shows the mean of ten simulations. Curves were generated by local regression. Shading represents 95% CI of local regression (mean ± 1.96 * SE). IVGs = incomplete viral genomes. Source data are provided as a Source Data file
Fig. 5
Fig. 5
Burst size of Pan/99 virus is constant over a range of high MOIs. a MDCK cells were inoculated with Pan/99-WT virus at MOIs of 1, 3, 6, 10, and 20 PFU/cell under single-cycle conditions. Infectious titers at each time point are shown, with MOI indicated by the colors defined in the legend. Dashed line indicates the limit of detection (50 PFU/mL). b Fraction of cells expressing HA at each MOI, as measured by flow cytometry staining of cells 12 h post inoculation. c Burst size in PFU produced per HA+ cell, with individual data points overlaid on bars. Text indicates mean ± SD estimate of burst size. In all panels, mean and standard error (N = 3 replicates per MOI) are plotted, and colors correspond to the legend in panel a. Source data are provided as a Source Data file
Fig. 6
Fig. 6
Complementation of incomplete genomes occurs efficiently at high MOI and during secondary spread from low MOI. a The model shown in Fig. 3 was used to calculate the probability that a given infected cell contained an IVG. The percentage of infected cells that contain fewer than eight segments is shown at a range of MOIs for PP = 0.58. b An infection in which multi-cycle replication occurs with the spatial structure was simulated as in Fig. 4. The maximum number of cells that contain IVGs in each simulation is shown for a range of diffusion coefficients. Shading represents 95% CI of local regression (mean ± 1.96 * SE). c Visualization of spatially structured and unstructured infections. Cells were inoculated with Pan/99-NP_TC virus and incubated under single-cycle conditions for 12 h (top), multi-cycle conditions for 12 h followed by single-cycle conditions for 12 h (middle), or sham-inoculated and incubated under single-cycle conditions for 12 h (bottom), then visualized by FlaSH staining (left) or phase-contrast imaging (right). Scale bar represents 200 µm. d The extent to which the presence of Pan/99-Helper virus increased WT HA positivity (% enrichment) was evaluated at the outset of infection (open blue circles) and following secondary spread (filled green circles). To gauge potential for complementation at the outset of infection, cells were simultaneously inoculated with Pan/99-WT virus and Pan/99-Helper, then incubated under single-cycle conditions for 12 h (N = 3 replicates per MOI, four MOIs per experiment, and three independent experiments). To test the impact of secondary spread on potential for complementation, cells were inoculated with Pan/99-WT virus at low MOI and incubated under multi-cycle conditions for 12 h, then inoculated with Pan/99-Helper virus and incubated under single-cycle conditions for 12 h (N = 3 replicates per MOI, two MOIs per experiment, and three independent experiments). Curves represent estimates of a fixed effects model with the formula %Enrichment=β1Multi-cycle%WTHA++β21%WTHA++β3*Multi - cycle, with shading representing 95% CI (mean ± 1.96 * SE) of model estimate. IVGs = incomplete viral genomes. Source data are provided as a Source Data file
Fig. 7
Fig. 7
Dependence on complementation hinders viral infectivity. a Mutation scheme used to generate M1.Only and M2.Only segments, and Pan/99-M.STOP virus. b Copies of M1.Only, M2.Only, and NS segments in three separate aliquots of Pan/99-M.STOP virus stock were quantified by digital droplet PCR. c Cells were inoculated with Pan/99-M.STOP virus, and incubated under single-cycle conditions before staining for HA, M1, and M2 expression (N = 3 replicates per dilution). The percentage of cells expressing M1, M2, and HA within M1+ or M2+ subpopulations is shown at each dilution. Lines represent linear regression with shading representing 95% CI (mean ± 1.96 * SE). d Titers of WT and M.STOP virus stocks were quantified by ddPCR targeting the NS segment (N = 2 (WT) or 3 (M.STOP) replicates), ddPCR targeting (any) M segment (N = 2 (WT) or 3 (M.STOP) replicates), immunotitration by flow cytometry (N = 1 replicate per virus per dilution), plaque assay (N = 6 replicates per virus), tissue culture ID50 (N = 4 replicates per virus per dilution), and guinea pig ID50 (N = 4 animals per virus per dose). All results are normalized to the ratio of NS ddPCR copy numbers. Source data are provided as a Source Data file
Fig. 8
Fig. 8
Dependence on complementation hinders viral transmission, but has a more modest effect on replication. a Guinea pigs were inoculated with 107 RNA copies of Pan/99-WT virus or Pan/99-M.STOP virus, and nasal washes were collected over 7 days to monitor shedding. NS segment copy number per mL of nasal lavage fluid is plotted (N = 4 animals). b Guinea pigs were inoculated with 107 or 1.23 × 104 RNA copies of Pan/99-WT virus, corresponding to 6.5 × 103 and eight guinea pig infectious dose (GPID50), respectively. Nasal washes were collected over 7 days to monitor shedding. NS segment copy number per mL of nasal lavage fluid is plotted for high (solid lines) and low (dashed lines) doses (N = 4 animals per group). c, d Guinea pigs were inoculated with 8 × GPID50 of Pan/99-WT virus (c) or Pan/99-M.STOP virus (d) and co-housed with uninfected partners after 24 h. Nasal washes were collected over the course of 8 days to monitor shedding kinetics and transmission between cagemates. NS segment copy number per mL of nasal lavage fluid is plotted (N = 2 animals per cage, four cages per group). In all plots, horizontal dotted lines represents the limit of detection (6696 RNA copies/mL). Source data are provided as a Source Data file

Similar articles

Cited by

References

    1. Pauly, M. D., Procario, M. C. & Lauring, A. S. A novel twelve class fluctuation test reveals higher than expected mutation rates for influenza A viruses. eLife610.7554/eLife.2643 (2017). - PMC - PubMed
    1. Chao L, Tran TT, Tran TT. The advantage of sex in the RNA virus phi 6. Genetics. 1997;147:953–959. - PMC - PubMed
    1. Ince WL, Gueye-Mbaye A, Bennink JR, Yewdell JW. Reassortment complements spontaneous mutation in influenza A virus NP and M1 genes to accelerate adaptation to a new host. J. Virol. 2013;87:4330–4338. doi: 10.1128/JVI.02749-12. - DOI - PMC - PubMed
    1. Chao L, Tran TR, Matthews C. Muller ratchet and the advantage of sex in the Rna Virus-Phi-6. Evol.; Int. J. Org. Evol. 1992;46:289–299. - PubMed
    1. Chao L. Fitness of RNA virus decreased by Muller’s ratchet. Nature. 1990;348:454–455. doi: 10.1038/348454a0. - DOI - PubMed

Publication types

MeSH terms