. 2019 Aug 6;10(1):3536.
doi: 10.1038/s41467-019-11302-w.

TonEBP/NFAT5 promotes obesity and insulin resistance by epigenetic suppression of white adipose tissue beiging

Affiliations

TonEBP/NFAT5 promotes obesity and insulin resistance by epigenetic suppression of white adipose tissue beiging

Hwan Hee Lee et al. Nat Commun. .

Abstract

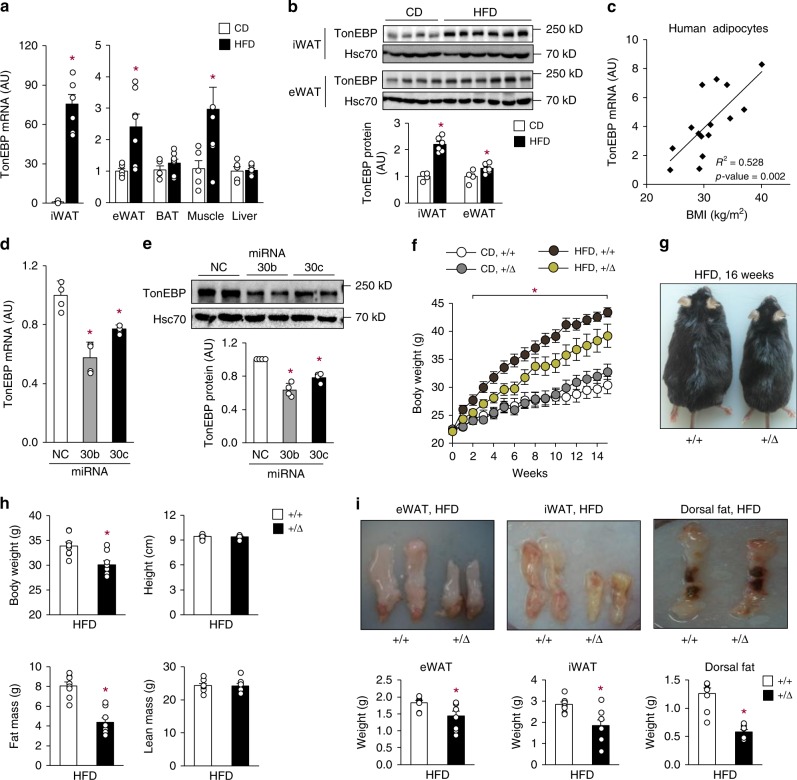
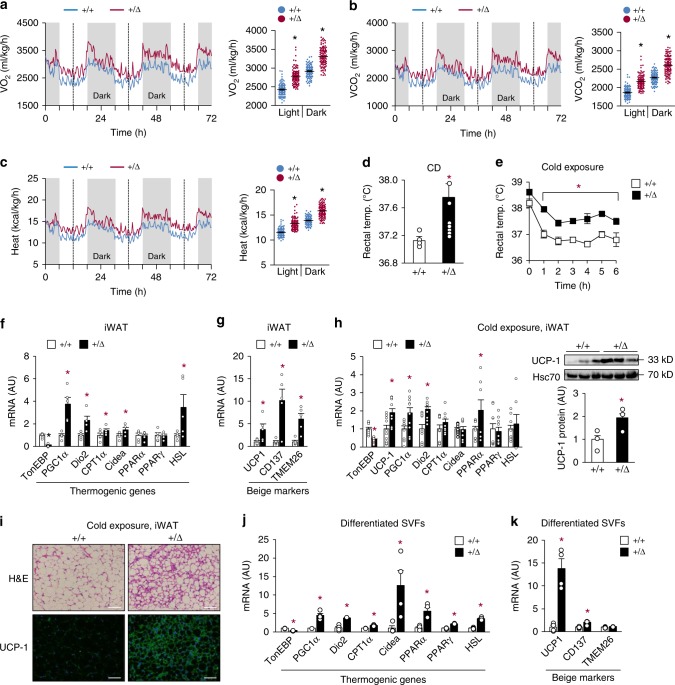
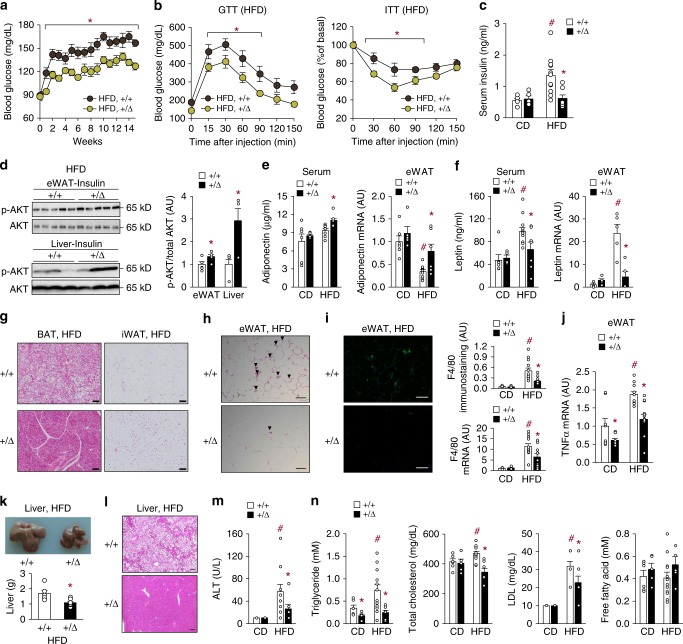
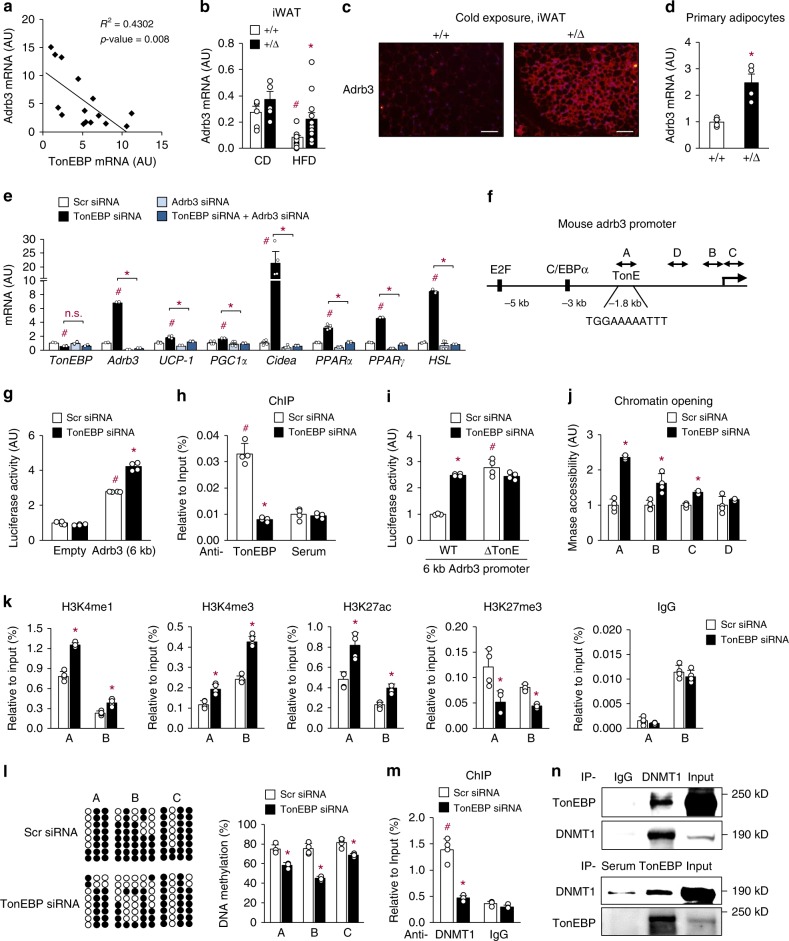
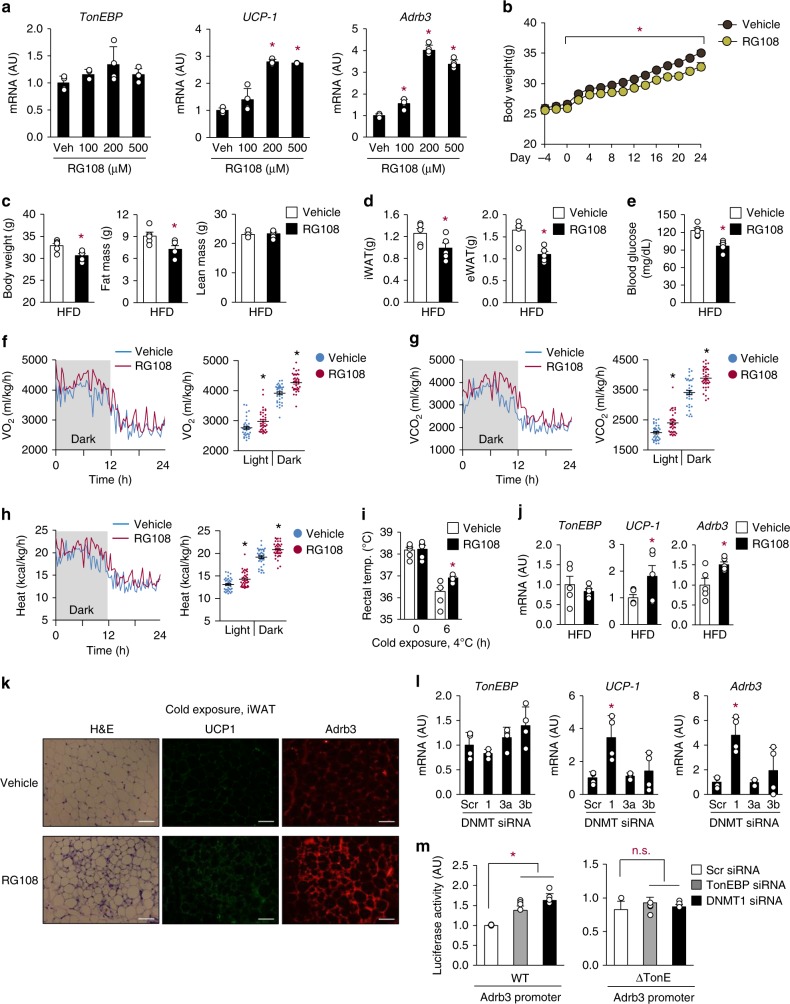
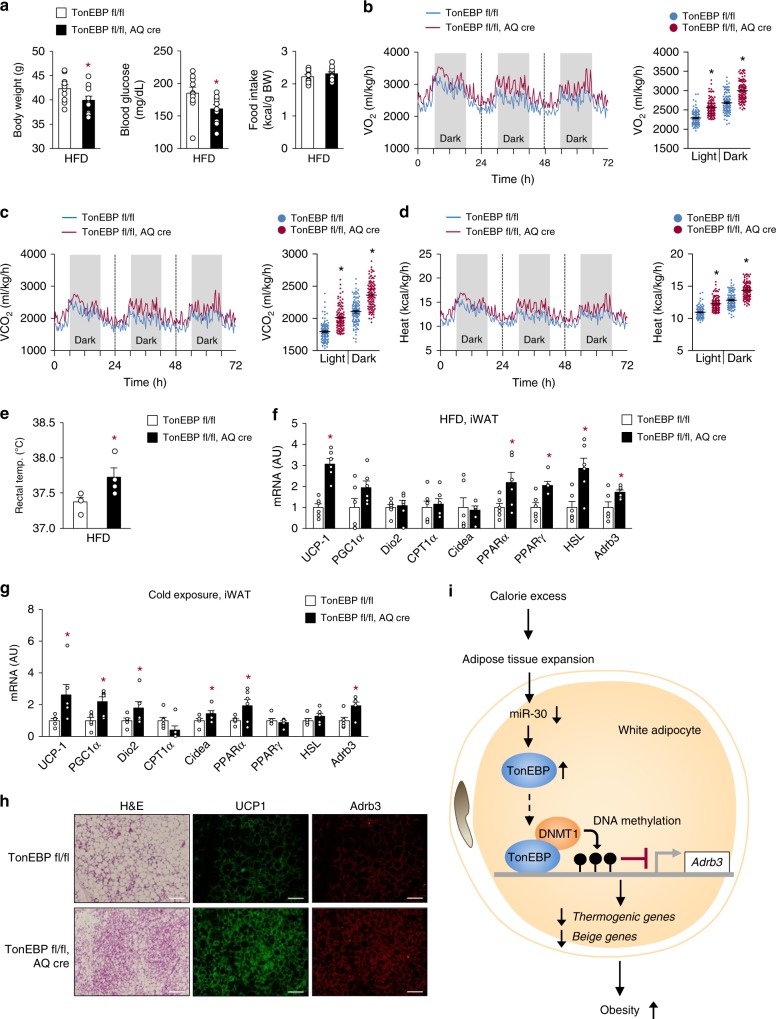
Tonicity-responsive enhancer binding protein (TonEBP or NFAT5) is a regulator of cellular adaptation to hypertonicity, macrophage activation and T-cell development. Here we report that TonEBP is an epigenetic regulator of thermogenesis and obesity. In mouse subcutaneous adipocytes, TonEBP expression increases > 50-fold in response to high-fat diet (HFD) feeding. Mice with TonEBP haplo-deficiency or adipocyte-specific TonEBP deficiency are resistant to HFD-induced obesity and metabolic defects (hyperglycemia, hyperlipidemia, and hyperinsulinemia). They also display increased oxygen consumption, resistance to hypothermia, and beiging of subcutaneous fat tissues. TonEBP suppresses the promoter of β3-adrenoreceptor gene, a critical regulator of lipolysis and thermogenesis, in ex vivo and cultured adipocytes. This involves recruitment of DNMT1 DNA methylase and methylation of the promoter. In human subcutaneous adipocytes TonEBP expression displays a correlation with body mass index but an inverse correlation with β3-adrenoreceptor expression. Thus, TonEBP is an attractive therapeutic target for obesity, insulin resistance, and hyperlipidemia.


Conflict of interest statement

The authors declare no competing interests.

Figures

Fig. 1
Fig. 1
Adipocyte TonEBP expression is elevated in obesity and TonEBP-deficient mice resist obesity. a TonEBP mRNA levels in iWAT, eWAT, BAT, muscle, and liver from C57BL/6 J mice fed with CD (chow diet, n = 5) or HFD (high-fat diet, n = 7) for 16 weeks. b Immunoblots (top) and quantification of protein levels (bottom) of TonEBP and Hsc70 in iWAT and eWAT (CD, n = 4; HFD, n = 6). c Correlation of TONEBP mRNA levels in human subcutaneous adipocytes and BMI (n = 15). TonEBP mRNA (d) and representative immunoblots (e, top) and quantification of protein levels (e, bottom) in 3T3-L1 adipocytes transfected with miR-negative control (NC), miR-30b (30b), or miR-30c (30c) (n = 4). fi TonEBP+/Δ mice ( + /Δ) and their TonEBP+/+ littermates (+/+) were fed with CD or HFD as indicated. f Changes in body weight after a switch to HFD (CD+/+, n = 7; CD + /Δ, n = 7; HFD+/+, n = 13; HFD+/Δ, n = 11). g Representative images of animals fed with HFD. h Body weight, height, fat mass, and lean mass (n = 8). i Representative images (top) and weight (bottom) of fat pads from HFD-fed animals (n = 4). n represents number of biologically independent samples (ac, i) or animals (fh) or independent experiments with triplicate (d, e). All data are presented as mean + s.e.m. (a, b, f, h, i) or + s.d. (d, e). AU, arbitrary unit. The p-values are determined by unpaired t-test (a,b, h, i) or one-way ANOVA (df). *p < 0.05 vs. CD (a), NC (d), or +/+ (f, h, i). Source data are provided as a Source Data file
Fig. 2
Fig. 2
TonEBP deficiency promotes energy expenditure and beiging of WAT. HFD-fed animals were analyzed by indirect calorimetry to obtain VO2 (a), VCO2 (b), and heat production (c) (n = 4). Rectal temperature (temp.) measured in CD-fed animals at room temperature (n = 8) (d) and after exposure to cold up to 6 h as indicated (4 °C) (n = 6) (e). f, g mRNA abundance of thermogenic genes (f) and beiging marker genes (g) in iWAT of HFD-fed animals (n = 5). h mRNA abundance of thermogenic genes (left, n = 10) and immunoblots of UCP-1 and Hsc70 (right, n = 3) in iWAT of CD-fed animals exposed to cold (4 °C). i Representative images of iWAT sections stained with H&E and UCP-1 antibody from CD-fed animals exposed to cold (4 °C). Scale bars, 100 μm. j, k Thermogenic gene (j) and beige marker (k) mRNA abundance in beige adipocytes differentiated from the stromal vascular cells of iWAT (n = 4). n represents number of biologically independent animals (ae) or samples (fk). ah, j, k All data are presented as mean + s.e.m. AU arbitrary unit. The p-values are determined by unpaired t-test (d, fk) or one-way ANOVA (ac, e). *p < 0.05 vs. +/+. Source data are provided as a Source Data file
Fig. 3
Fig. 3
TonEBP deficiency ameliorates obesity-induced insulin resistance and metabolic dysfunction. a Changes in fasting blood glucose levels after a switch to HFD (+/+, n = 13; +/Δ, n = 11). b Glucose tolerance (left, n = 8) and insulin tolerance (right, n = 9) after 9 weeks on HFD. cn Animals were analyzed after 16 weeks on HFD. c Circulating insulin concentrations (CD +/+, n = 5; CD +/Δ, n = 5; HFD +/+, n = 11; HFD +/Δ, n = 7). d Phosphorylation of AKT in eWAT (n = 5) and liver (n = 3) in response to insulin administration. e, f Serum concentration and mRNA abundance in eWAT of adiponectin (CD+ /+, n = 6; CD+ /Δ, n = 5; HFD+ /+, n = 9; HFD+ /Δ, n = 7) (e) and serum concentration (CD+ /+, n = 6; CD+ /Δ, n = 4; HFD+ /+, n = 12; HFD+/Δ, n = 7) and mRNA abundance (n = 5) in eWAT leptin (f). g Representative images of H&E-stained sections of BAT and iWAT. h Representative images of H&E-stained sections of eWAT. i Representative images of F4/80 immunostaining (left), quantitative analysis of F4/80 immunostaining (right, top), and F4/80 mRNA levels (right, bottom) of eWAT (CD, n = 8; HFD, n = 12). j TnFα mRNA levels in eWAT (CD, n = 8; HFD, n = 12). k Representative images (top) and liver weight (bottom) ( + / + , n = 6; + /Δ, n = 8). l Representative images of H&E-stained liver sections. ALT concentrations (CD, n = 5; HFD, n = 10) (m), and triglyceride, cholesterol (total and LDL), and free fatty acid levels (CD+  /+, n = 6; CD+/Δ, n = 5; HFD+/+, n = 12; HFD+ /Δ, n = 7) (n). n represents number of biologically independent samples. All data are presented as mean + s.e.m. Scale bars, 100 μm (gi, l). AU arbitrary unit. The p-values are determined by unpaired t-test (d, k) or one-way ANOVA (ac, e, f, l, j, m, n). #p < 0.05 vs. NC, *p < 0.05 vs.+/+. Source data are provided as a Source Data file
Fig. 4
Fig. 4
TonEBP suppresses Adrb3 gene expression. a Correlation of TonEBP mRNA with Adrb3 mRNA in human subcutaneous adipocytes (n = 15). b Adrb3 mRNA levels in iWAT from animals fed with a CD or HFD (CD, n = 5; HFD, n = 13). c Adrb3 immunostaining of iWAT from animals exposed to cold (4 °C). Scale bars, 100 μm. d Adrb3 mRNA abundance in primary adipocytes (n = 4). e mRNA abundance of thermogenic genes in 3T3-L1 adipocytes transfected with various siRNA’s as indicated (n = 4). f Schematic representation of the mouse Adrb3 gene promoter including the TonEBP binding site (TonE). A–C indicate regions for bisulfite sequencing (n = 4). g 3T3-L1 adipocytes were transfected with siRNA followed by an Adrb3 promoter-luciferase reporter construct. Luciferase was measured (n = 4). h TonEBP binding to the TonE (A region) of the Adrb3 promoter in 3T3-L1 adipocytes (n = 4). i The Adrb3 promoter-luciferase reporter described above (WT) and a mutant reporter where TonE was removed (ΔTonE) were analyzed in 3T3-L1 adipocytes (n = 4). Chromatin accessibility of A, B, C, and D regions (see f) (j), and ChIP assay for H3K4me1, H3K4me3, H3K27ac, H3K27me3 and normal rabbit IgG (k) for A and B regions, on the Adrb3 promoter region of 3T3-L1 adipocytes (n = 4). l DNA methylation analysis of the Adrb3 promoter using bisulfite sequencing in 3T3-L1 adipocytes. Left: bacterial clones without (open circles) or with methylation (solid circles) from representative experiments are shown. Right: % of DNA methylation, mean + s.d. (n = 4). m ChIP assay for DNMT1 on the Adrb3 promoter in 3T3-L1 adipocytes (n = 4). n Co-immunoprecipitation analyses of TonEBP and DNMT1 in 3T3-L1 adipocytes. n represents number of biologically independent samples (a, b, d) or independent experiments with triplicate (e, gm). All data are presented as mean + s.e.m. (b, d) or + s.d. (e, gm). AU arbitrary unit. The p-values are determined by unpaired t-test (d, jl) or one-way ANOVA (b, e, g, h, m). #p < 0.05 vs. CD (a, b), scr siRNA (e), empty vector (g), anti-rabbit serum (h), WT (i), or anti-rabbit IgG (m). *p < 0.05 vs. +/+ (ad), TonEBP siRNA (e), or scr siRNA (gm). Source data are provided as a Source Data file
Fig. 5
Fig. 5
DNMT suppresses WAT beiging and Adrb3 expression. a TonEBP, UCP-1 and Adrb3 mRNA levels in 3T3-L1 adipocytes treated with 0–500 μM RG108 as indicated for 24 h (n = 4). be Animals were treated with vehicle or RG108 every 2 days from day −4 to 24. All animals were switched from CD to HFD on day 0 (n = 5). Body weight (b), body composition by echo MRI (c), fat pad mass (iWAT and eWAT) (d), and fasting blood glucose levels (e) were measured. fk Animals were treated as above, except that the experiments were terminated on day 8 (n = 4). VO2 (f), VCO2 (g), heat production (h), and rectal temperature (i) were measured. TonEBP, UCP-1, and Adrb3 mRNA (j) were measured, and H&E and immunostaining for UCP-1 and Adrb3 (k) were performed from iWAT. Scale bars, 100 μm. l TonEBP, UCP-1, and Adrb3 mRNA levels in 3T3-L1 adipocytes transfected with scr siRNA, DNMT1 (1), DNMT3a (3a) or DNMT3b (3b) siRNA (n = 4). m 3T3-L1 adipocytes transfected with siRNA were transfected a second time with WT (left) or ΔTonE (right) Adrb3 promoter-luciferase reporter. Luciferase activity was measured (n = 4). n represents number of independent experiments with triplicate (a, l, m) or biologically independent samples (bj). All data are presented as mean + s.d. (a, l, m) or s.e.m. (e, gm). AU arbitrary unit. The p-values are determined by unpaired t-test (ce, j) or one-way ANOVA (a, b, fi, l, m). *p < 0.05 vs. 0 (a), vehicle (bj), or scr siRNA (l, m). Source data are provided as a Source Data file
Fig. 6
Fig. 6
Adipocyte-specific TonEBP deficiency promotes energy expenditure and beiging of WAT. a Body weight, fasting blood glucose, and food intake by adipocyte-specific TonEBP knockout mice (TonEBPfl/fl, AQ-cre) and their cre-negative littermates (TonEBP fl/fl) fed with HFD for 12 weeks (n = 10). VO2 (b), VCO2 (c), heat production (d), and rectal temperature (e) analyzed in animals fed with HFD (n = 4). mRNA expression of thermogenic genes in iWAT from animals fed with HFD (f) or exposed to cold conditions (g) (n = 4). h Representative images of iWAT sections stained with H&E, UCP-1, and Adrb3 antibody from CD-fed animals exposed to cold (4 °C). Scale bars, 100 μm. i Proposed model for the inhibition of beiging in white adipocytes by TonEBP. TonEBP is induced by excess calorie intake. It binds to the Adrb3 promoter where it recruits DNMT1 leading to DNA methylation and suppression of the promoter. n represents number of biologically independent animals (ae) or samples (f, g). All data are presented as mean + s.e.m. AU arbitrary unit. The p-values are determined by unpaired t-test (ae) or one-way ANOVA (bd, f, g). *p < 0.05 vs. TonEBPfl/fl. Source data are provided as a Source Data file

References

    1. Ouchi N, Parker JL, Lugus JJ, Walsh K. Adipokines in inflammation and metabolic disease. Nat. Rev. Immunol. 2011;11:85–97. doi: 10.1038/nri2921. - DOI - PMC - PubMed
    1. Trayhurn P. Hypoxia and adipocyte physiology: implications for adipose tissue dysfunction in obesity. Annu. Rev. Nutr. 2014;34:207–236. doi: 10.1146/annurev-nutr-071812-161156. - DOI - PubMed
    1. Wu J, et al. Beige adipocytes are a distinct type of thermogenic fat cell in mouse and human. Cell. 2012;150:366–376. doi: 10.1016/j.cell.2012.05.016. - DOI - PMC - PubMed
    1. Harms M, Seale P. Brown and beige fat: development, function and therapeutic potential. Nat. Med. 2013;19:1252–1263. doi: 10.1038/nm.3361. - DOI - PubMed
    1. Miyakawa H, Woo SK, Dahl SC, Handler JS, Kwon HM. Tonicity-responsive enhancer binding protein, a rel-like protein that stimulates transcription in response to hypertonicity. Proc. Natl Acad. Sci. USA. 1999;96:2538–2542. doi: 10.1073/pnas.96.5.2538. - DOI - PMC - PubMed

Publication types

MeSH terms