. 2019 Aug 6;10(1):3529.
doi: 10.1038/s41467-019-11437-w.

Haploinsufficiency in the ANKS1B gene encoding AIDA-1 leads to a neurodevelopmental syndrome

Affiliations

Haploinsufficiency in the ANKS1B gene encoding AIDA-1 leads to a neurodevelopmental syndrome

Abigail U Carbonell et al. Nat Commun. .

Abstract

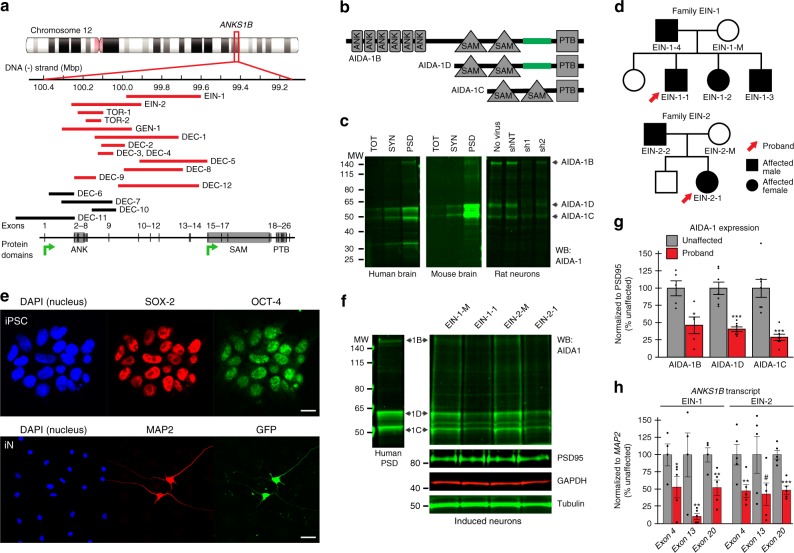
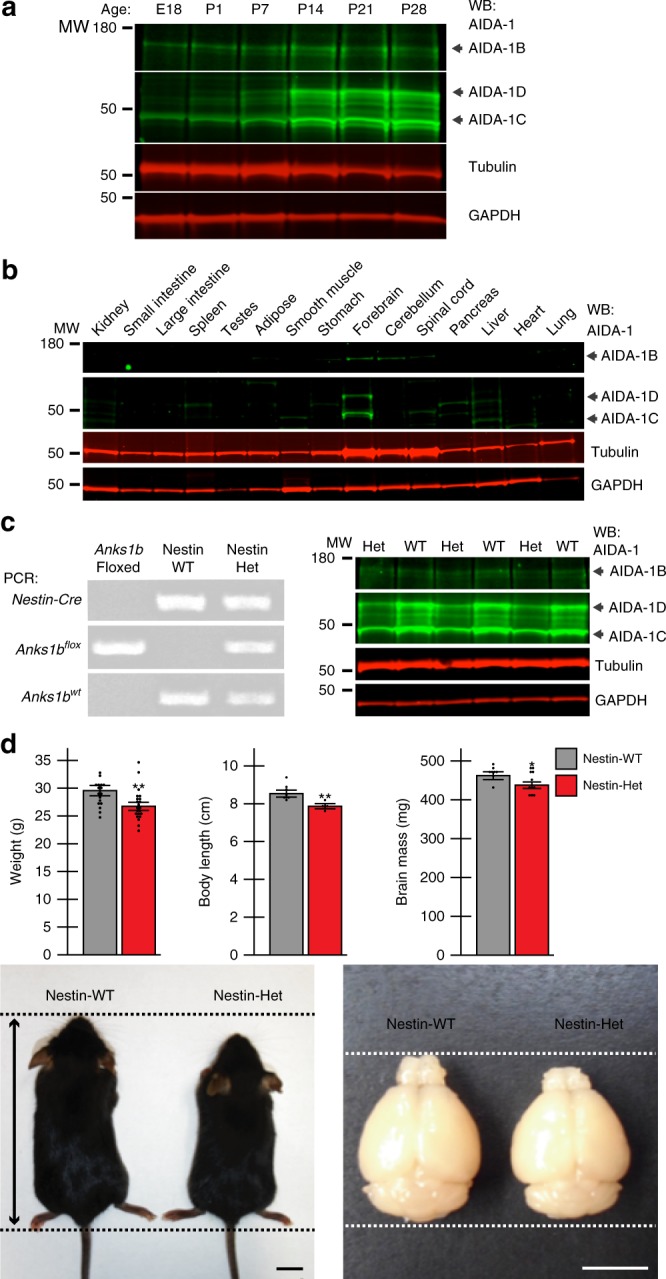
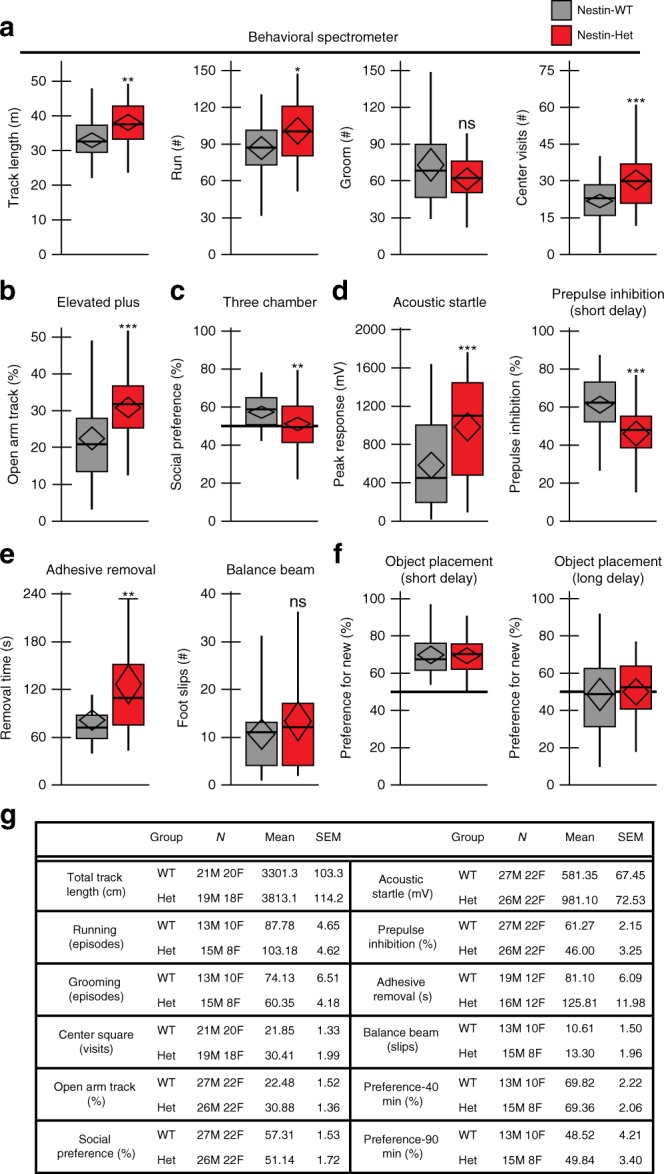
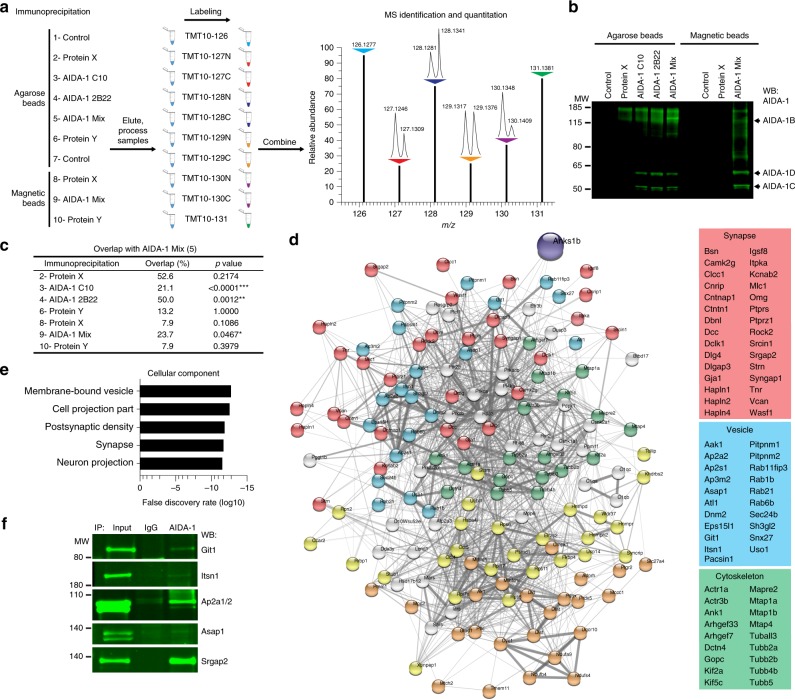
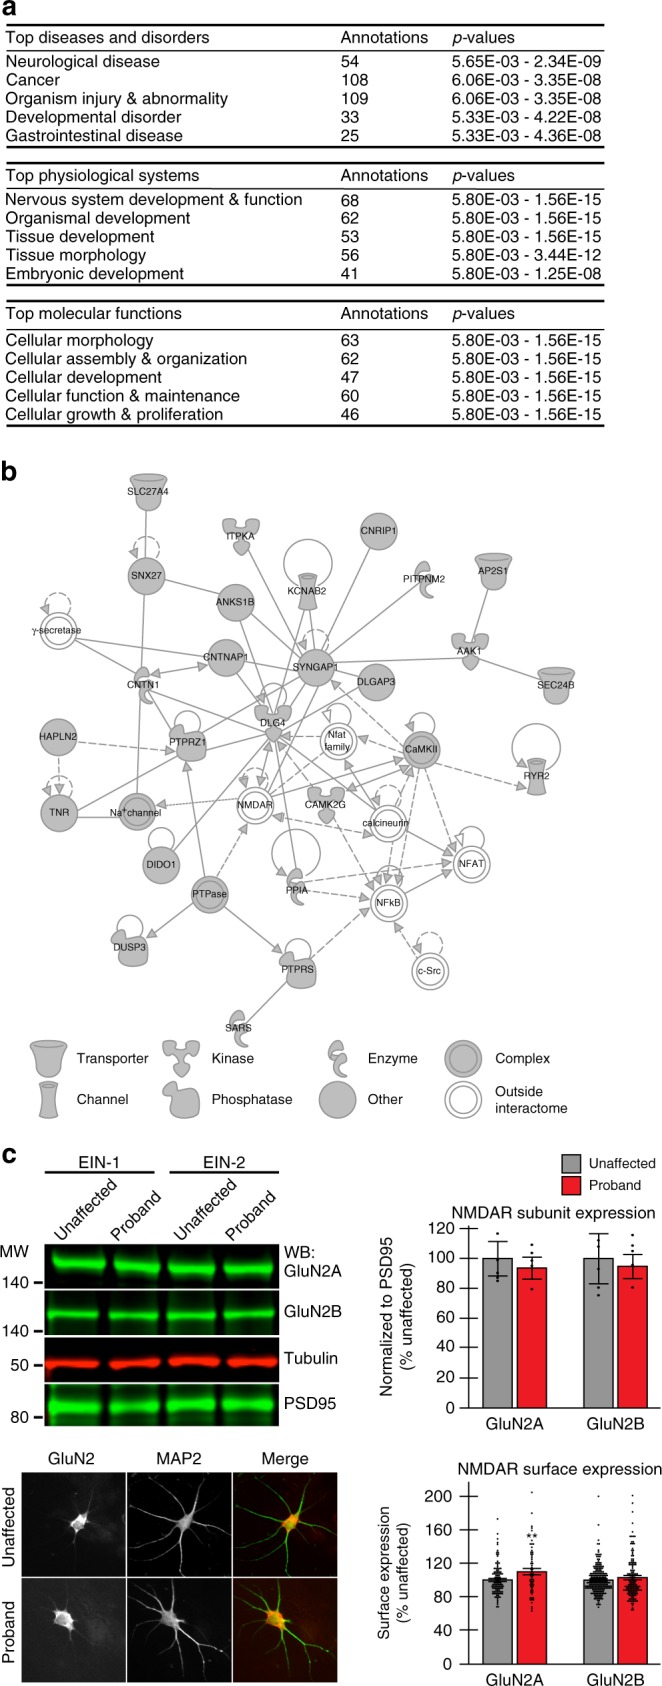
Neurodevelopmental disorders, including autism spectrum disorder, have complex polygenic etiologies. Single-gene mutations in patients can help define genetic factors and molecular mechanisms underlying neurodevelopmental disorders. Here we describe individuals with monogenic heterozygous microdeletions in ANKS1B, a predicted risk gene for autism and neuropsychiatric diseases. Affected individuals present with a spectrum of neurodevelopmental phenotypes, including autism, attention-deficit hyperactivity disorder, and speech and motor deficits. Neurons generated from patient-derived induced pluripotent stem cells demonstrate loss of the ANKS1B-encoded protein AIDA-1, a brain-specific protein highly enriched at neuronal synapses. A transgenic mouse model of Anks1b haploinsufficiency recapitulates a range of patient phenotypes, including social deficits, hyperactivity, and sensorimotor dysfunction. Identification of the AIDA-1 interactome using quantitative proteomics reveals protein networks involved in synaptic function and the etiology of neurodevelopmental disorders. Our findings formalize a link between the synaptic protein AIDA-1 and a rare, previously undefined genetic disease we term ANKS1B haploinsufficiency syndrome.


Conflict of interest statement

The authors declare no competing interests.

Figures

Fig. 1
Fig. 1
ANKS1B microdeletions reduce AIDA-1 expression in patient-derived neurons. a Monogenic microdeletions (red bars) in patients span multiple exons in the ANKS1B gene. Black bars represent patients with additional CNVs in other genes. Green arrows represent putative transcription start sites. b ANKS1B encodes AIDA-1B, AIDA-1D, and AIDA-1C protein isoforms. c (Left) Western blots show that all three major AIDA-1 isoforms are expressed in total lysate (TOT) and enriched in synaptic (SYN) and postsynaptic density (PSD) fractions in postmortem human and mouse brain (5 μg lysate). (Right) Lentivirus-mediated knockdown of AIDA-1 in primary rat neurons (DIV 14-21) using two different shRNAs (sh1 and sh2 = AIDA-1 specific; shNT = scrambled control shRNA) confirms antibody specificity (20 μg lysate). d Pedigree of EIN-1 and EIN-2 families. e (Top) IPSCs generated from probands (EIN-1-1 and EIN-2-1) and unaffected mothers (EIN-1-M and EIN-2-M) express Oct-4 and Sox-2 pluripotency markers. (Bottom) Induced neurons (iNs) generated from forced NGN2 expression (GFP) in iPSCs show typical neuronal morphology and express the mature neuronal marker MAP2. Nuclei from non-neuronal cells are co-cultured rat astrocytes added to improve neuronal viability and maturation. Scale bars = 10 μm. f Western blots of AIDA-1 and PSD95 show that AIDA-1 isoforms are significantly reduced in probands EIN-1-1 and EIN-2-1 compared to unaffected mothers EIN-1-M and EIN-2-M (10 μg lysate). g Quantitation of AIDA-1 expression normalized to neuronal marker PSD95 from Family EIN-2. N = 5–7 biological replicates. Bar graphs show mean ± SEM, two-sided Student’s t-test, *p < 0.05 ***p < 0.001. h RT-qPCR of exons 4, 13, and 20 spanning the ANKS1B gene and normalized to neuronal marker MAP2 are reduced in probands from both families. N = 4–5 biological replicates for each family. Bar graphs show mean ± SEM, one-sided Student’s t-test, *p < 0.05, **p < 0.01, ***p < 0.001, #p = 0.052
Fig. 2
Fig. 2
Heterozygous Anks1b knockout mice are viable and show reduced AIDA-1 expression. a Western blots show AIDA-1B is expressed in mouse brain tissue from embryonic development to adulthood. AIDA-1D and 1C expression increases until reaching stable levels in the adult brain. Tubulin and GAPDH levels are shown as loading controls (20 μg lysate). E = embryonic day, P = postnatal day. b AIDA-1 isoforms are selectively expressed in whole mouse brain and cerebellum (20 μg lysate). c (Left) PCR genotyping to identify Nestin-Het mice. (Right) Western blots show reduced expression of AIDA-1 isoforms in Nestin-Het mice (20 μg lysate). d Male Nestin-Het mice show decreased total weight (26.7 ± 0.6 g, mean ± SEM) compared to Nestin-WT controls (29.5 ± 0.8 g); N = 41 mice. Body length was also reduced (7.88 ± 0.09 cm) compared to controls (8.55 ± 0.14 cm); N = 13 mice, scale bar in representative image = 1 cm. Brain mass was also reduced (Nestin-Het = 442.7 ± 8.5 mg, Nestin-WT = 467.5 ± 6.2 mg); N = 19 mice, scale bar in representative image = 0.5 cm. Bar graphs show mean ± SEM, two-sided Student’s t-test, *p < 0.05, **p < 0.01. No statistically significant differences were observed in female mice (Supplementary Data 4)
Fig. 3
Fig. 3
Anks1b heterozygous mice recapitulate phenotypes in ANKS1B haploinsufficiency syndrome. a In the Behavioral Spectrometer, Nestin-Het mice covered more track in 9 min and had more episodes of running than Nestin-WT controls. Reduction in grooming behavior was not statistically significant. Nestin-Het mice visit the center square of an open field more often than controls. b Nestin-Het mice showed a robust reduction in avoidance behaviors, covering more track in the open arms as a percentage of total track in open and closed arms of an elevated plus maze. c In the three-chamber test, Nestin-Het mice show significantly reduced and borderline preference for a conspecific mouse over an inanimate object. d Peak magnitude of the acoustic startle reflex is robustly increased in Nestin-Het mice. Sensorimotor gating measured by the percentage of prepulse inhibition (prepulse stimulus 40 ms before startle stimulus) is significantly reduced. e In a test of fine-motor dexterity, Nestin-Het mice require more time to remove adhesive from the forepaw. Nestin-Het mice do not exhibit significant deficits in gross motor coordination as measured by slips on a balance beam. f Nestin-Het mice do not show learning deficits in the object placement test, a hippocampus-dependent memory assay. Both groups averaged above a passing score (>50% preference for new location) using a 40-min retention interval. Raising the task difficulty by increasing the retention interval to 90 min did not result in a difference: mean values indicate that mice of both genotypes failed the test at 90 min (<50% preference). Reference line indicates 50% preference. Box plots show the mean and 95% confidence intervals (black diamond), median (black line), 25th–75th quantile (gray or red bar), and range (black whiskers). If two-way ANOVA showed significant main effect of genotype, post hoc two-sided Student’s t-test was performed, *p < 0.05, **p < 0.01, ***p < 0.001, ns = p > 0.05. g Numbers and sex of mice tested with the measures for each behavioral assay are shown as the mean and SEM. No sex-dependent effects of genotype were observed in any behavioral test by two-way ANOVA (Supplementary Data 5)
Fig. 4
Fig. 4
Identification of the AIDA-1 interactome by mass spectrometry reveals novel cellular roles. a Ten immunoprecipitations (IPs), including four IPs using different AIDA-1 antibodies (C-10, 2B22, or Mix) and beads (agarose or magnetic), two control IPs using mouse IgG, and four control IPs of unrelated synaptic proteins. Samples were differentially labeled using isobaric tags and mixed for MS analysis. Peptides bearing each isobaric tag were simultaneously identified and quantified. b Western blots showing AIDA-1 isoforms immunoprecipitated by AIDA-1 antibody combinations. Only antibody 1A11 (included in AIDA-1 Mix) was able to pull down AIDA-1B. c Overlap of interactors from the AIDA-1 Mix Agarose sample was significant only with interactors from other AIDA-1 IPs by two-sided Fisher’s exact test, *p < 0.05, **p < 0.01, ***p < 0.001. d Depiction of the AIDA-1 interactome prominently featuring components of the synaptic compartment, membrane-bound vesicles, and cytoskeletal projections. (Yellow = ribosome and proteasome; Orange = mitochondria). e Top gene ontology (GO) terms for cellular components enriched in the AIDA-1 interactome. f Co-IP of novel AIDA-1 interactors from mouse brain lysates. Git1 = 84 kDa, Itsn1 = 195 kDa, Ap2a1/2 = 108/104 kDa, Asap1 = 125 kDa, Srgap2 = 121 kDa
Fig. 5
Fig. 5
Analysis of the AIDA-1 interactome yields functional pathways and mechanisms of disease. a Hierarchical analysis of the most significant diseases and functions in IPA reveals the top disorders, physiological systems, and cellular processes regulated by the AIDA-1 interactome (p-values are given as a range for the diseases and functions annotated in each category). b The top network identified using Ingenuity Pathway Analysis (IPA) revealed known interactors and novel pathways associated with AIDA-1 (network score = 49, number of focus molecules = 25). Solid lines = direct interaction, dashed lines = indirect interaction, filled arrows = activation, open arrows = translocation, dash = inhibition. c (Top) Western blot (Family EIN-1 and EIN-2) and quantitation (Family EIN-2) of NMDAR subunits GluN2A and GluN2B in iPSC-derived neurons show no changes in probands (10 μg lysate). N = 3 biological replicates. (Bottom) Sample images (GluN2B) and quantitation of GluN2A and GluN2B surface expression in neurons from proband EIN-2-1 and unaffected mother EIN-2-M reveal a significant increase in GluN2A, but no change in GluN2B. N = 3 biological replicates based on 60–99 neurons. Scale bar = 10 μm. Bar graphs show mean ± SEM, two-sided Student’s t-test, *p < 0.05, **p < 0.01

References

    1. Geschwind DH. Genetics of autism spectrum disorders. Trends Cogn. Sci. 2011;15:409–416. doi: 10.1016/j.tics.2011.07.003. - DOI - PMC - PubMed
    1. Weiner DJ, et al. Polygenic transmission disequilibrium confirms that common and rare variation act additively to create risk for autism spectrum disorders. Nat. Genet. 2017;49:978–985. doi: 10.1038/ng.3863. - DOI - PMC - PubMed
    1. Krumm N, et al. Excess of rare, inherited truncating mutations in autism. Nat. Genet. 2015;47:582–588. doi: 10.1038/ng.3303. - DOI - PMC - PubMed
    1. Marshall CR, Scherer SW. Detection and characterization of copy number variation in autism spectrum disorder. Methods Mol. Biol. 2012;838:115–135. doi: 10.1007/978-1-61779-507-7_5. - DOI - PubMed
    1. Hu VW, Addington A, Hyman A. Novel autism subtype-dependent genetic variants are revealed by quantitative trait and subphenotype association analyses of published GWAS data. PLoS ONE. 2011;6:e19067. doi: 10.1371/journal.pone.0019067. - DOI - PMC - PubMed

Publication types

MeSH terms

Substances