. 2019 Aug 6;10(1):3452.
doi: 10.1038/s41467-019-11390-8.

Camouflaging bacteria by wrapping with cell membranes

Affiliations

Camouflaging bacteria by wrapping with cell membranes

Zhenping Cao et al. Nat Commun. .

Erratum in

Abstract

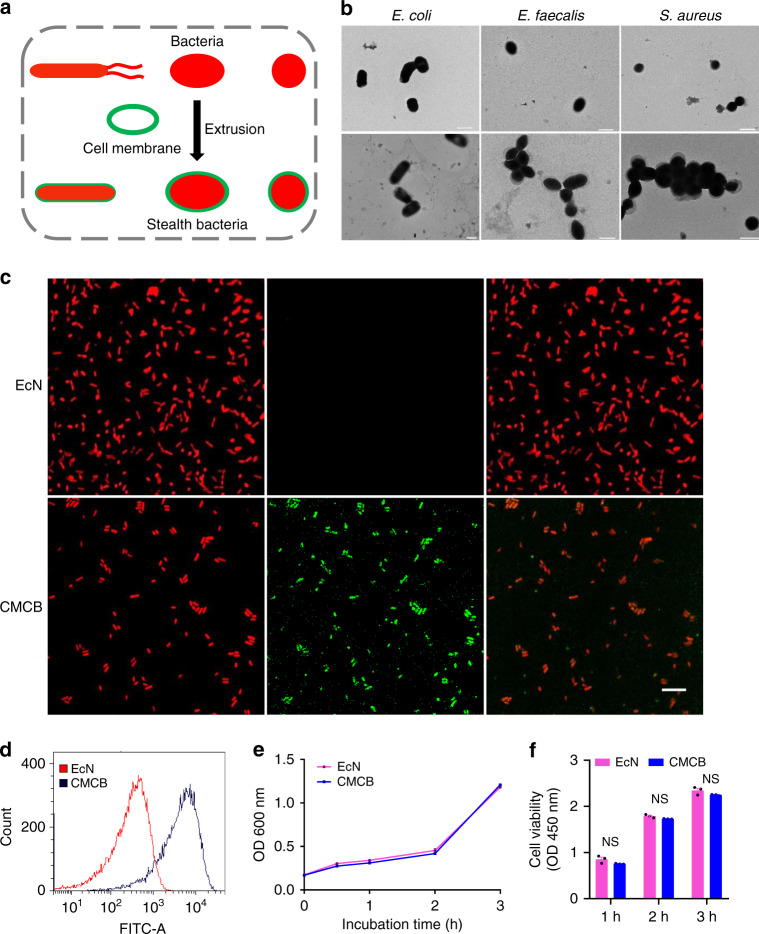
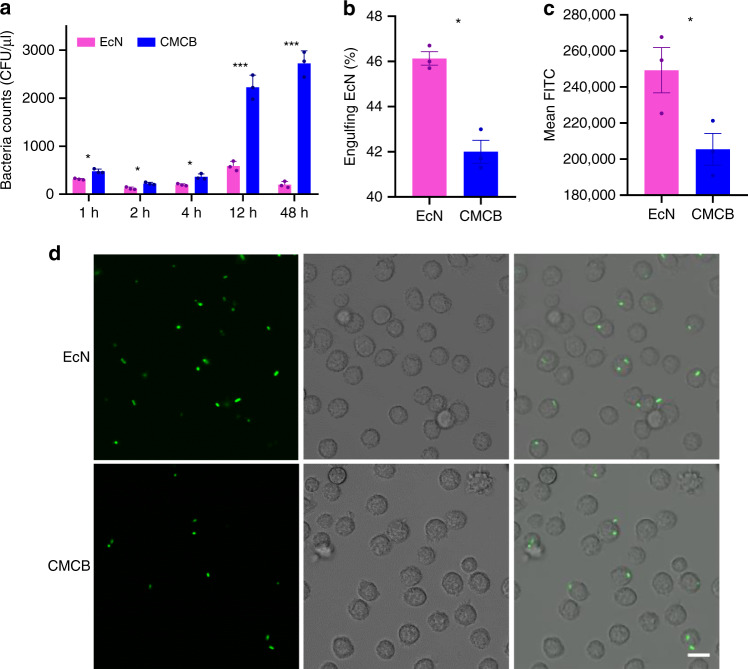
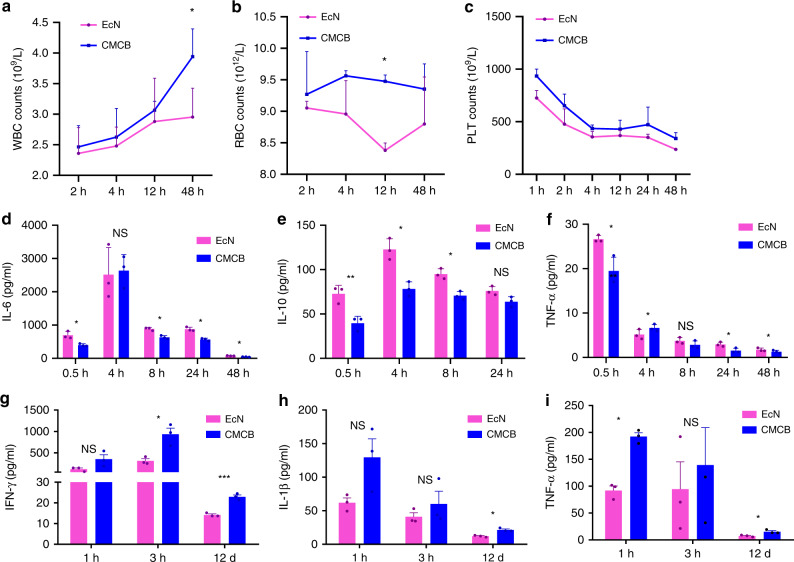
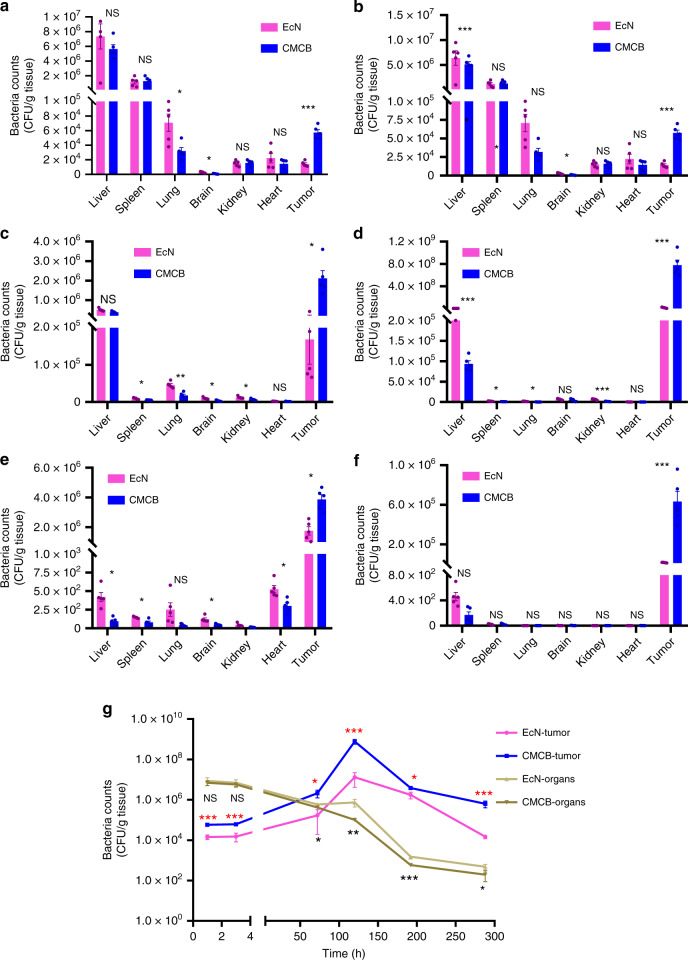
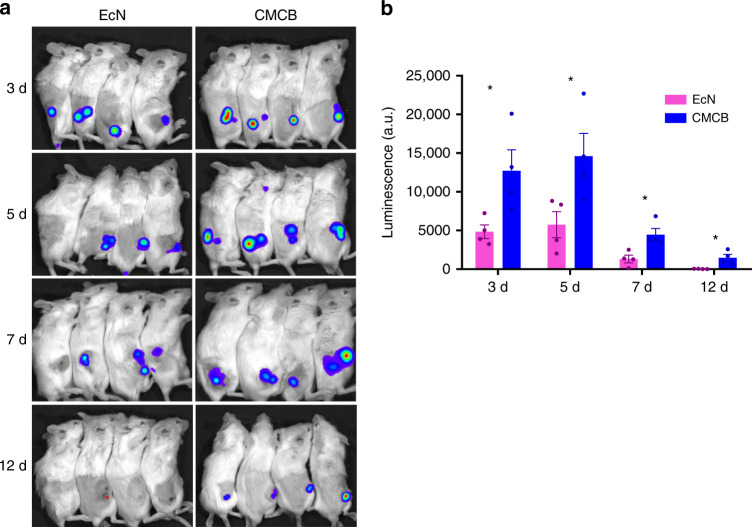
Bacteria have been extensively utilized for bioimaging, diagnosis and therapy given their unique characteristics including genetic manipulation, rapid proliferation and disease site targeting specificity. However, clinical translation of bacteria for these applications has been largely restricted by their unavoidable side effects and low treatment efficacies. Engineered bacteria for biomedical applications ideally need to generate only a low inflammatory response, show slow elimination by macrophages, low accumulation in normal organs, and almost unchanged inherent bioactivities. Here we describe a set of stealth bacteria, cell membrane coated bacteria (CMCB), meeting these requirement. Our findings are supported by evaluation in multiple mice models and ultimately demonstrate the potential of CMCB to serve as efficient tumor imaging agents. Stealth bacteria wrapped up with cell membranes have the potential for a myriad of bacterial-mediated biomedical applications.


Conflict of interest statement

The authors declare no competing interests.

Figures

Fig. 1
Fig. 1
Preparation and characterization of CMCB. a Schematic illustration for the preparation of CMCB by extruding bacteria with cell membranes. b Representative TEM images of uncoated bacteria and CMCB. Scale bar, 1 μm. c LSCM images of EcN and CMCB. The red channel shows EcN producing mCherry, the green channel shows cell membranes conjugated with FITC-affinity anti-CD47-antibody, and the merge (orange) shows CMCB. Left mCherry, Middle FITC, Right merge. Scale bar, 10 μm. d Flow cytometric analysis of EcN and CMCB. e Growth curves of EcN and CMCB. Bacteria were cultured in LB medium at 37 °C and OD600 was measured at the indicated time points. f Bacterial viability analysis of EcN and CMCB by CCK-8 assays. Bacteria were incubated at 37 °C and viability was monitored by measuring OD450 at 1 h intervals. Error bars represent the standard deviation (n = 3). NS no significance
Fig. 2
Fig. 2
Evaluation of in vivo blood reservation. a In vivo blood reservation of bacteria. EcN or CMCB (1 × 107 CFUs) were injected through the tail vein and blood was withdrawn intraorbitally at the indicated time points, diluted to 10−2 and spread onto LB agar plates. Plates were incubated at 37 °C for 24 h prior to enumeration. bd Bacterial engulfment by primary peritoneal macrophages. Macrophages were co-cultured with EcN or CMCB at 37 °C with 5% CO2 for 1 h. b The percentage of macrophages containing bacteria and c the mean fluorescent intensity of the engulfed bacteria was measured by flow cytometric analysis. Error bars represent the standard deviation (n = 3). Significance was assessed using Student’s t-test, giving p-values, *p < 0.05, **p < 0.01, ***p < 0.005. d LSCM images of macrophages after co-incubated with EcN or CMCB expressing GFP at 37 °C with 5% CO2 for 1 h. Scale bar, 10 μm
Fig. 3
Fig. 3
Assessment of in vivo inflammatory response. af EcN or CMCB (1 × 107 CFUs) were injected through the tail vein and blood was withdrawn intraorbitally at the indicated time points. ac Routine blood analysis including WBC, RBC and PLT counts. df Levels of cytokines in serum measured by commercially available ELISA kits, including IL-6, IL-10, and TNF-α. gi Measurement of cytokines including g IFN-γ, h IL-1β, and i TNF-α in 4T1 tumor-bearing mice. Each mouse was treated with EcN or CMCB (1 × 107 CFUs) through the tail vein and blood was withdrawn intraorbitally at the indicated time points. Error bars represent the standard deviation (n = 3). Significance was assessed using Student’s t-test, giving p values, *p < 0.05, **p < 0.01, ***p < 0.005. NS no significance
Fig. 4
Fig. 4
Biodistribution of bacteria in tumor-bearing mice. 4T1 tumor-bearing mice with tumor volume around 50 mm3 were intravenously injected with EcN or CMCB (1 × 107 CFUs) and then sacrificed at indicated time points. Organ homogenates were diluted and cultured on LB agar plates at 37 °C for 24 h prior to enumeration. Biodistribution at a 1 h, b 3 h, c 3 days, d 5 days, e 8 days, f 12 days post-injection, respectively. g The relationship between time post-injection and bacterial number within normal organs and tumor. Error bars represent the standard deviation (n = 5). Significance was assessed using Student’s t-test, giving p-values, *p < 0.05, **p < 0.01, ***p < 0.005. NS no significance
Fig. 5
Fig. 5
In vivo tumor imaging. a Tumor imaging of 4T1 tumor-bearing mice at 3, 5, 7, and 12 days post-injection of EcN or CMCB expressing LuxCDABE (1 × 107 CFUs). b Intensity of luminescence signals from the tumor sites. Error bars represent the standard deviation (n = 4). Significance was assessed using Student’s t-test, giving p-values, *p < 0.05
Fig. 6
Fig. 6
Analysis of bacterial decoating. ac Assays for the stability of the coating membranes. The ratios of CMCB to uncoated bacteria were measured by flow cytometry at various time points after CMCB were incubated in a 100% serum and LB medium at 37 °C, b ice-cold PBS, and c 100% serum with 5 μg/ml of SMX. Error bars represent the standard deviation (n = 3). d Representative LSCM images of bacteria after culturing CMCB in PBS at 37 °C for 1 h. The red channel shows EcN expressing mCherry, the green channel shows cell membranes labelled with FITC-affinity anti-CD47-antibody, and the merge (light orange) shows CMCB. Scale bar, 10 μm. e A representative image of membrane shedding captured by TEM. Scale bar, 1 μm. f Schematic illustration for the removal of coating membranes

References

    1. Kaiko GE, Stappenbeck TS. Host-microbe interactions shaping the gastrointestinal environment. Trends Immunol. 2014;35:538–548. - PMC - PubMed
    1. Bourdeau RW, et al. Acoustic reporter genes for noninvasive imaging of microorganisms in mammalian hosts. Nature. 2018;553:86–90. - PMC - PubMed
    1. Min JJ, Nguyen VH, Kim HJ, Hong Y, Choy HE. Quantitative bioluminescence imaging of tumor-targeting bacteria in living animals. Nat. Protoc. 2008;3:629–636. - PubMed
    1. Chen J, et al. Oncolytic adenovirus complexes coated with lipids and calcium phosphate for cancer gene therapy. ACS Nano. 2016;10:11548–11560. - PubMed
    1. Pol J, et al. Trial watch:: oncolytic viruses for cancer therapy. Oncoimmunology. 2014;3:e28694. - PMC - PubMed

Publication types

MeSH terms

Substances