

Variants Associated with the Ankle Brachial Index Differ by Hispanic/Latino Ethnic Group: a genome-wide association study in the Hispanic Community Health Study/Study of Latinos
- PMID: 31388106
- PMCID: PMC6684818
- DOI: 10.1038/s41598-019-47928-5
Variants Associated with the Ankle Brachial Index Differ by Hispanic/Latino Ethnic Group: a genome-wide association study in the Hispanic Community Health Study/Study of Latinos
Abstract
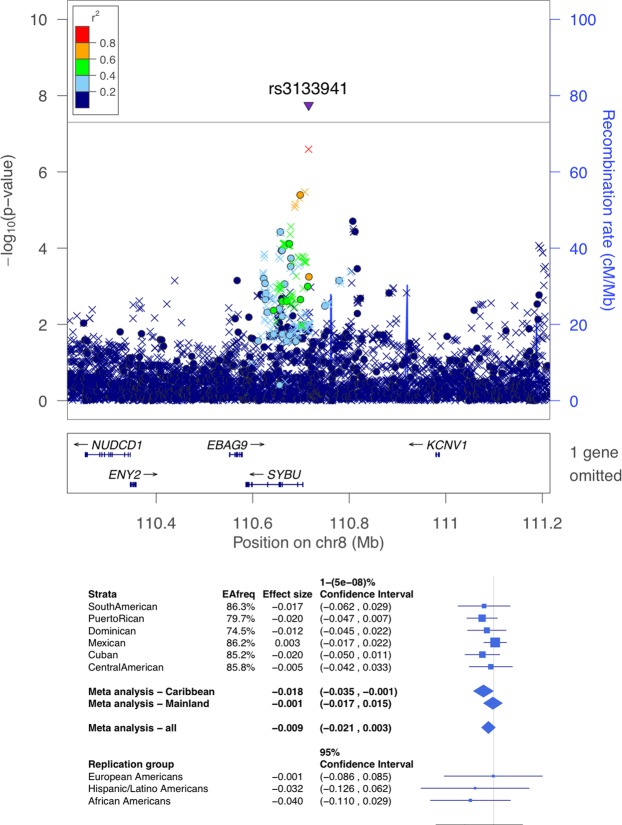
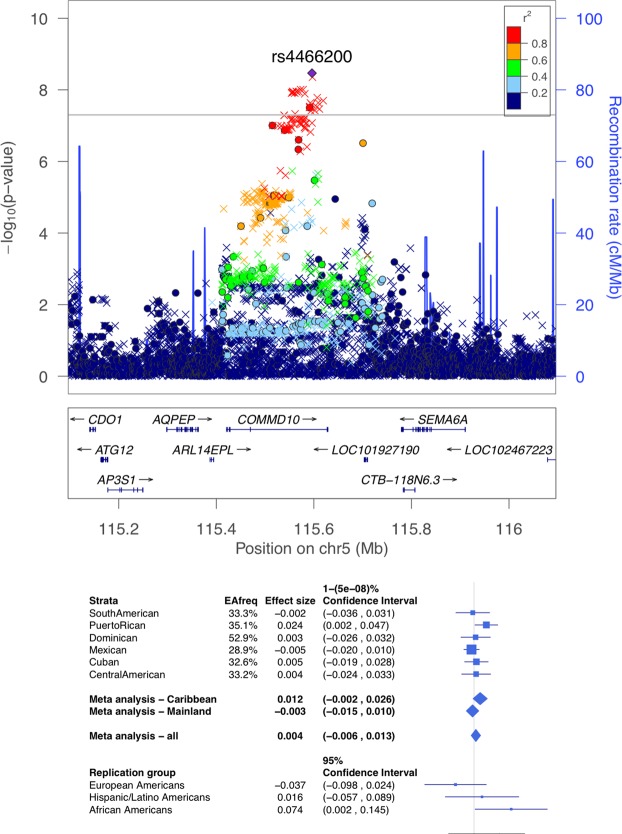
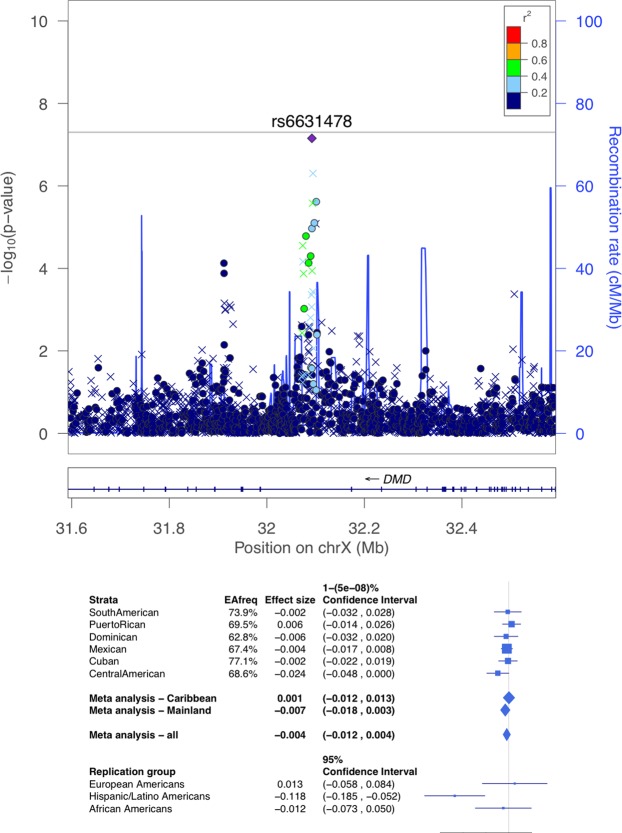
Lower extremity peripheral artery disease (PAD) burden differs by race/ethnicity. Although familial aggregation and heritability studies suggest a genetic basis, little is known about the genetic susceptibility to PAD, especially in non-European descent populations. Genome-wide association studies (GWAS) of the ankle brachial index (ABI) and PAD (defined as an ABI < 0.90) have not been conducted in Hispanics/Latinos. We performed a GWAS of PAD and the ABI in 7,589 participants aged >45 years from the Hispanic Community Health Study/Study of Latinos (HCHS/SOL). We also performed GWAS for ABI stratified by Hispanic/Latino ethnic subgroups: Central American, Mexican, and South American (Mainland group), and Cuban, Dominican, and Puerto Rican (Caribbean group). We detected two genome-wide significant associations for the ABI in COMMD10 in Puerto Ricans, and at SYBU in the Caribbean group. The lead SNP rs4466200 in the COMMD10 gene had a replication p = 0.02 for the ABI in Multi-Ethnic Study of Atherosclerosis (MESA) African Americans, but it did not replicate in African Americans from the Cardiovascular Health Study (CHS). In a regional look-up, a nearby SNP rs12520838 had Bonferroni adjusted p = 0.05 (unadjusted p = 7.5 × 10⁻⁵) for PAD in MESA Hispanics. Among three suggestive associations (p < 10-7) in subgroup-specific analyses, DMD on chromosome X, identified in Central Americans, replicated in MESA Hispanics (p = 2.2 × 10⁻⁴). None of the previously reported ABI and PAD associations in whites generalized to Hispanics/Latinos.
Conflict of interest statement
The authors declare no competing interests.
Figures
References
Publication types
MeSH terms
Substances
Grants and funding
- N01 HC095161/HL/NHLBI NIH HHS/United States
- R01 AG048642/AG/NIA NIH HHS/United States
- N01 HC065236/HL/NHLBI NIH HHS/United States
- N01 HC065235/HL/NHLBI NIH HHS/United States
- R56 DK104806/DK/NIDDK NIH HHS/United States
- N01 HC095167/HL/NHLBI NIH HHS/United States
- R35 HL135818/HL/NHLBI NIH HHS/United States
- UL1 TR001420/TR/NCATS NIH HHS/United States
- N01 HC095163/HL/NHLBI NIH HHS/United States
- HHSN268201500003I/HL/NHLBI NIH HHS/United States
- R21 HL123677/HL/NHLBI NIH HHS/United States
- N01 HC095166/HL/NHLBI NIH HHS/United States
- N01 HC095162/HL/NHLBI NIH HHS/United States
- N01 HC065237/HL/NHLBI NIH HHS/United States
- N01 HC095160/HL/NHLBI NIH HHS/United States
- HHSN268201300005C/HL/NHLBI NIH HHS/United States
- HHSN268201500003C/HL/NHLBI NIH HHS/United States
- N01 HC095168/HL/NHLBI NIH HHS/United States
- R01 HL120393/HL/NHLBI NIH HHS/United States
- UL1 TR001079/TR/NCATS NIH HHS/United States
- N02 HL064278/HL/NHLBI NIH HHS/United States
- N01 HC095169/HL/NHLBI NIH HHS/United States
- N01 HC065233/HL/NHLBI NIH HHS/United States
- RF1 AG054548/AG/NIA NIH HHS/United States
- N01 HC095159/HL/NHLBI NIH HHS/United States
- P30 DK063491/DK/NIDDK NIH HHS/United States
- R01 HL110955/HL/NHLBI NIH HHS/United States
- N01 HC065234/HL/NHLBI NIH HHS/United States
- R01 MD012765/MD/NIMHD NIH HHS/United States
- UL1 TR000040/TR/NCATS NIH HHS/United States
- UL1 TR001881/TR/NCATS NIH HHS/United States
- N01 HC095165/HL/NHLBI NIH HHS/United States
- N01 HC095164/HL/NHLBI NIH HHS/United States
