. 2019 Aug 6;9(1):11387.
doi: 10.1038/s41598-019-47621-7.

Convolutional Neural Networks for Spectroscopic Analysis in Retinal Oximetry

Affiliations

Convolutional Neural Networks for Spectroscopic Analysis in Retinal Oximetry

Damon T DePaoli et al. Sci Rep. .

Abstract

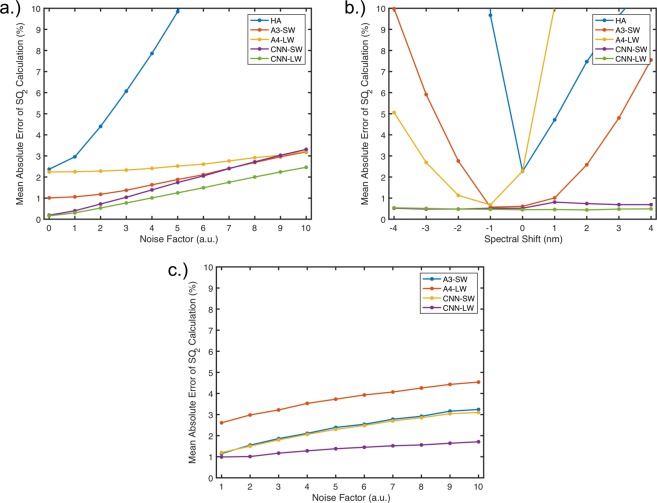
Retinal oximetry is a non-invasive technique to investigate the hemodynamics, vasculature and health of the eye. Current techniques for retinal oximetry have been plagued by quantitatively inconsistent measurements and this has greatly limited their adoption in clinical environments. To become clinically relevant oximetry measurements must become reliable and reproducible across studies and locations. To this end, we have developed a convolutional neural network algorithm for multi-wavelength oximetry, showing a greatly improved calculation performance in comparison to previously reported techniques. The algorithm is calibration free, performs sensing of the four main hemoglobin conformations with no prior knowledge of their characteristic absorption spectra and, due to the convolution-based calculation, is invariable to spectral shifting. We show, herein, the dramatic performance improvements in using this algorithm to deduce effective oxygenation (SO2), as well as the added functionality to accurately measure fractional oxygenation ([Formula: see text]). Furthermore, this report compares, for the first time, the relative performance of several previously reported multi-wavelength oximetry algorithms in the face of controlled spectral variations. The improved ability of the algorithm to accurately and independently measure hemoglobin concentrations offers a high potential tool for disease diagnosis and monitoring when applied to retinal spectroscopy.


Conflict of interest statement

Dominic Sauvageau is part owner of Zilia, Inc., which partially funded this research and supplied in vivo spectra for analysis. Damon DePaoli was a Mitacs research student at Zilia, Inc. during the beginning of this work. Mitacs Accelerate scholarships allow doctoral students to apply their thesis research to industry problems.

Figures

Figure 1
Figure 1
Data creation. (a) Example spectrum taken in vivo on a human optic nerve head with an SO2 of 68% (b) Randomly simulated spectrum with an SO2 of 68%. Components are plotted to scale of their randomly generated amplitudes for this specific spectra. (c) Normalized absorption coefficient spectra used in simulated spectra creation. (d) Randomly simulated spectra with an SO2fr of 68%, COHb present at a 6% fraction and a random combination of yellow protein contributions. Components are plotted to scale of their randomly generated amplitudes for the specific spectrum. Abbreviations: ONH = Optic nerve head; Ret. Mel. = Retinal Melanin; YP1 = Yellow protein 1; YP2 = Yellow protein 2.
Figure 2
Figure 2
Performance of SO2 calculations using various oximetry algorithms. (a) Test dataset spectra without COHb or MeHb. (b) Test dataset spectra include 1% COHb and MeHb contributions to the hemoglobin absorption component. (c) Test dataset spectra include 6% COHb and 1% MeHb contributions to the hemoglobin absorption component. (d) Test dataset spectra include a random contribution of each hemoglobin conformation. The printed numbers above each bar correspond to the mean absolute error value for the given algorithm.
Figure 3
Figure 3
Performance of SO2 calculations on datasets including contributions from yellow protein components, using various oximetry algorithms. In this scenario, the linear regression analyses do not include the yellow proteins component for solving and the CNN was not trained on data having yellow proteins contributions. (a) Test dataset spectra without COHb or MeHb contributions. (b) Test dataset spectra include 1% COHb and MeHb contributions to the hemoglobin absorption component. (c) Test dataset spectra include 6% COHb and 1% MeHb contributions to the hemoglobin absorption component. (d) Test dataset spectra include a random contribution of each hemoglobin conformation. The printed numbers above each bar correspond to the mean absolute error value for the given algorithm.
Figure 4
Figure 4
SO2fr calculation performance on test data-sets with and without dyshemoglobins and yellow proteins. (a) Test data-set spectra do not include COHb, MeHb or yellow proteins. (b) Test data-set spectra do not include COHb or MeHb but do include a variable amount of yellow protein contributions (c) Test data-set spectra include random amounts of all hemoglobin conformations but do not include yellow protein contributions. (d) Test data-set spectra include random amounts of all hemoglobin conformations and include yellow protein contributions.
Figure 5
Figure 5
Performance of SO2 calculations, measured using the mean absolute error statistic, on test datasets with varying stresses. (a) Test datasets were created with varying amounts of noise applied to the spectra. (b) Test datasets were created with varying amounts of spectral shifting from reference spectra. (c) Test datasets were created with decreasing spectral resolution.

References

    1. Tiedeman JS, Kirk SE, Srinivas S, Beach JM. Retinal oxygen consumption during hyperglycemia in patients with diabetes without retinopathy. Ophthalmology. 1998;105:31–36. doi: 10.1016/S0161-6420(98)71029-1. - DOI - PubMed
    1. Fondi K, et al. Retinal oxygen extraction in individuals with type 1 diabetes with no or mild diabetic retinopathy. Diabetologia. 2017;60:1534–1540. doi: 10.1007/s00125-017-4309-0. - DOI - PMC - PubMed
    1. Jorgensen CM, Hardarson SH, Bek T. The oxygen saturation in retinal vessels from diabetic patients depends on the severity and type of vision-threatening retinopathy. Acta Ophthalmol. 2014;92:34–39. doi: 10.1111/aos.12283. - DOI - PubMed
    1. Hammer M, et al. Diabetic patients with retinopathy show increased retinal venous oxygen saturation. Graefe’s Arch. for Clin. Exp. Ophthalmol. 2009;247:1025–1030. doi: 10.1007/s00417-009-1078-6. - DOI - PubMed
    1. Tayyari F, et al. Retinal Blood Flow and Retinal Blood Oxygen Saturation in Mild to Moderate Diabetic Retinopathy. Investig. Opthalmology & Vis. Sci. 2015;56:6796. doi: 10.1167/iovs.15-17481. - DOI - PubMed