. 2019 Aug 1;8(4):16.
doi: 10.1167/tvst.8.4.16. eCollection 2019 Jul.

Performance of a Defect-Mapping Microperimetry Approach for Characterizing Progressive Changes in Deep Scotomas

Affiliations

Performance of a Defect-Mapping Microperimetry Approach for Characterizing Progressive Changes in Deep Scotomas

Zhichao Wu et al. Transl Vis Sci Technol. .

Abstract

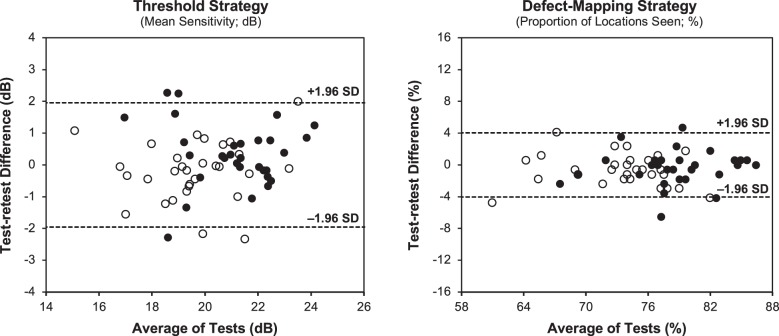
Purpose: To examine whether a microperimetry testing strategy based on quantifying the spatial extent of functional abnormalities (termed "defect-mapping" strategy) could improve the detection of progressive changes in deep scotomas compared to the conventional thresholding strategy.

Methods: A total of 30 healthy participants underwent two microperimetry examinations, each using the defect-mapping and thresholding strategies at the first visit to examine the test-retest variability of each method. Testing was performed using an isotropic stimulus pattern centered on the optic nerve head (ONH), which acted as a model of a deep scotoma. These tests were repeated at a second visit, except using a smaller stimulus pattern and thereby increasing the proportion of test locations falling within the ONH (to simulate the progressive enlargement of a deep scotoma). The extent of change detected between visits relative to measurement variability was compared between the two strategies.

Results: Relative to their effective dynamic ranges, the test-retest variability of the defect-mapping strategy (1.8%) was significantly lower compared to the thresholding strategy (3.3%; P < 0.001). The defect-mapping strategy also captured a significantly greater extent of change between visits relative to variability (-4.70 t-1) compared to the thresholding strategy (2.74 t-1; P < 0.001).

Conclusions: A defect-mapping microperimetry testing strategy shows promise for capturing the progressive enlargement of deep scotomas more effectively than the conventional thresholding strategy.

Translational relevance: Microperimetry testing with the defect-mapping strategy could provide a more accurate clinical trial outcome measure for capturing progressive changes in deep scotomas in eyes with atrophic retinal diseases, warranting further investigations.

Keywords: microperimetry; progression; scotoma; test–retest.


Figures

Figure 1
Figure 1
Stimulus patterns used for the microperimetry threshold and defect-mapping testing strategies on visits 1 and 2. Dashed box is shown to provide a reference to appreciate the difference in the size of the stimulus pattern between the two visits.
Figure 2
Figure 2
Bland-Altman plots of the test–retest difference of the threshold and defect-mapping microperimetry testing strategies plotted against the average value from the two tests shown for the first (filled circles) and second (unfilled circles) visits separately; horizontal dashed lines represent upper and lower 95% CIs (SD, standard deviation).
Figure 3
Figure 3
Examples of test–retest variability of the defect-mapping and threshold microperimetry testing strategies in this study from three different representative participants, with the outcome measures being the proportion of locations seen and mean sensitivity, respectively. Note that the additional test location that is not consistent with the isotropic stimulus pattern represents the location where the false-positive catch trials were presented.
Figure 4
Figure 4
Normalized values of change over the two visits using the threshold and defect-mapping strategy on microperimetry, illustrating how the latter detected a greater degree of change relative to variability over the two visits.
Figure 5
Figure 5
Examples of change over time simulated by decreasing the size of the stimulus pattern from the second compared to the first visit for the defect-mapping (top in each example) and threshold (bottom in each example) microperimetry testing strategies in this study from two different representative participants, with the outcome measures being the proportion of locations seen and mean sensitivity respectively. Note that the additional test location that is not consistent with the isotropic stimulus pattern represents the location where the false-positive catch trials were presented.

References

    1. Csaky K, Ferris F, Chew EY, et al. Report From the NEI/FDA Endpoints Workshop on age-related macular degeneration and inherited retinal diseases. Invest Ophthalmol Vis Sci. 2017;58:3456–3463. - PMC - PubMed
    1. Wong WT, Kam W, Cunningham D, et al. Treatment of geographic atrophy by the topical administration of OT-551: results of a phase II clinical trial. Invest Ophthalmol Vis Sci. 2010;51:6131–6139. - PMC - PubMed
    1. Wong WT, Dresner S, Forooghian F, et al. Treatment of geographic atrophy with subconjunctival sirolimus: results of a phase I/II clinical trial. Invest Ophthalmol Vis Sci. 2013;54:2941–2950. - PMC - PubMed
    1. MacLaren RE, Groppe M, Barnard AR, et al. Retinal gene therapy in patients with choroideremia: initial findings from a phase 1/2 clinical trial. The Lancet. 2014;383:1129–1137. - PMC - PubMed
    1. Bainbridge JW, Mehat MS, Sundaram V, et al. Long-term effect of gene therapy on Leber's congenital amaurosis. N Engl J Med. 2015;372:1887–1897. - PMC - PubMed