. 2019 Oct 1;317(4):L498-L509.
doi: 10.1152/ajplung.00238.2019. Epub 2019 Aug 7.

Endotracheal tube mucus as a source of airway mucus for rheological study

Affiliations

Endotracheal tube mucus as a source of airway mucus for rheological study

Matthew R Markovetz et al. Am J Physiol Lung Cell Mol Physiol. .

Abstract

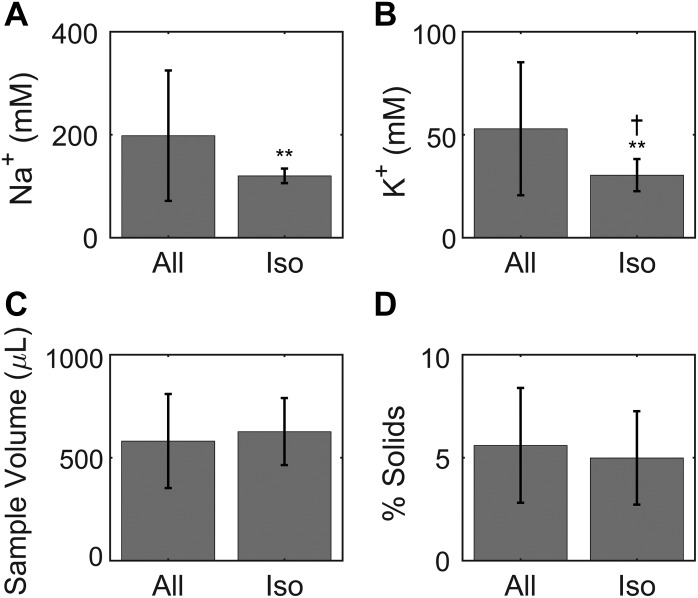
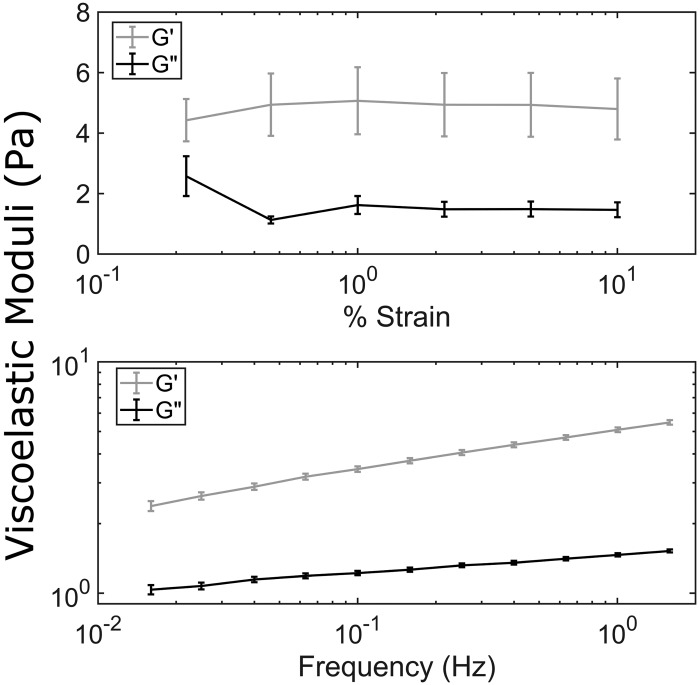
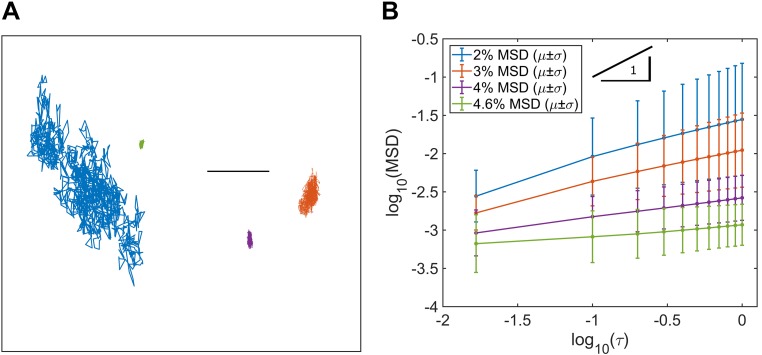
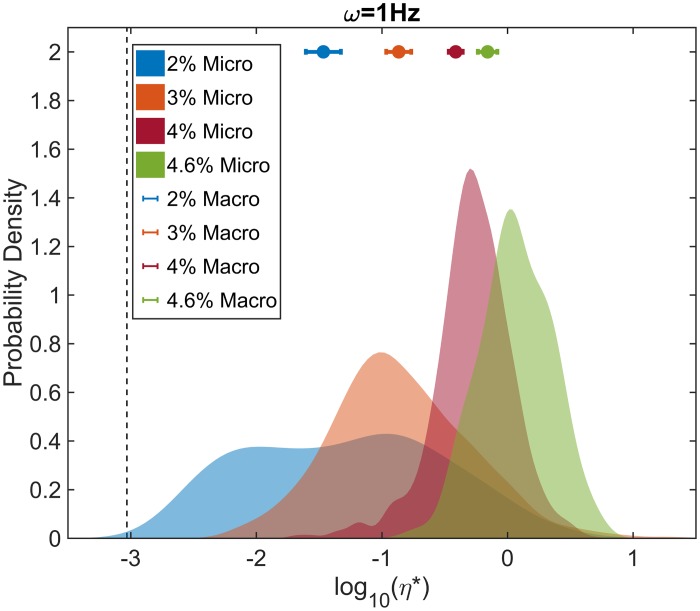
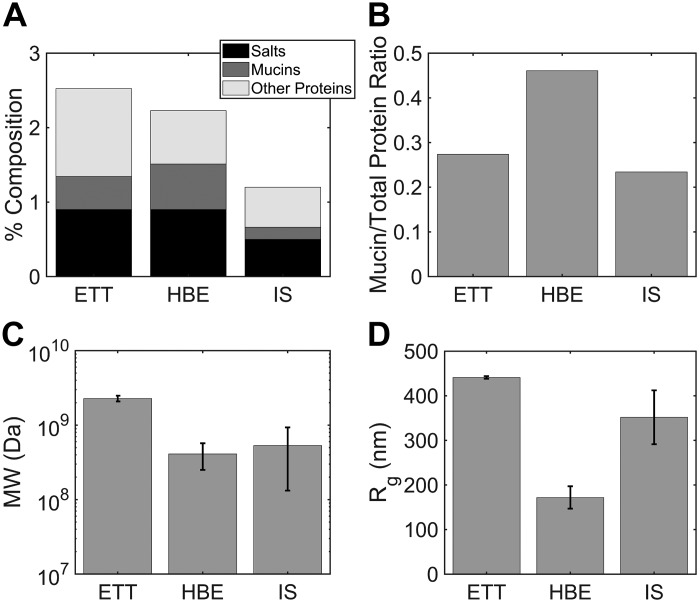
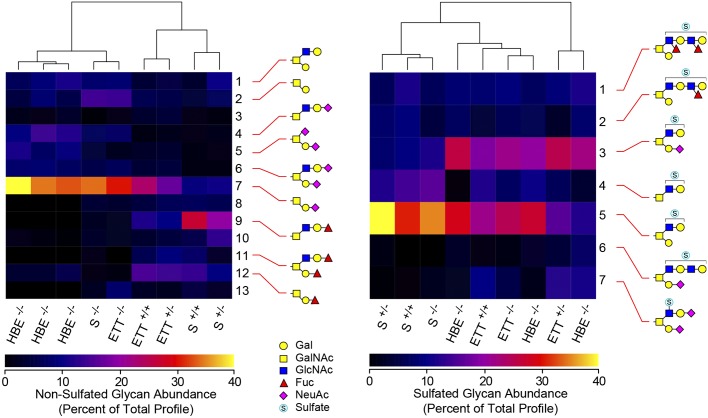
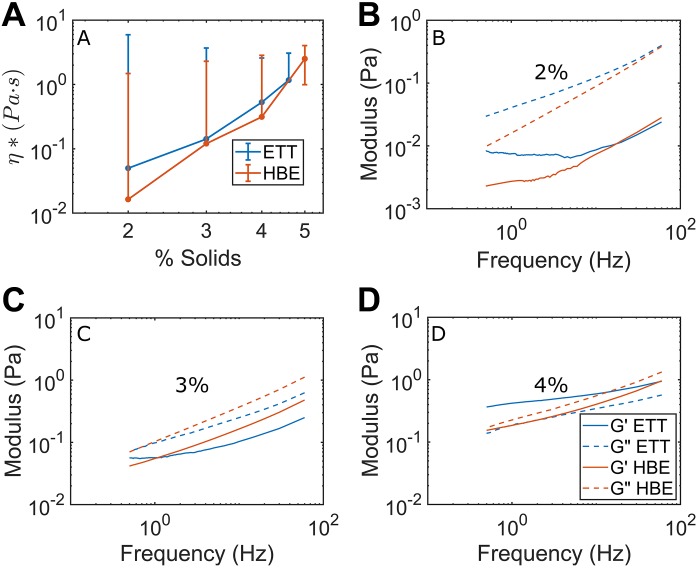
Muco-obstructive lung diseases (MOLDs), like cystic fibrosis and chronic obstructive pulmonary disease, affect a spectrum of subjects globally. In MOLDs, the airway mucus becomes hyperconcentrated, increasing osmotic and viscoelastic moduli and impairing mucus clearance. MOLD research requires relevant sources of healthy airway mucus for experimental manipulation and analysis. Mucus collected from endotracheal tubes (ETT) may represent such a source with benefits, e.g., in vivo production, over canonical sample types such as sputum or human bronchial epithelial (HBE) mucus. Ionic and biochemical compositions of ETT mucus from healthy human subjects were characterized and a stock of pooled ETT samples generated. Pooled ETT mucus exhibited concentration-dependent rheologic properties that agreed across spatial scales with reported individual ETT samples and HBE mucus. We suggest that the practical benefits compared with other sample types make ETT mucus potentially useful for MOLD research.

Keywords: cystic fibrosis; muco-obstructive lung disease; mucus; mucus biochemistry; mucus biophysics.


Conflict of interest statement

No conflicts of interest, financial or otherwise, are declared by the authors.

Figures

Fig. 1.
Fig. 1.
Characteristics of all prospective endotracheal tube (ETT) mucus samples (All) and of those selected for being nearly isotonic (Iso). A and B: there were significantly lower (**P < 0.001) Na+ (A) and K+ (B) concentrations in the isotonic subset (Na+: 120.0 mM, K+: 30.3 mM) relative to the average of all samples (Na+: 197.9 mM, K+: 52.9 mM), indicating that some dehydration usually occurs during intubation. We also note that K+ concentration in the isotonic samples was slightly increased above the 25 mM physiological value (†P < 0.05). C: there was no discernable difference in sample volume between the whole set of samples (581 µL) and the isotonic subset (627 µL). D: there was also no difference in % solids between the whole set and isotonic subset.
Fig. 2.
Fig. 2.
Viscoelastic moduli of pooled 4.6% endotracheal tube (ETT) mucus. Top: strain-dependent viscoelastic moduli at 1 radian/s over a range of 0.22–10.0% strain, which was determined to be the linear viscoelastic region. Bottom: frequency-dependent viscoelastic moduli at 1% strain over a range of 0.016–1.6 Hz (0.1–10 radians). G′ is in excess of G″ over all frequencies, characteristic of a cross-linked gel.
Fig. 3.
Fig. 3.
Measurement of particle motion over time for particle-tracking microrheology in endotracheal tube (ETT) mucus. A: particle motion was progressively hindered as mucus concentration increased; only in 2% mucus were particles able to probe regions beyond their diameter (scale bar, 1 μm). B: ensemble means of particle motion represented as mean squared displacement (MSD) vs. lag time (τ). In log-log space, MSD curves are linear, and slopes for each mucus concentration were less than 1 and decreased with concentration, indicating subdiffusive motion and increasingly hindered motion from interactions with the polymer mesh, respectively. Numbers of beads tracked per concentration were 650, 474, 1,097, and 189 for 2%, 3%, 4%, and 4.6%, respectively.
Fig. 4.
Fig. 4.
Comparison of endotracheal tube (ETT) mucus bulk (macro) rheology to particle-tracking microrheology (PTMR). Bulk rheological measurements (dots, means ± SE) of complex viscosity (η*) agree well with the central tendencies of the PTMR ensemble distributions (filled regions) of η* in all mucus concentrations. PTMR η* distributions are represented as kernel-smoothed estimates of the probability density. The ordinate value chosen for bulk measurements was arbitrary.
Fig. 5.
Fig. 5.
Mucin and protein composition in endotracheal tube (ETT), induced sputum (IS), and human bronchial endothelial (HBE) mucus via multiangle laser light scattering (MALLS). A: total solids composition of ETT, IS, and HBE mucus as % salts (0.9% ETT vs. 0.9% HBE vs. 0.5% IS), mucins (0.44% ETT vs. 0.61% HBE vs. 0.164% IS), and other proteins (1.18% ETT vs. 0.72% HBE vs. 0.53% IS). B: mucin-to-other protein ratio in ETT (0.27), IS (0.23), and HBE (0.46). C: molecular mass of mucins in ETT (2.28 × 10⁹ Da), IS (5.31 × 10⁸ Da), and HBE (4.10 × 10⁸ Da). D: radius of gyration (Rg) of mucins in ETT (440.9 nm), IS (351.7 nm), and HBE (171.9 nm) mucus. Error bars show means ± SD.
Fig. 6.
Fig. 6.
Hierarchical clustering of O-linked glycan profiles of endotracheal tube (ETT) mucin, sputum (S), and human bronchial epithelial (HBE) cells. Left: nonsulfated O-linked glycans were harvested and analyzed by nanospray ionization multidimensional mass spectrometry (NSI-MSn) in positive-ion mode. The 13 highest-abundance O-linked glycans detected in ETT mucus (ETT), sputum (S) from healthy subjects, and human bronchial epithelial cells cultured at an air-liquid interface (HBE) were quantified as the percentage of the signal intensity that each individual glycan contributed to the total signal intensity for all 13 glycans (percentage of total profile). Based on the total glycan profile, donors of the indicated samples were characterized as sec+/+, sec+/−, or sec−/− for the fucosyltransferase activity encoded at the human secretor (sec) locus. Hierarchical clustering was performed to assess the closest similarities across the samples. Sec−/− samples segregated together, regardless of their source (ETT, S, or HBE), indicating that secretor status outweighs sample source as a determinant of nonsulfated glycosylation. Right: sulfated O-linked glycans were harvested and analyzed by NSI-MSn in negative-ion mode. The relative abundance of the 7 most abundant sulfated O-linked glycans detected in all three sample types were quantified and compared with each other as percentage of total profile. Hierarchical clustering of sulfated glycan abundance demonstrates greater similarity between ETT mucus and HBE cells than between ETT mucus and sputum. The similarities in sulfated glycan profiles are independent of secretor status. Graphical representations of monosaccharide residues are in accordance with the broadly adopted Symbolic Nomenclature for Glycans guidelines (SNFG).
Fig. 7.
Fig. 7.
Comparison of particle-tracking microrheology measurements of viscoelasticity in endotracheal tube (ETT, blue) and human bronchial endothelial (HBE, orange) mucus. A: complex viscosity (η*) in ETT and HBE mucus. Slopes of lines of best fit for HBE and ETT excluding 2% were m = 5.2 and m = 4.9, respectively, similar to values reported by Georgiades and colleagues (12) for porcine duodenal mucus. Best-fit slope for all ETT concentrations was 3.7, similar to Georgiades et al. report of 3.9 in porcine gastric mucus. B: viscous modulus (G″) exceeded the loss modulus (G′) for both 2% HBE and ETT mucus, characteristic of a sol. Both measures agreed well between sample types. C: general agreement was also observed for G′ and G″ between sample types at 3% solids with G″ again exceeding G′ in ETT and HBE samples. D: values G′ and G″ were near to each other in both 4% solids ETT and HBE mucus, indicating proximity to the sol-gel transition point, with similarities between sample types as well. However, G′ exceeded G″ in ETT indicating that ETT mucus had undergone transition to a gel, whereas Hill et al. (19) previously reported that HBE mucus does not undergo this transition until % solids is just above 4%. [All HBE data reproduced from Hill et al. (19), with permission under the Creative Commons Attribution 4.0 Unported License.]

Comment in

  • Reliably sourced airway mucus.
    Joyner K, Duncan GA. Joyner K, et al. Am J Physiol Lung Cell Mol Physiol. 2019 Oct 1;317(4):L496-L497. doi: 10.1152/ajplung.00362.2019. Epub 2019 Sep 11. Am J Physiol Lung Cell Mol Physiol. 2019. PMID: 31508979 Free PMC article. No abstract available.

Similar articles

Cited by

References

    1. Alexis NE, Wells H, Siperly E, Goldstein B, Henderson AG, Peden DB. Baseline sputum parameters in normals, asthmatics, COPD, atopics, smokers and ex-smokers (Abstract) J Allergy Clin Immunol 137: AB208, 2016. doi:10.1016/j.jaci.2015.12.1121. - DOI
    1. Anderson WH, Coakley RD, Button B, Henderson AG, Zeman KL, Alexis NE, Peden DB, Lazarowski ER, Davis CW, Bailey S, Fuller F, Almond M, Qaqish B, Bordonali E, Rubinstein M, Bennett WD, Kesimer M, Boucher RC. The relationship of mucus concentration (hydration) to mucus osmotic pressure and transport in chronic bronchitis. Am J Respir Crit Care Med 192: 182–190, 2015. doi:10.1164/rccm.201412-2230OC. - DOI - PMC - PubMed
    1. Aoki K, Perlman M, Lim JM, Cantu R, Wells L, Tiemeyer M. Dynamic developmental elaboration of N-linked glycan complexity in the Drosophila melanogaster embryo. J Biol Chem 282: 9127–9142, 2007. doi:10.1074/jbc.M606711200. - DOI - PubMed
    1. Aoki K, Porterfield M, Lee SS, Dong B, Nguyen K, McGlamry KH, Tiemeyer M. The diversity of O-linked glycans expressed during Drosophila melanogaster development reflects stage- and tissue-specific requirements for cell signaling. J Biol Chem 283: 30385–30400, 2008. doi:10.1074/jbc.M804925200. - DOI - PMC - PubMed
    1. Bhowmik A, Seemungal TA, Sapsford RJ, Devalia JL, Wedzicha JA. Comparison of spontaneous and induced sputum for investigation of airway inflammation in chronic obstructive pulmonary disease. Thorax 53: 953–956, 1998. doi:10.1136/thx.53.11.953. - DOI - PMC - PubMed

Publication types

MeSH terms