. 2019 Oct 1;122(4):1518-1529.
doi: 10.1152/jn.00430.2019. Epub 2019 Aug 7.

Glutamatergic input varies with phrenic motor neuron size

Affiliations

Glutamatergic input varies with phrenic motor neuron size

Sabhya Rana et al. J Neurophysiol. .

Abstract

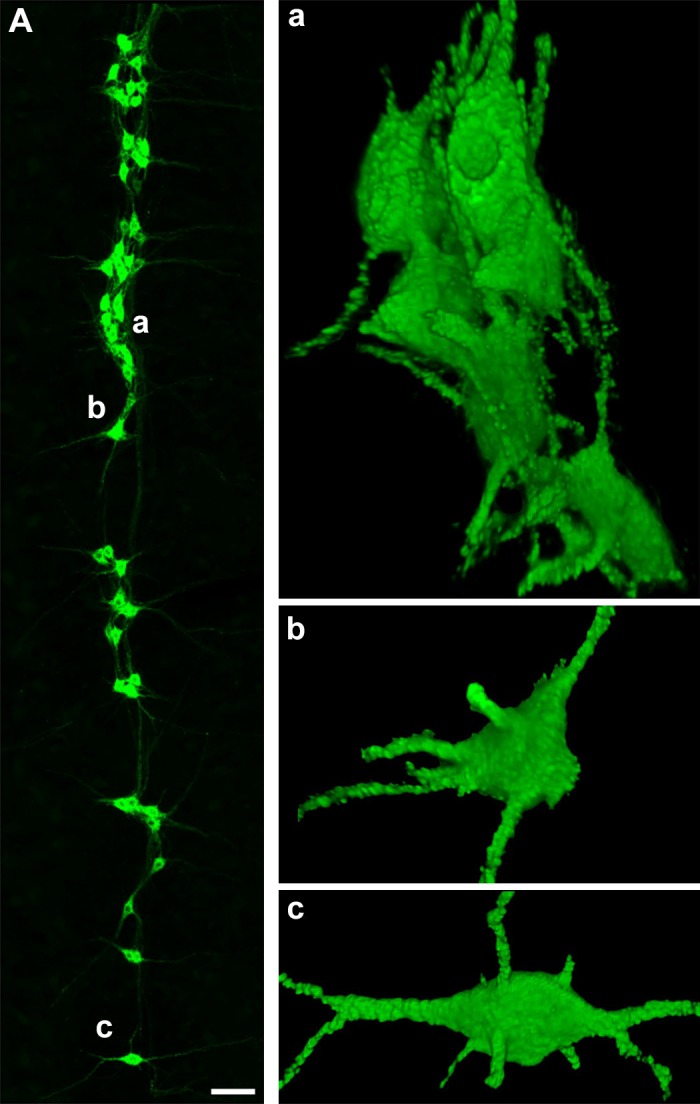
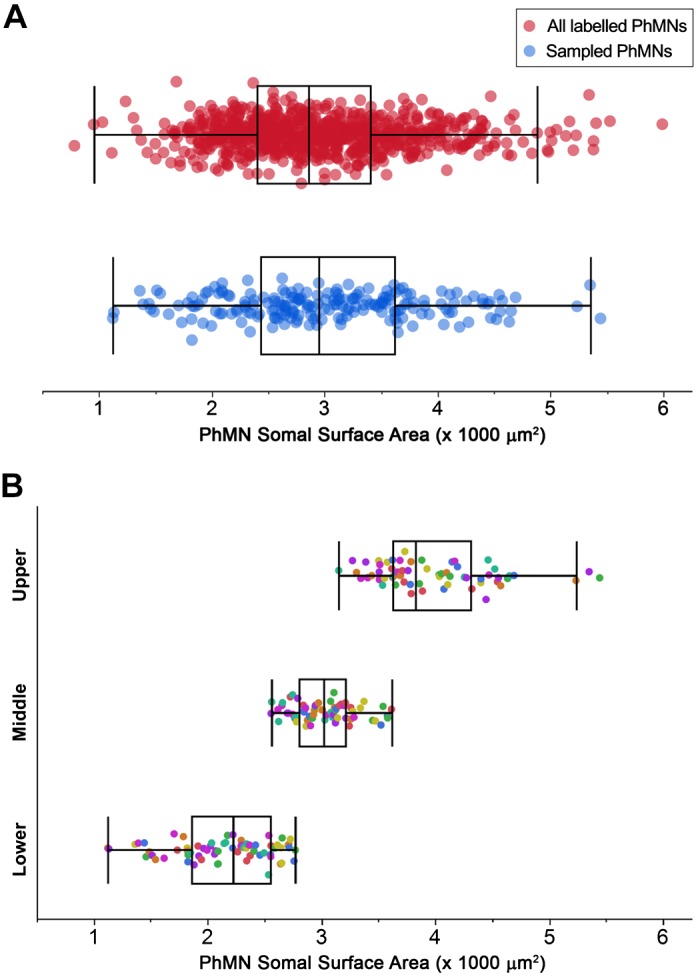
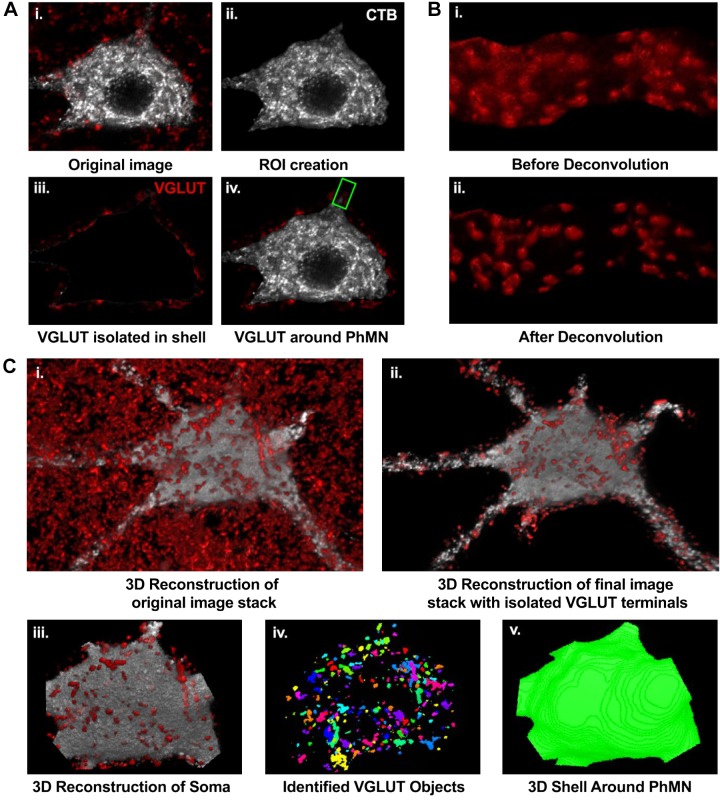
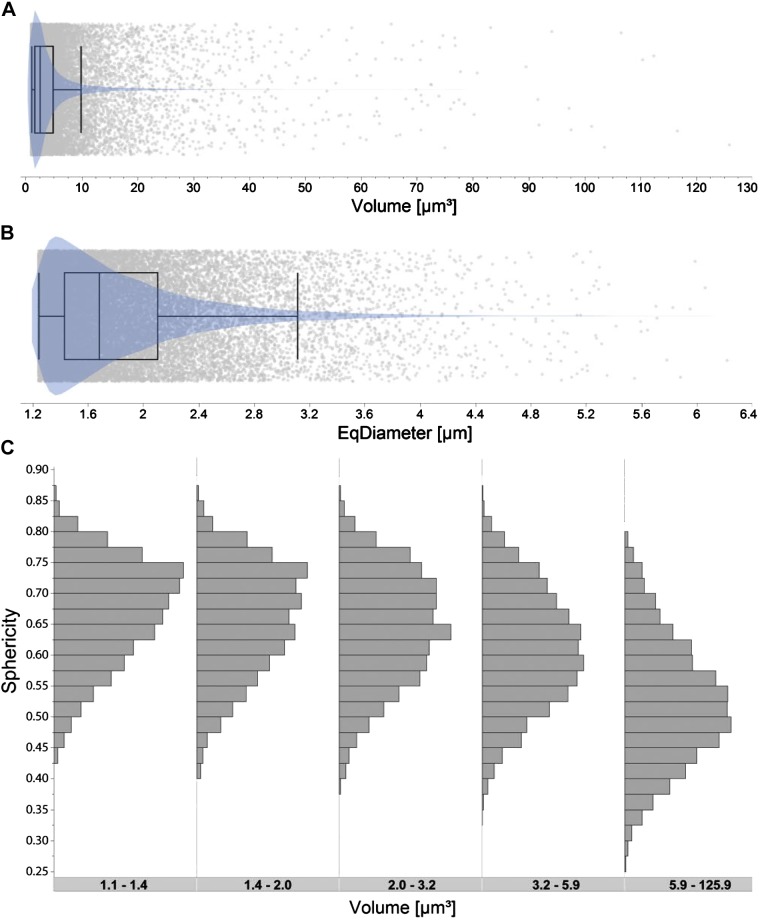
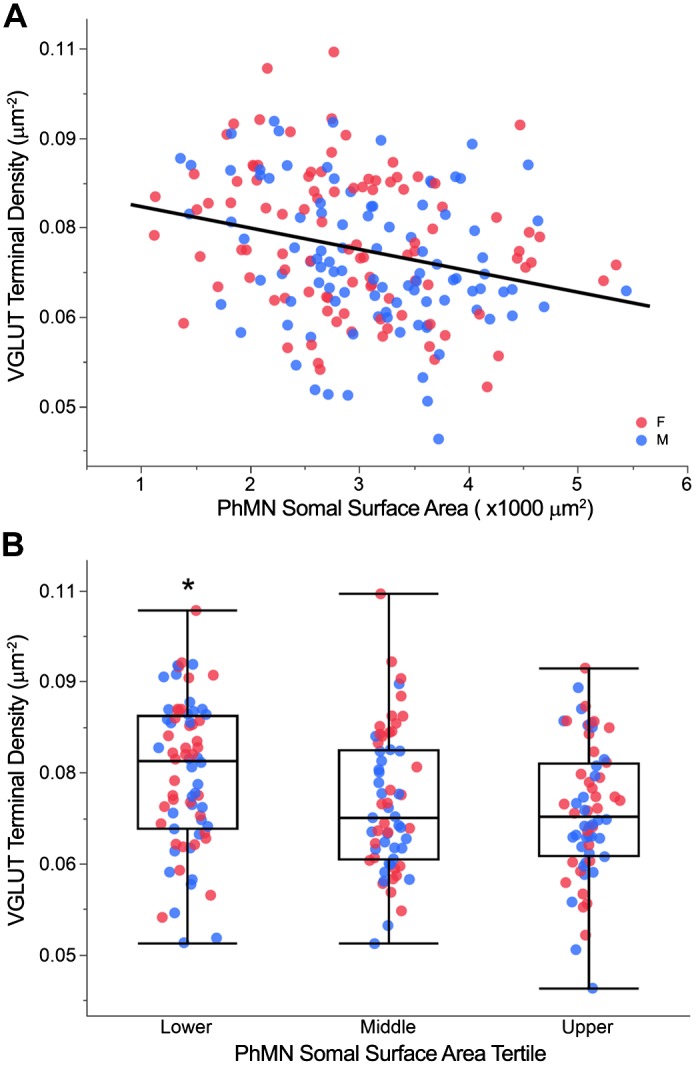
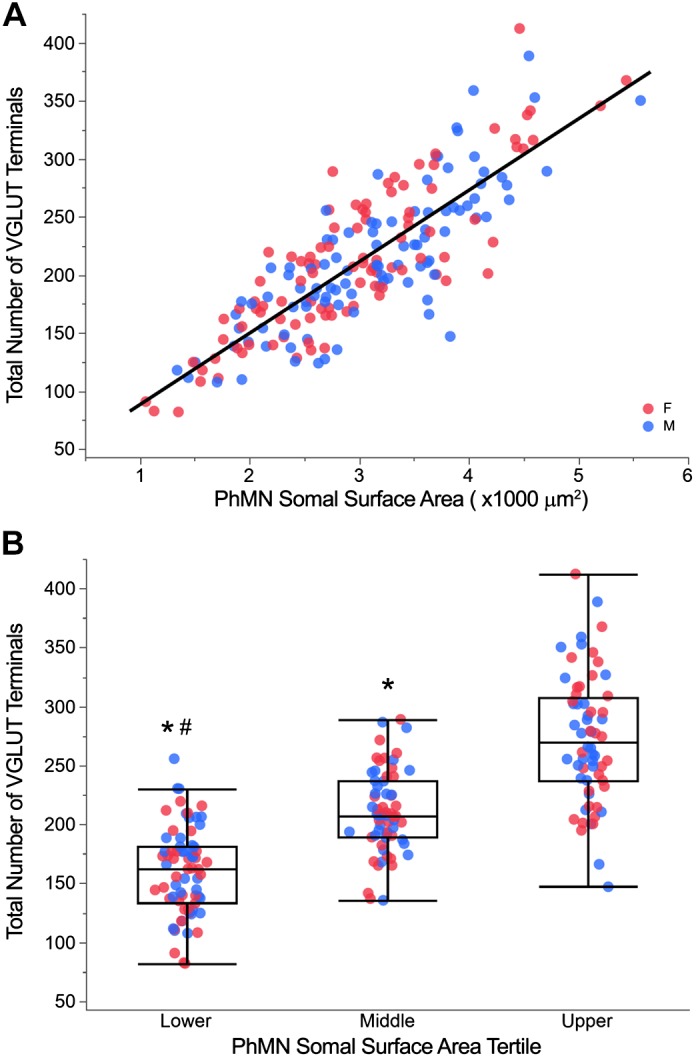
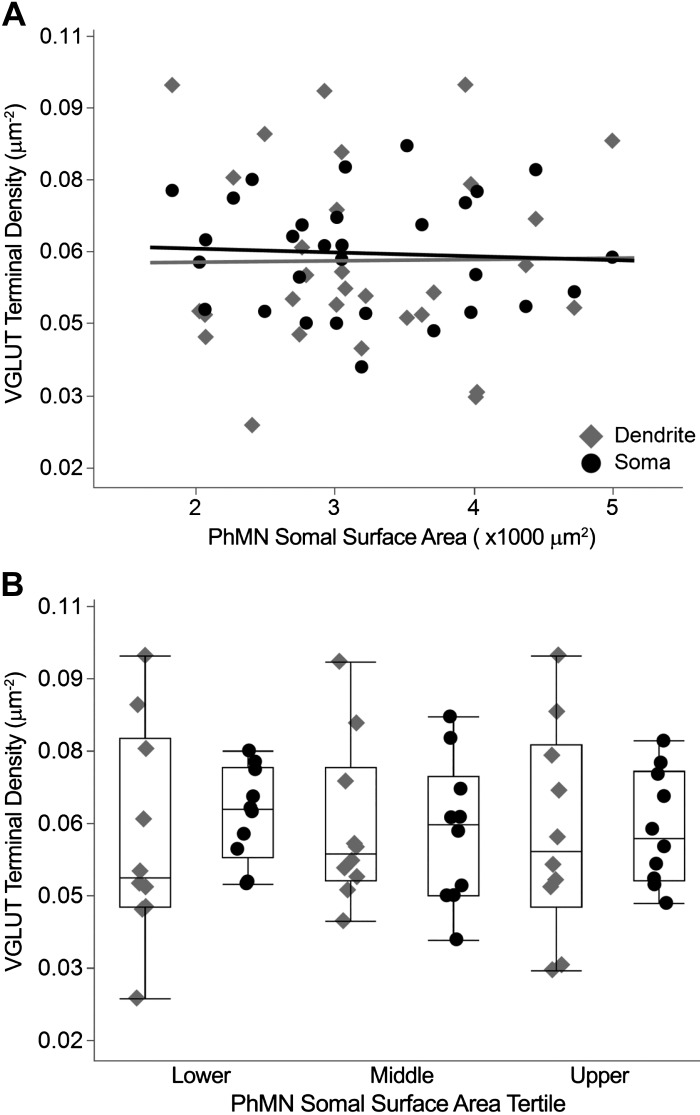
Like all skeletal muscles, the diaphragm muscle accomplishes a range of motor behaviors by recruiting different motor unit types in an orderly fashion. Recruitment of phrenic motor neurons (PhMNs) is generally assumed to be based primarily on the intrinsic properties of PhMNs with an equal distribution of descending excitatory inputs to all PhMNs. However, differences in presynaptic excitatory input across PhMNs of varying sizes could also contribute to the orderly recruitment pattern. In the spinal cord of Sprague-Dawley rats, we retrogradely labeled PhMNs using cholera toxin B (CTB) and validated a robust confocal imaging-based technique that utilizes semiautomated processing to identify presynaptic glutamatergic (Glu) terminals within a defined distance around the somal membrane of PhMNs of varying size. Our results revealed an ~10% higher density of Glu terminals at PhMNs in the lower tertile of somal surface area. These smaller PhMNs are likely recruited first to accomplish lower force ventilatory behaviors of the diaphragm as compared with larger PhMNs in the upper tertile that are recruited to accomplish higher force expulsive behaviors. These results suggest that differences in excitatory synaptic input to PhMNs may also contribute to the orderly recruitment of diaphragm motor units.NEW & NOTEWORTHY The distribution of excitatory glutamatergic synaptic input to phrenic motor neurons differs across motor neurons of varying size. These findings support the size principle of motor unit recruitment that underlies graded force generation in a muscle, which is based on intrinsic electrophysiological properties of motor neurons resulting from differences in somal surface area. A higher density of glutamatergic inputs at smaller, more excitable motor neurons substantiates the earlier and more frequent recruitment of these units.

Keywords: 3D-reconstruction; glutamate; neuromotor control; phrenic motor neurons; presynaptic inputs; spinal cord.


Conflict of interest statement

No conflicts of interest, financial or otherwise, are declared by the authors.

Figures

Fig. 1.
Fig. 1.
Retrogradely labeled phrenic motor neuron (PhMN) pool. A, left: representative maximum projection image of a 70-µm-thick section of the right cervical (C3–C4) spinal cord showing retrogradely labeled PhMNs in green. Three-dimensional reconstructions of PhMNs marked as a, b, and c are shown at right. Note that the clustering of PhMNs (a) makes it difficult to isolate individual PhMNs for vesicular glutamate transporter analysis compared with the isolated PhMNs selected for analyses (b and c). Scale bar, 100 μm.
Fig. 2.
Fig. 2.
Phrenic motor neuron (PhMN) somal surface area. A: distribution of somal surface areas for all cholera toxin B-labeled PhMNs measured on one side of the spinal cord in a subset of 4 animals (n = 804 PhMNs; red) compared with that of all PhMNs sampled for analysis of (vesicular glutamate transporter VGLUT) density (n = 200 PhMNs from 8 rats; blue). There were no differences in PhMN somal surface area introduced by the sampling for VGLUT analyses (P = 0.36). B: distribution of somal surface areas for the 200 PhMNs used for VGLUT analysis. Presynaptic VGLUT terminals were quantified at individual PhMNs, grouped into lower tertile (n = 72), middle tertile (n = 64), and upper tertile (n = 64) for each animal (indicated by different colors). Boxplots in A and B represent outlier whisker plots of data set in which boundaries are set at the 25th and 75th quartiles, and the median is represented as a line. Note differences across animals in PhMN somal surface area.
Fig. 3.
Fig. 3.
Method for 3-dimensional (3D) analyses of vesicular glutamate transporter (VGLUT) terminals at a single phrenic motor neuron (PhMN). A: representative image of single optical slice (i) with visible VGLUT terminals (red) surrounding a single cholera toxin B (CTB)-labeled PhMN (grayscale). Semiautomated processing for VGLUT terminal isolation included thresholding and creation of a region of interest (ROI) encompassing the CTB-labeled PhMN soma (ii), application of a mask to segregate VGLUT-immunoreactive terminals in the PhMN ROI dilated by 2.5 µm (iii), and single-slice image with isolated VGLUT terminals for a selected PhMN (iv). The green ROI represents the selected dendrite for additional steps exemplified in B. Note the first 2 steps were repeated for each optical slice in the image stack for each sampled PhMN. B: all image stacks containing VGLUT terminals segregated at PhMN soma and selected primary dendrites (see materials and methods for details) were subjected to deconvolution (i) in 3D (blind deconvolution using Point Scan Confocal, 3 iterations). Representative image (ii) shows the improved resolution of VGLUT terminals after deconvolution. C: representative 3D reconstruction for the entire PhMN and surrounding VGLUT terminals (i), with segregated terminals to the surrounding shell (ii). With use of the 3D volume measurement plug-in in NIS elements software, the PhMN soma was selected (iii), individual VGLUT terminals were identified (iv), allowing their dimensions to be quantified, and the volume of the shell surrounding the PhMN was obtained in 3D (v).
Fig. 4.
Fig. 4.
Vesicular glutamate transporter (VGLUT) terminal morphology. A: outlier whisker and violin plots (probability density) of the volume of identified VGLUT terminals (n = 22,905) for all sampled phrenic motor neurons (PhMNs; n = 200 from 8 animals). B: outlier whisker and violin plots of measured equivalent diameter (EqDiameter; diameter of a sphere with the same volume) for each identified VGLUT terminal. Boundaries of outlier whisker plots are set at the 25th and 75th quartiles, and the median is represented as a line. Note highly skewed distribution of VGLUT terminal volume and EqDiameter (A and B). C: distribution of sphericity (ratio of surface area of VGLUT terminal and surface area of a sphere with the same volume) values for identified VGLUT terminals at PhMNs for each quintile of VGLUT object volume (µm3). Note reduced sphericity with increasing VGLUT terminal volume (P < 0.001 for all pairwise comparisons), with the largest reduction in sphericity for the upper quintile indicative of aggregated VGLUT terminals.
Fig. 5.
Fig. 5.
Vesicular glutamate transporter (VGLUT) terminal density across phrenic motor neurons (PhMNs). A: scatterplot of VGLUT terminal density vs. PhMN somal surface area (n = 200 PhMNs from 8 animals). VGLUT terminal density is negatively correlated with PhMN somal surface area (P < 0.001; r2 = 0.12), with no difference between female (red) and male (blue) rats. B: outlier whisker box plot of VGLUT terminal density across individual PhMNs grouped by tertile of somal surface area for each animal. Boundaries of outlier whisker plots are set at the 25th and 75th quartiles, and the median is represented as a line. *P < 0.05, significantly different compared with upper tertile.
Fig. 6.
Fig. 6.
Total number of vesicular glutamate transporter (VGLUT) terminals across phrenic motor neurons (PhMNs). A: scatterplot of total number of VGLUT terminals vs. PhMN somal surface area (n = 200 PhMNs from 8 animals). The total number of VGLUT terminals is positively correlated with PhMN somal surface area (P < 0.001; r2 = 0.69), with no difference between female (red) and male (blue) rats. B: outlier whisker box plot of total number of VGLUT terminals across individual PhMNs grouped by tertile of somal surface area for each animal. Boundaries of outlier whisker plots are set at the 25th and 75th quartiles, and the median is represented as a line. *P < 0.05, significantly different compared with upper tertile (Tukey HSD). #P < 0.05, significantly different compared with middle tertile (Tukey HSD).
Fig. 7.
Fig. 7.
Vesicular glutamate transporter (VGLUT) terminal density in dendritic vs. somal compartments of phrenic motor neurons (PhMNs). A: scatterplots of VGLUT terminal density at PhMNs in dendritic (diamonds) and somal (circles) compartments vs. PhMN somal surface area (n = 30 PhMNs from 8 rats). There was no difference in VGLUT terminal density across compartments. B: outlier whisker box plots of VGLUT terminal density across compartments for PhMNs grouped by tertile of somal surface area per animal, with no differences observed. Boundaries of outlier whisker plots are set at the 25th and 75th quartiles, and the median is represented as a line.

Similar articles

Cited by

References

    1. Alvarez FJ, Villalba RM, Zerda R, Schneider SP. Vesicular glutamate transporters in the spinal cord, with special reference to sensory primary afferent synapses. J Comp Neurol 472: 257–280, 2004. doi:10.1002/cne.20012. - DOI - PubMed
    1. Alvarez-Argote S, Gransee HM, Mora JC, Stowe JM, Jorgenson AJ, Sieck GC, Mantilla CB. The impact of midcervical contusion injury on diaphragm muscle function. J Neurotrauma 33: 500–509, 2016. doi:10.1089/neu.2015.4054. - DOI - PMC - PubMed
    1. Bae YC, Nakamura T, Ihn HJ, Choi MH, Yoshida A, Moritani M, Honma S, Shigenaga Y. Distribution pattern of inhibitory and excitatory synapses in the dendritic tree of single masseter α-motoneurons in the cat. J Comp Neurol 414: 454–468, 1999. doi:10.1002/(SICI)1096-9861(19991129)414:4<454:AID-CNE3>3.0.CO;2-7. - DOI - PubMed
    1. Binder MD, Heckman CJ, Powers RK. How different afferent inputs control motoneuron discharge and the output of the motoneuron pool. Curr Opin Neurobiol 3: 1028–1034, 1993. doi:10.1016/0959-4388(93)90177-Z. - DOI - PubMed
    1. Binder MD, Robinson FR, Powers RK. Distribution of effective synaptic currents in cat triceps surae motoneurons. VI. Contralateral pyramidal tract. J Neurophysiol 80: 241–248, 1998. doi:10.1152/jn.1998.80.1.241. - DOI - PubMed

Publication types

LinkOut - more resources