Cancer statistics for adults aged 85 years and older, 2019
- PMID: 31390062
- PMCID: PMC12103238
- DOI: 10.3322/caac.21577
Cancer statistics for adults aged 85 years and older, 2019
Abstract
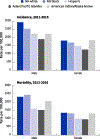
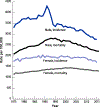
Adults aged 85 years and older, the "oldest old," are the fastest-growing age group in the United States, yet relatively little is known about their cancer burden. Combining data from the National Cancer Institute, the North American Association of Central Cancer Registries, and the National Center for Health Statistics, the authors provide comprehensive information on cancer occurrence in adults aged 85 years and older. In 2019, there will be approximately 140,690 cancer cases diagnosed and 103,250 cancer deaths among the oldest old in the United States. The most common cancers in these individuals (lung, breast, prostate, and colorectum) are the same as those in the general population. Overall cancer incidence rates peaked in the oldest men and women around 1990 and have subsequently declined, with the pace accelerating during the past decade. These trends largely reflect declines in cancers of the prostate and colorectum and, more recently, cancers of the lung among men and the breast among women. We note differences in trends for some cancers in the oldest age group (eg, lung cancer and melanoma) compared with adults aged 65 to 84 years, which reflect elevated risks in the oldest generations. In addition, cancers in the oldest old are often more advanced at diagnosis. For example, breast and colorectal cancers diagnosed in patients aged 85 years and older are about 10% less likely to be diagnosed at a local stage compared with those diagnosed in patients aged 65 to 84 years. Patients with cancer who are aged 85 years and older have the lowest relative survival of any age group, with the largest disparities noted when cancer is diagnosed at advanced stages. They are also less likely to receive surgical treatment for their cancers; only 65% of breast cancer patients aged 85 years and older received surgery compared with 89% of those aged 65 to 84 years. This difference may reflect the complexities of treating older patients, including the presence of multiple comorbidities, functional declines, and cognitive impairment, as well as competing mortality risks and undertreatment. More research on cancer in the oldest Americans is needed to improve outcomes and anticipate the complex health care needs of this rapidly growing population.
Keywords: cancer statistics; geriatrics; incidence; mortality; screening.
© 2019 American Cancer Society.
Figures


References
-
- US Census Bureau. 2017 National Population Projections Tables. Main Series. Table 2: Projected age and sex composition of the population: 2017–2060. Washington, DC: US Census Bureau, Population Division; 2018.
-
- Crimmins EM, Preston SH, Cohen B, eds. Explaining Divergent Levels of Longevity in High-Income Countries. National Research Council Panel on Understanding Divergent Trends in Longevity in High-Income Countries. Washington DC: National Academies Press; 2011. - PubMed
MeSH terms
Grants and funding
LinkOut - more resources
Full Text Sources
Miscellaneous

