Review
. 2019 Sep 23;58(39):13929-13934.
doi: 10.1002/anie.201906920. Epub 2019 Aug 21.

In Situ Single-Cell Western Blot on Adherent Cell Culture

Affiliations
Review

In Situ Single-Cell Western Blot on Adherent Cell Culture

Yizhe Zhang et al. Angew Chem Int Ed Engl. .

Abstract

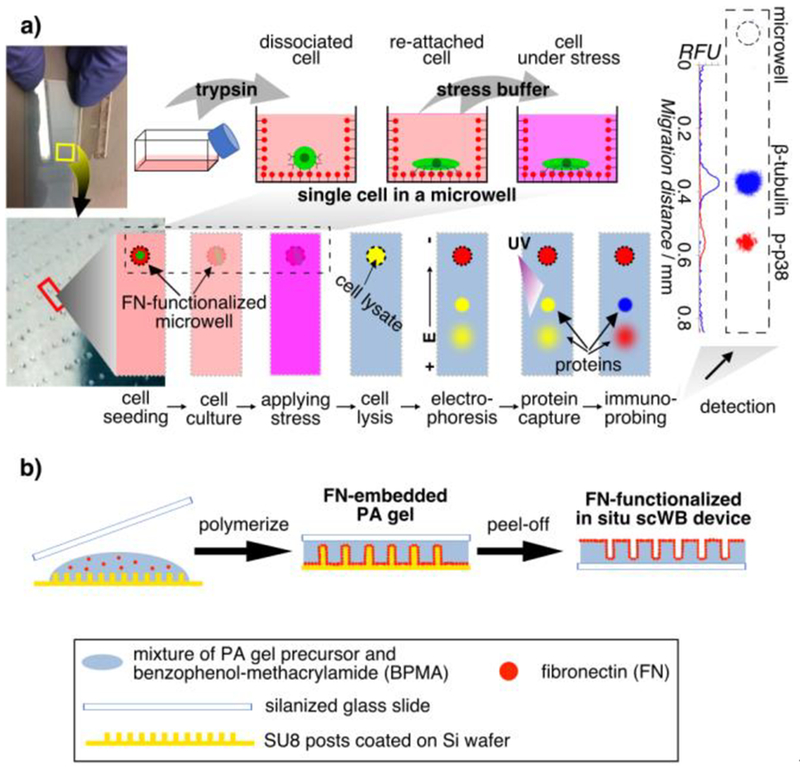
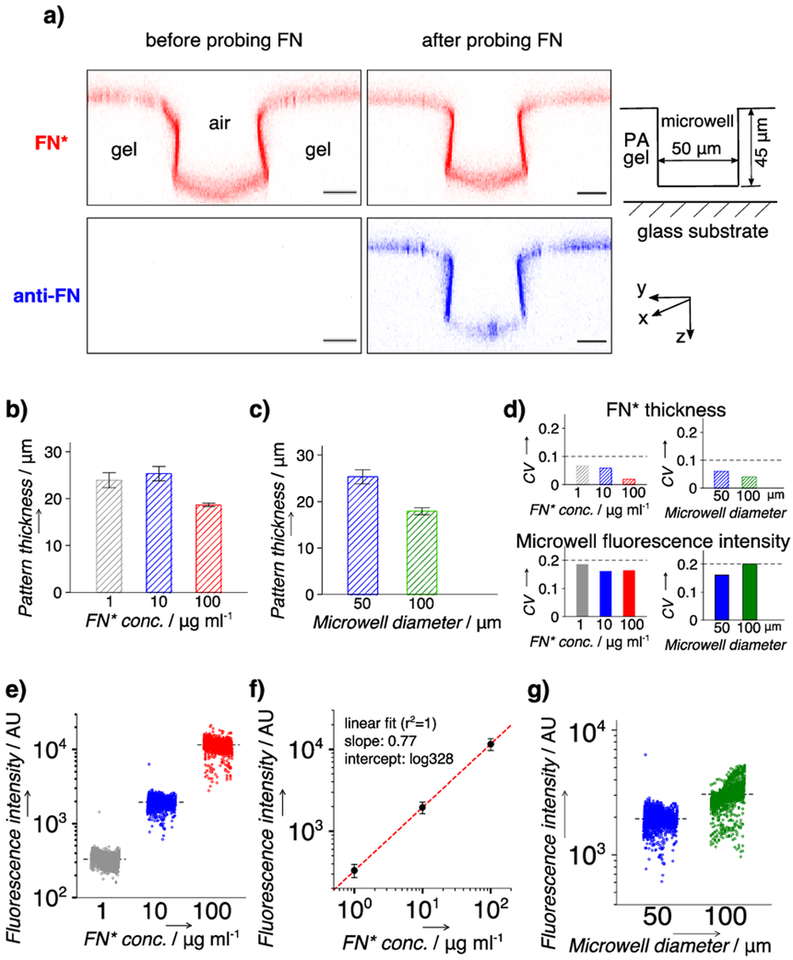
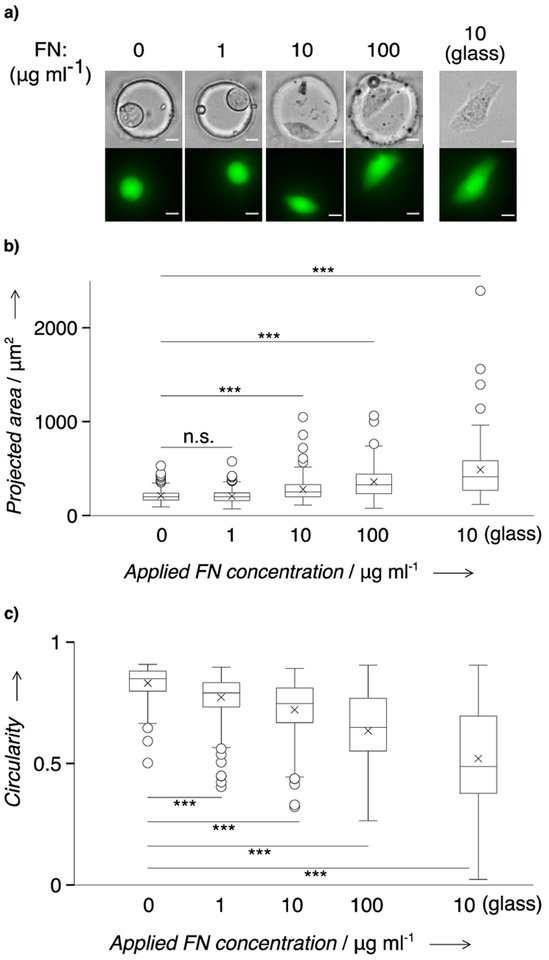
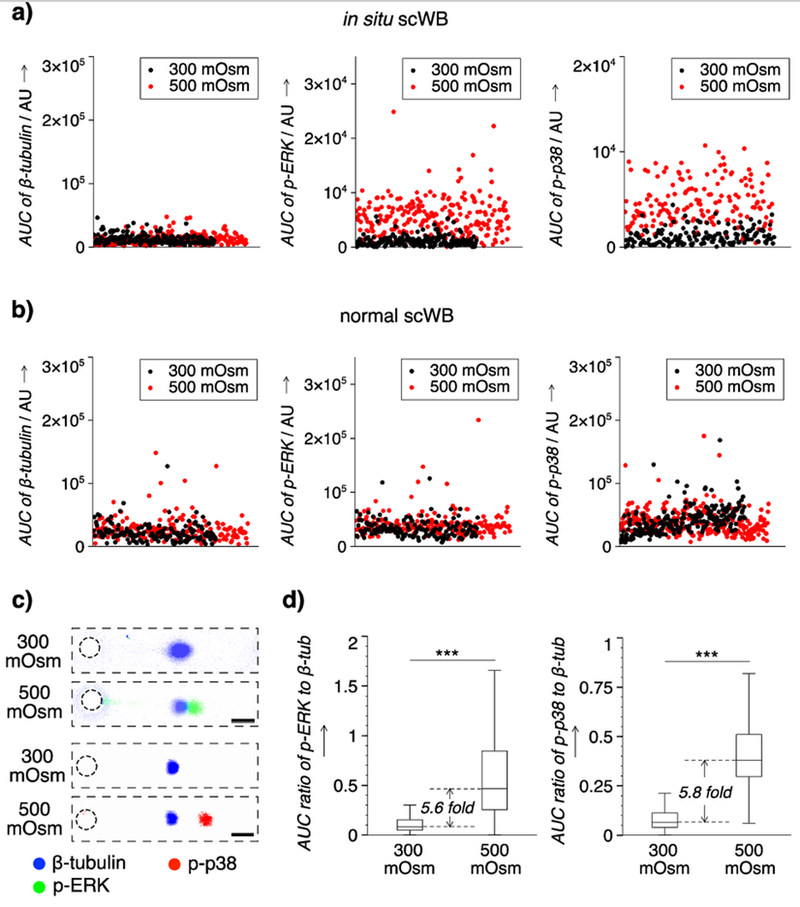
Integrating 2D culture of adherent mammalian cells with single-cell western blotting (in situ scWB) uses microfluidic design to eliminate the requirement for trypsin release of cells to suspension, prior to single-cell isolation and protein analysis. To assay HeLa cells from an attached starting state, we culture adherent cells in fibronectin-functionalized microwells formed in a thin layer of polyacrylamide gel. To integrate the culture, lysis, and assay workflow, we introduce a one-step copolymerization process that creates protein-decorated microwells. After single-cell culture, we lyse each cell in the microwell and perform western blotting on each resultant lysate. We observe cell spreading after overnight microwell-based culture. scWB reports increased phosphorylation of MAP kinases (ERK1/2, p38) under hypertonic conditions. We validate the in situ scWB with slab-gel western blot, while revealing cell-to-cell heterogeneity in stress responses.

Keywords: electrophoresis; hydrogels; in situ western blot; protein phosphorylation; single-cell studies.


Figures

Figure 1.
Figure 1.
In situ single-cell western blot (in situ scWB) measures protein expression in single, adherent cells in culture by integrating on-chip 2D cell culture and single-cell western blotting. a) Schematic of the in situ scWB assay for measuring osmotic stress-induced protein phosphorylation. Left: Photographs of an in situ scWB device fabricated on a standard glass microscope slide. The bottom photograph is the zoom-in of the yellow box in the top photograph. The gel on the device was stained blue for visualization. Middle: Workflow of the in situ scWB assay illustrated with one microwell from among an array of ~2000 microwells on the device. Right: A representative false-colored fluorescence micrograph from in situ scWB of stress-induced phosphorylation, and the fluorescence profile along the electrophoretic separation. β-tubulin: 50 kDa. p38: 41 kDa. b) One-step fabrication of the in situ scWB device, composed of arrays of fibronectin-functionalized microwells stippled in a thin layer of polyacrylamide (PA) gel.
Figure 2.
Figure 2.
Characterization of the fibronectin (FN) layer in microwells on the in situ scWB device. a) Representative false-color confocal fluorescence micrographs (cross section along y-z plane) indicating a thin layer of rhodamine-labeled FN (FN*) at the surface of the in situ scWB device. Microwell: diameter, 50 μm; height, 40 μm. Red: FN*. Blue: FN* probed with AlexaFluor 647-labeled antibody (anti-FN). Scale bar: 20 μm. b) Quantitated thickness of the FN* layer on in situ scWB devices of varied applied FN* concentrations (FN* conc.). c) Quantitated thickness of the FN* layer on in situ scWB devices of varied microwell diameters. n = 3. Error bar: standard deviation. d) Coefficient of variation (CV) of FN* thickness (top) and average microwell fluorescence (bottom). Straight lines are drawn to indicate the values of 0.1 (top) and 0.2 (bottom). e) Average microwell fluorescence from in situ scWB devices spanning various applied FN* concentrations. f) Linear fit to the average fluorescence intensities at each FN* concentration in e). g) Average microwell fluorescence from in situ scWB devices of various microwell diameters. Black lines in e) and g): mean value, n >1900 for each group. Error bars: standard deviation. Unless otherwise specified, the microwell diameter is 50 μm and the applied FN or FN* concentration is 10 μg ml−1.
Figure 3.
Figure 3.
HeLa cells are viable and spread in FN-coated microwells (50 μm in diameter) on the in situ scWB device. a) Representative micrographs of the overnight cultured HeLa cells in FN-coated microwells molded in PA gel. Top: phase contrast micrographs. Bottom: false-color fluorescence micrographs. Cells were stained with calcein AM for morphology characterization. Scale bar: 10 μm. b) Comparison of the cell projected area on varied applied FN concentrations. c) Comparison of the cell circularity on varied applied FN concentrations. Boxes represent the first and third quartiles of analyte distributions. Black lines indicate the median values. Asterisks mark the mean values. Whiskers are 1.5 fold of interquartile range. Circles are outliers. Mann–Whitney significance levels: n.s., p >0.05; ***, p <0.001. n >75 for each group.
Figure 4.
Figure 4.
Phosphorylation of ERK1/2 (ERK) and p38 induced by osmotic stress in single HeLa cells is measured using in situ scWB, but not detected in scWB with ex situ 2D culture, stimulation, and trypsin release to cell suspension. Microwell: 50 μm in diameter. FN concentration: 10 μg ml−1. a) Scatter plots of the protein abundance of single cells from in situ scWB. Insets: zoom-in on y axis. b) Scatter plots of the protein abundance of single cells from scWB of trypsinized cells from conventional 2D cell culture with stimulation (normal scWB). c) Representative false-color fluorescence micrographs of immunoprobed targets in a single cell under iso- and hyper-osmotic conditions. ERK: 42, 44 kDa. Scale bar: 100 μm. d) Box plots that indicate the distribution of the normalized abundance of phosphorylated targets (p-ERK, p-p38) under different osmotic conditions. Boxes represent the first and third quartiles of analyte distributions. Black lines indicate the median values. Whiskers are 1.5 fold of interquartile range. Mann–Whitney significance levels: ***, p <0.001. n >150 for each group.

References

    1. Tsuji K, Ojima M, Otabe K, Horie M, Koga H, Sekiya I, Muneta T, Cell Transplant. 2017, 26, 1089–1102; - PMC - PubMed
    2. Ren X-D, Wang R, Li Q, Kahek LAF, Kaibuchi K, Clark RAF, J. Cell Sci. 2004, 117, 3511–3518; - PubMed
    3. Akiyama SK, Yamada KM, J. Biol. Chem 1985, 260, 4492–4500. - PubMed
    1. Li S, Plouffe BD, Belov AM, Ray S, Wang X, Murthy SK, Karger BL, Ivanov AR, Molecular & Cellular Proteomics 2015, 14: 10.1074/mcp.M114.045724, 1672–1683. - DOI - PMC - PubMed
    1. Kiss M, Gassen SV, Movahedi K, Saeys Y, Laoui D, Cell. Immunol 2018, 330, 188–201; - PubMed
    2. Eun K, Ham SW, Kim H, BMB Rep. 2017, 50 (3), 117–125; - PMC - PubMed
    3. Dingal PCDP, Bradshaw AM, Cho S, Raab M, Buxboim A, Swift J, Discher DE, Nat. Mater 2015, 14, 951–960; - PMC - PubMed
    4. Marklein RA, Lam J, Guvendiren M, Sung KE, Bauer SR, Trends Biotechnol. 2018, 36, 105–118; - PubMed
    5. Ribeiro AJS, Ang Y-S, Fu J-D, Rivas RN, Mohamed TMA, Higgs GC, Srivastava D, Pruitt BL, Proc. Natl. Acad. Sci. USA 2015, 112, 12705–12710; - PMC - PubMed
    6. Tseng P, Carlo DD, Adv. Mater 2014, 26, 1242–1247; - PMC - PubMed
    7. Charrier EE, Pogoda K, Wells RG, Janmey PA, Nat. Commun 2018, 9: 449. - PMC - PubMed
    1. Larsson L-I, Immunocytochemistry: Theory and Practice 1988, CRC Press, Boca Raton.
    1. Caunt CJ, McArdle CA, J. Cell Sci. 2010, 123, 4310–4320; - PMC - PubMed
    2. Ng AHC, Chamberlain MD, Situ H, Lee V, Wheeler AR, Nat. Commun 2015, 6: 7513; - PMC - PubMed
    3. Blazek M, Santisteban TS, Zengerle R, Meier M, Lab Chip 2015, 15, 726–734. - PubMed

Publication types

MeSH terms

LinkOut - more resources