. 2019 Aug 6;28(6):1612-1622.e4.
doi: 10.1016/j.celrep.2019.07.016.

Modeling Human Cancer-induced Cachexia

Affiliations

Modeling Human Cancer-induced Cachexia

Erin E Talbert et al. Cell Rep. .

Abstract

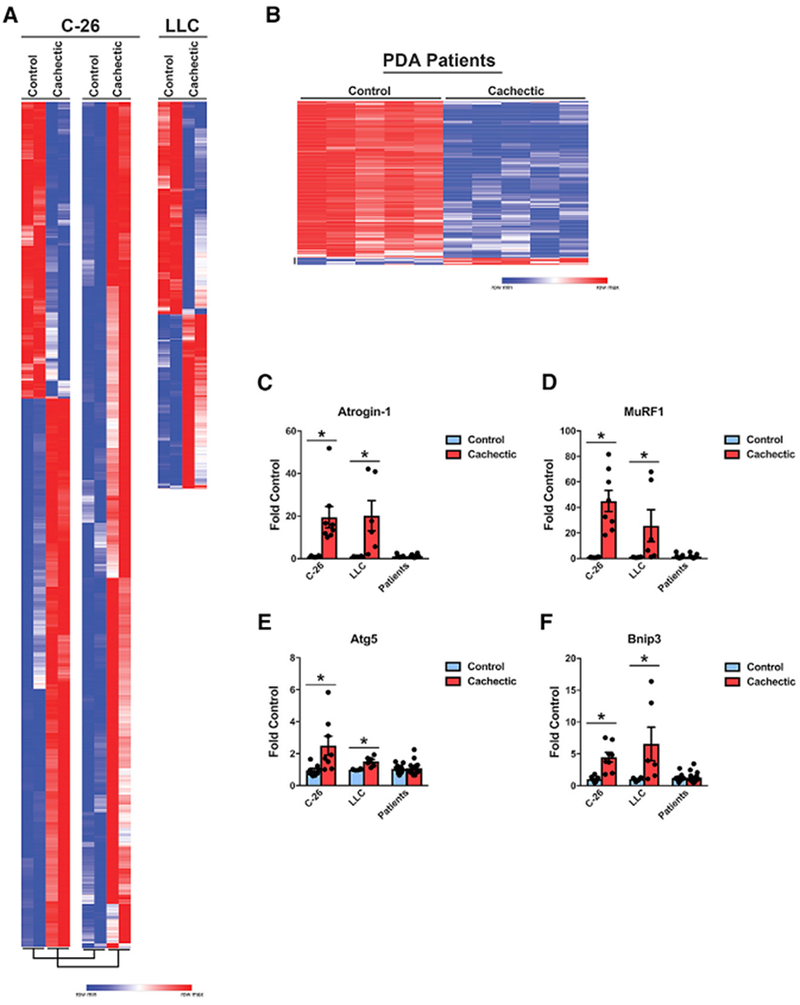
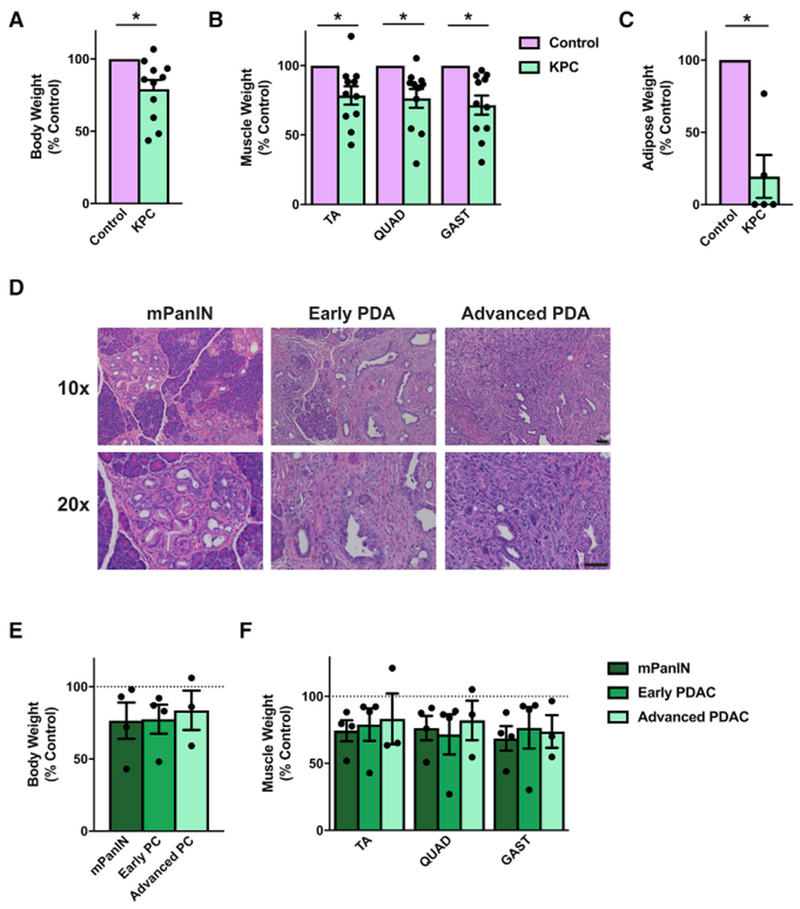
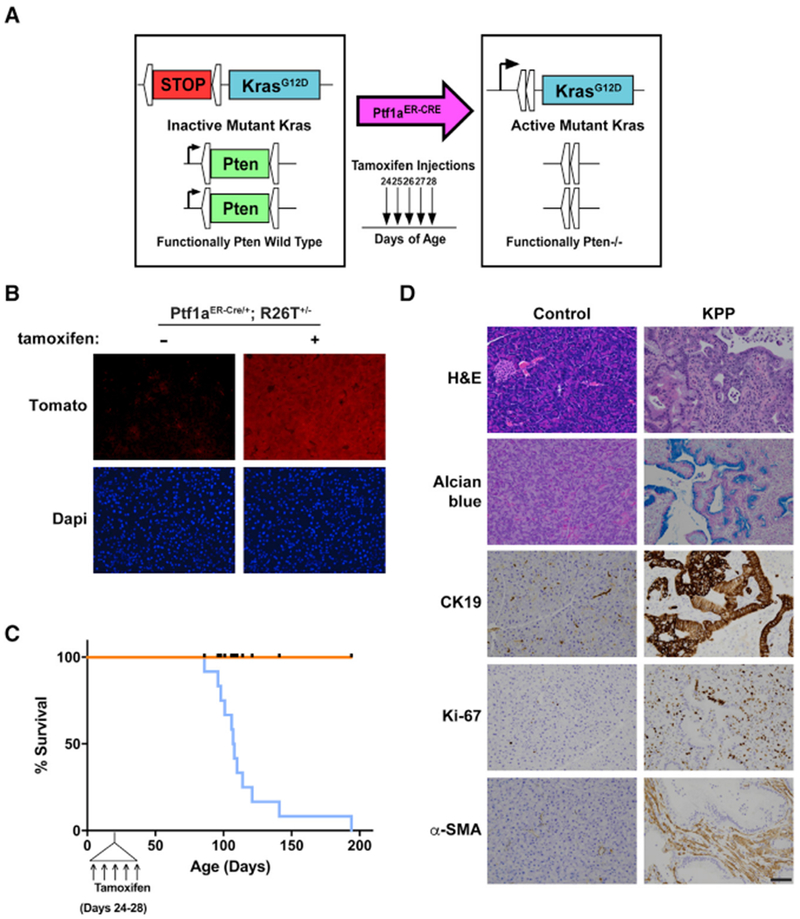
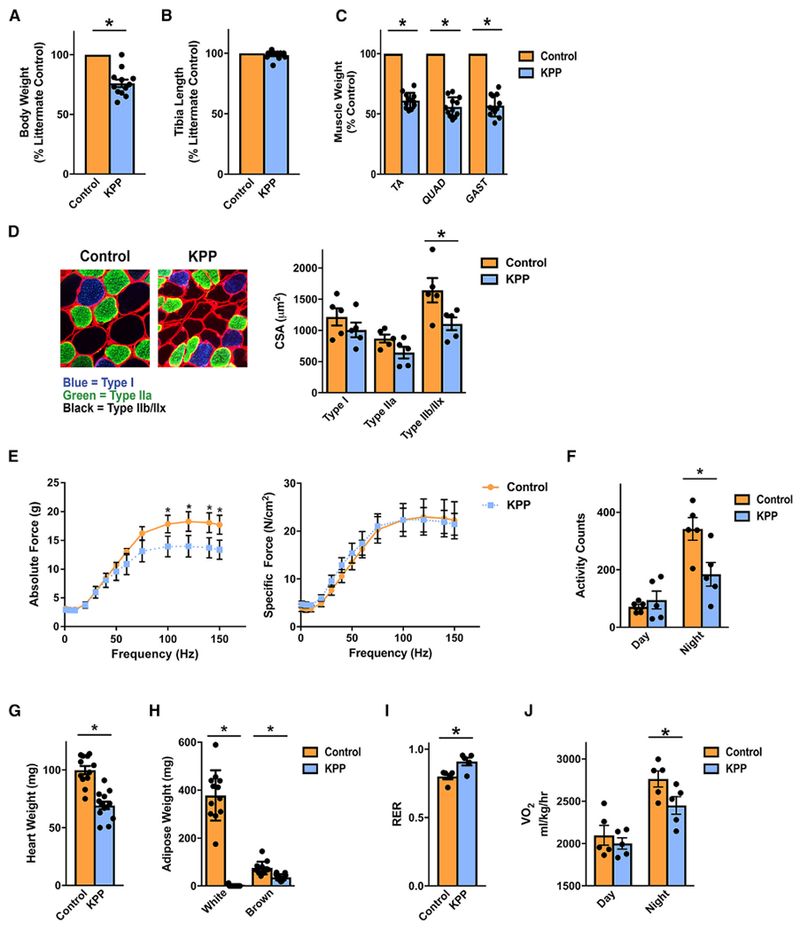
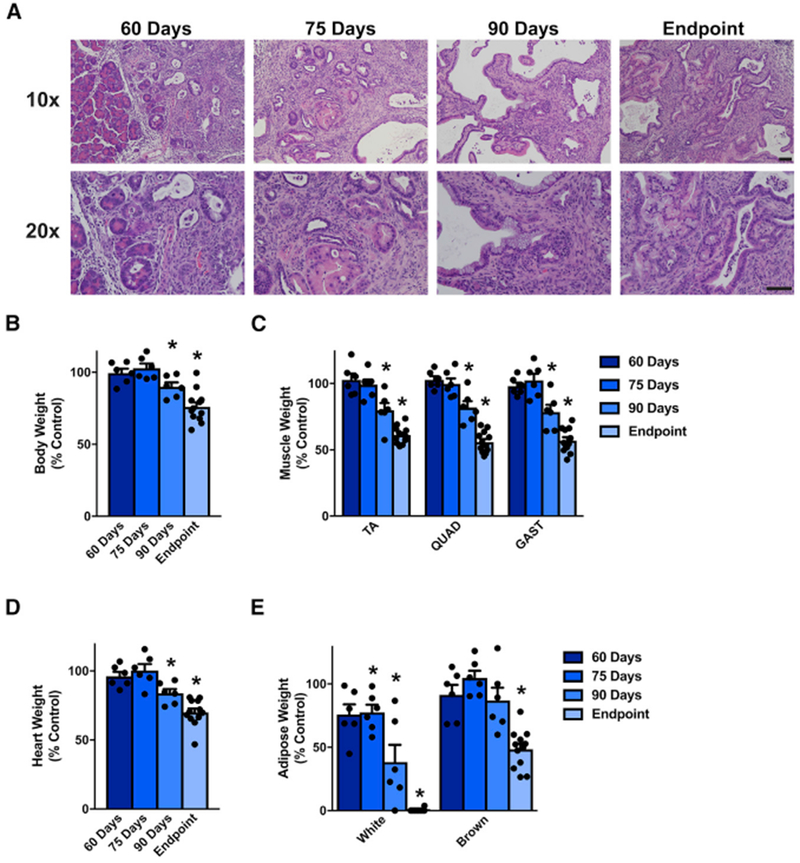
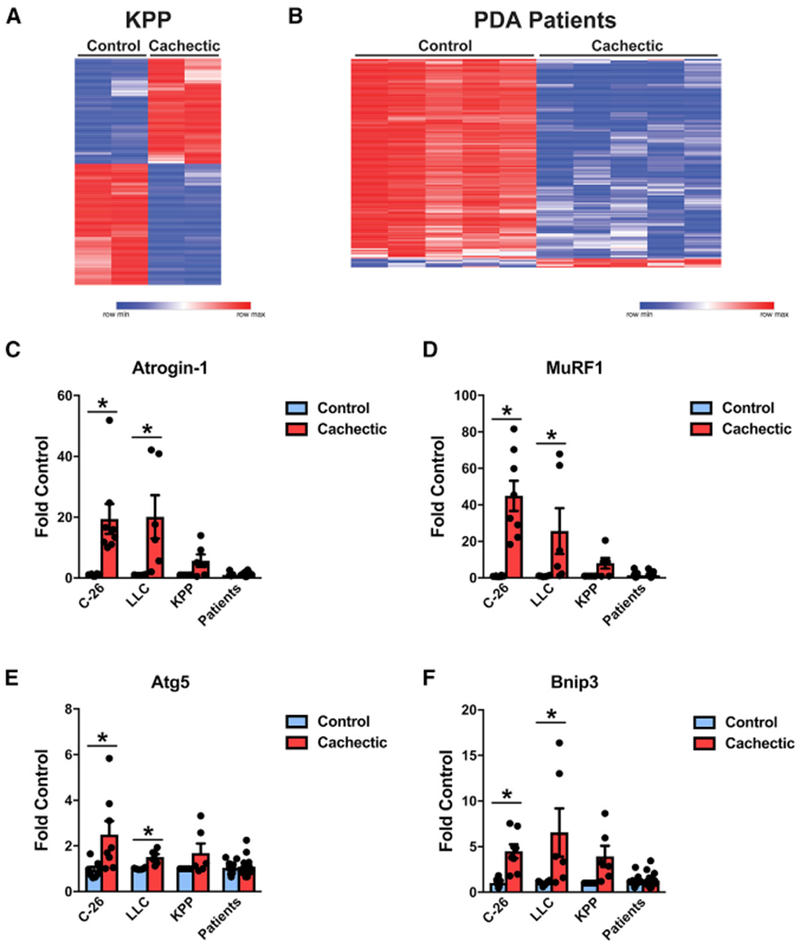
Cachexia is a wasting syndrome characterized by pronounced skeletal muscle loss. In cancer, cachexia is associated with increased morbidity and mortality and decreased treatment tolerance. Although advances have been made in understanding the mechanisms of cachexia, translating these advances to the clinic has been challenging. One reason for this shortcoming may be the current animal models, which fail to fully recapitulate the etiology of human cancer-induced tissue wasting. Because pancreatic ductal adenocarcinoma (PDA) presents with a high incidence of cachexia, we engineered a mouse model of PDA that we named KPP. KPP mice, similar to PDA patients, progressively lose skeletal and adipose mass as a consequence of their tumors. In addition, KPP muscles exhibit a similar gene ontology as cachectic patients. We envision that the KPP model will be a useful resource for advancing our mechanistic understanding and ability to treat cancer cachexia.

Keywords: adipose; cachexia; pancreatic cancer; skeletal muscle; wasting; weight loss.


Conflict of interest statement

DECLARATION OF INTERESTS

The authors declare no competing interests.

Figures

Figure 1.
Figure 1.. Comparing Xenograft Models with Cachectic Pancreatic Cancer Patients
(A) RNA-seq of tibialis anterior (TA) muscle from C-26 and LLC tumor-bearing mice (n = 2 males per group). (B) RNA-seq of n = 5 male non-cancer patients and 5 male cachectic PDA patients. (C–F) Gene expression of (C) Atrogin-1, (D) MuRF1, (E) Atg5, and (F) Bnip3 (n = 8 males for C-26; n = 6 males for LLC; n = 11 controls, 17 cachectic patients, approximately equal male and female). Patient characteristics for RNA-seq can be found in Table S2, and patient characteristics for RT-PCR can be found in Table S3. Bars represent mean ± SEM. Closed circles represent individual data points. *p < 0.05 in a t test. See Figure S1 for additional information.
Figure 2.
Figure 2.. The KPC Mouse as a Model of Cancer Cachexia
(A–C) KPC mice that have reached endpoint criteria have lower body weights (A; n = 11), muscle weights (B; n = 11), and gonadal white adipose tissue masses (C; n = 5) than littermate control mice. (D–F) However, when pancreatic histopathology is considered (D), mice with mPanIN lesions (n = 4), early PDA (n = 4), and advanced PDA (n = 3) all tend to have lower body weights (E) and muscle weights (F). Bars represent mean ± SEM. Closed circles represent individual data points. *p < 0.05 in a paired t test on absolute weights. Scale bars, 50 μm. See Figure S2 for additional information.
Figure 3.
Figure 3.. Generation of the KPP Mouse and Endpoint Analysis
(A) The alleles of the KPP mouse. (B) Naive Ptfa1ER-Cre/+;Rosa26Tomato+/− mice express background fluorescence in pancreas sections, whereas pancreata of tamoxifen-treated Ptfa1ER-Cre/+;Rosa26Tomato+/− mice exhibit a high fluorescence signal. (C) KPP mice induced with tamoxifen between 24 and 28 days of age had an average survival of 107 days of age (n = 12). Ticks on the control line indicate points when a control mouse was euthanized for comparison with a littermate KPP mouse. Control genotypes include Kras+/+, Ptf1a+/ER-Cre, Ptenf/f (n = 6), Kras+/+, Ptf1a+/ER-Cre, Pten+/+ (n = 1), Kras+/+, Ptf1a+/ER-Cre, Pten+/+ (n = 1), Kras+/G12D, Ptf1a+/+, Ptenf/f (n = 1), and Kras+/+, Ptf1a+/+, Pten+/f (n = 3). Control genotypes are presented with their paired KPP mouse in Table S4. (D) Endpoint KPP mice demonstrate moderately well-differentiated to well-differentiated PDA as evidenced by H&E, Alcian blue, CK19, Ki67, and α-smooth muscle actin (α-SMA) staining. Scale bar, 50 μm. See Figure S3 for additional information.
Figure 4.
Figure 4.. The KPP Mouse Develops Cachexia
(A and B) KPP mice are smaller than their littermate controls when reaching endpoint criteria (A) but have similar tibia lengths (B). (C) KPP mice exhibit reduced TA, quadriceps (QUAD), and gastrocnemius (GAST) muscle masses. (D) Muscle wasting in KPP GAST is associated with lower type IIB or IIX fiber cross-sectional area, whereas type IIA fibers tended to be smaller (p = 0.06). (E) Absolute ex vivo extensor digitorum longus (EDL) muscle force was significantly reduced at higher stimulation frequencies, but specific force was not altered. (F) Endpoint KPP mice demonstrate decreased night (awake) activity counts, indicative of depressed whole-body function. (G and H) KPP mice demonstrate decreased heart weight (G) and decreased masses of gonadal white and subscapular brown adipose (H). (I) Consistent with decreased adipose tissue stores, KPP mice exhibit an increased daytime respiratory exchange ratio (RER). (J) KPP mice exhibited decreased night oxygen consumption (VO2). Bars represent mean ± SEM. Closed circles represent individual data points. *p < 0.05 in a paired t test. n = 12 per group; for cross-sectional area and metabolic data, n = 5 per group, and for muscle function data, n = 3 per group. Even when expressed as percent controls, statistical tests were conducted on absolute weights. See Figure S4 for additional information.
Figure 5.
Figure 5.. KPP Mice Exhibit Progressive Cachexia Associated with Advancing Pancreas Pathology
(A) Pancreatic disease in KPP mice progresses across their lifespan. (B–E) Additionally, compared with their littermate controls, KPP mice progressively lose bodyweight (B) , skeletal muscle (C), heart mass (D), and white and brown adipose tissue (E). Bars represent mean ± SEM. Closed circles represent individual data points. “Endpoint” KPP mice have reached Institutional Animal Care and Use Committee (IACUC) euthanasia criteria and are the same mice as shown in Figures 3 and 4 (n = 12). n = 5–6 mice per group for the 60-, 75-, and 90-day time points. Genotypes for each control mouse can be found in Table S6. *p < 0.05 in a paired t test on absolute weights. Scale bar, 50 μm. See Figure S5 for additional information.
Figure 6.
Figure 6.. The Gene Ontology of KPP Mice Resembles that of Cachectic PDA Patients
(A) RNA-seq of TA muscle from KPP mice (n = 2 males per group). (B) RNA-seq of n = 5 male non-cancer patients and 5 male cachectic PDA patients. (C–F) Gene expression of (C) Atrogin-1, (D) MuRF1, (E) Atg5, and (F) Bnip3 (n = 8 males for C-26; n = 6 males for LLC, n = 3 males and 3 females for KPP; n = 11 controls, 17 cachectic patients, approximately equal male and female). Patient characteristics for RNA-seq can be found in Table S2, and patient characteristics for RT-PCR can be found in Table S3. Bars represent mean ± SEM. Closed circles represent individual data points. *p < 0.05 in a t test. See Figure S6 for additional information.

References

    1. Acharyya S, Ladner KJ, Nelsen LL, Damrauer J, Reiser PJ, Swoap S, and Guttridge DC (2004). Cancer cachexia is regulated by selective targeting of skeletal muscle gene products. J. Clin. Invest 114, 370–378. - PMC - PubMed
    1. Acharyya S, Butchbach ME, Sahenk Z, Wang H, Saji M, Carathers M, Ringel MD, Skipworth RJ, Fearon KC, Hollingsworth MA, et al. (2005). Dystrophin glycoprotein complex dysfunction: a regulatory link between muscular dystrophy and cancer cachexia. Cancer Cell 8, 421–432. - PubMed
    1. Aichler M, Seiler C, Tost M, Siveke J, Mazur PK, Da Silva-Buttkus P, Bartsch DK, Langer P, Chiblak S, Dürr A, et al. (2012). Origin of pancreatic ductal adenocarcinoma from atypical flat lesions: a comparative study in transgenic mice and human tissues. J. Pathol 226, 723–734. - PubMed
    1. American Cancer Society (2018). Cancer Facts & Figures 2018 (American Cancer Society).
    1. Andreyev HJ, Norman AR, Oates J, and Cunningham D (1998). Why do patients with weight loss have a worse outcome when undergoing chemotherapy for gastrointestinal malignancies? Eur. J. Cancer 34, 503–509. - PubMed

Publication types