. 2019 Aug 6;28(6):1623-1634.e4.
doi: 10.1016/j.celrep.2019.07.017.

Development of a Mouse Pain Scale Using Sub-second Behavioral Mapping and Statistical Modeling

Affiliations

Development of a Mouse Pain Scale Using Sub-second Behavioral Mapping and Statistical Modeling

Ishmail Abdus-Saboor et al. Cell Rep. .

Abstract

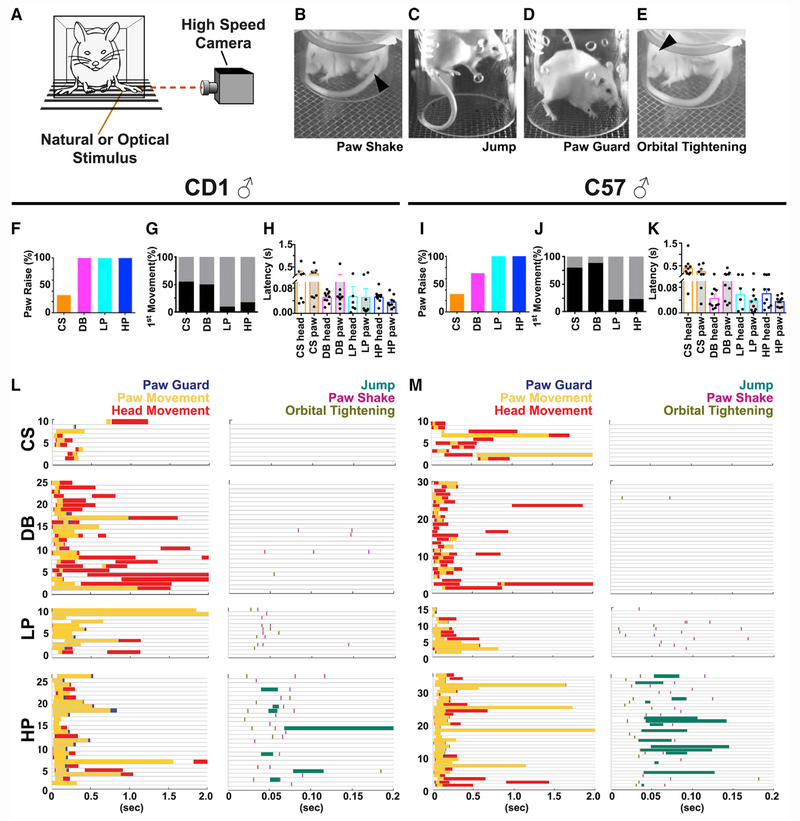
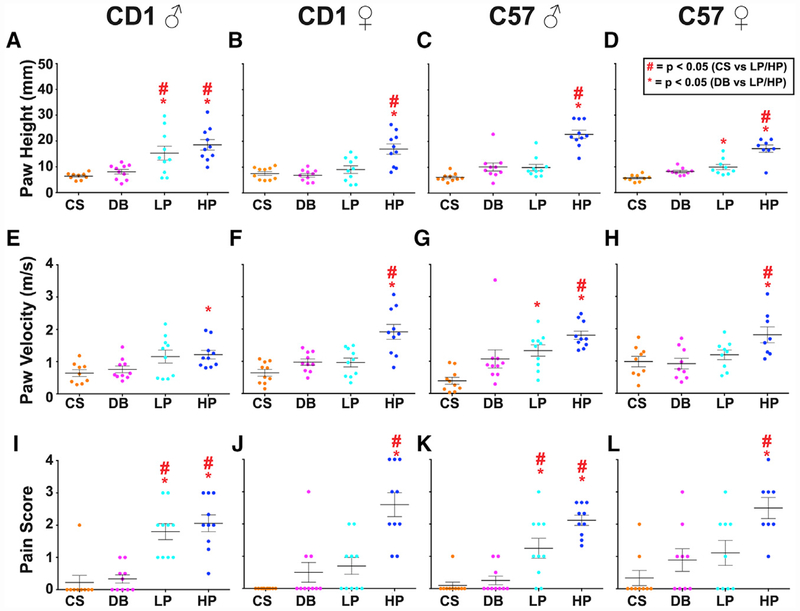
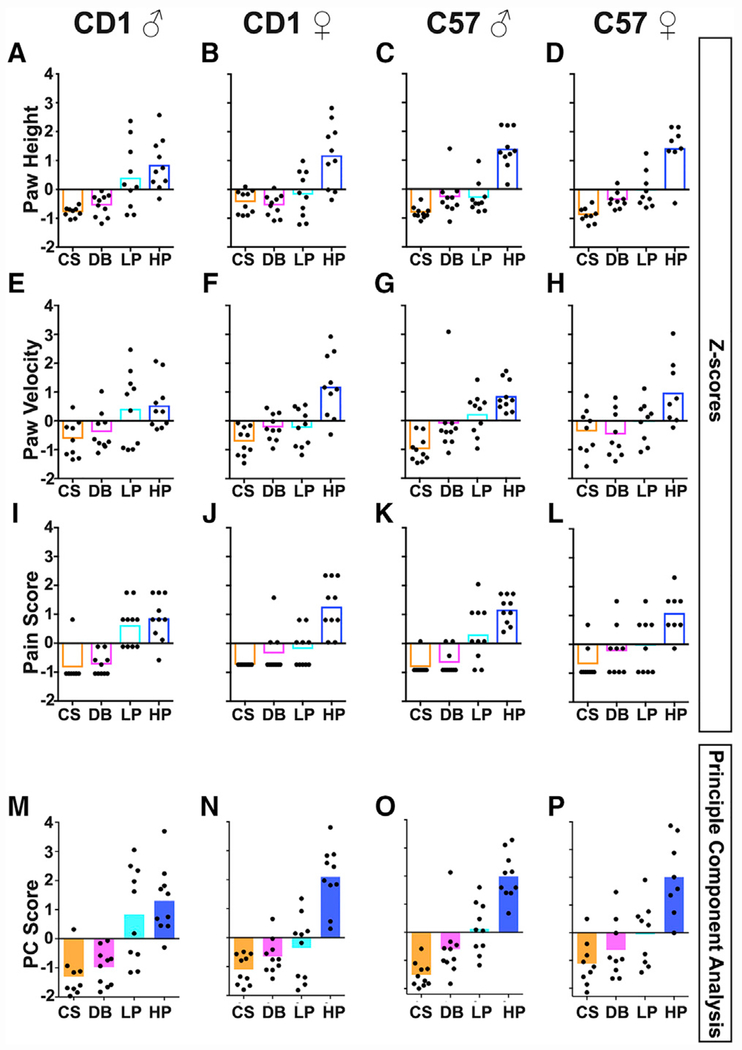
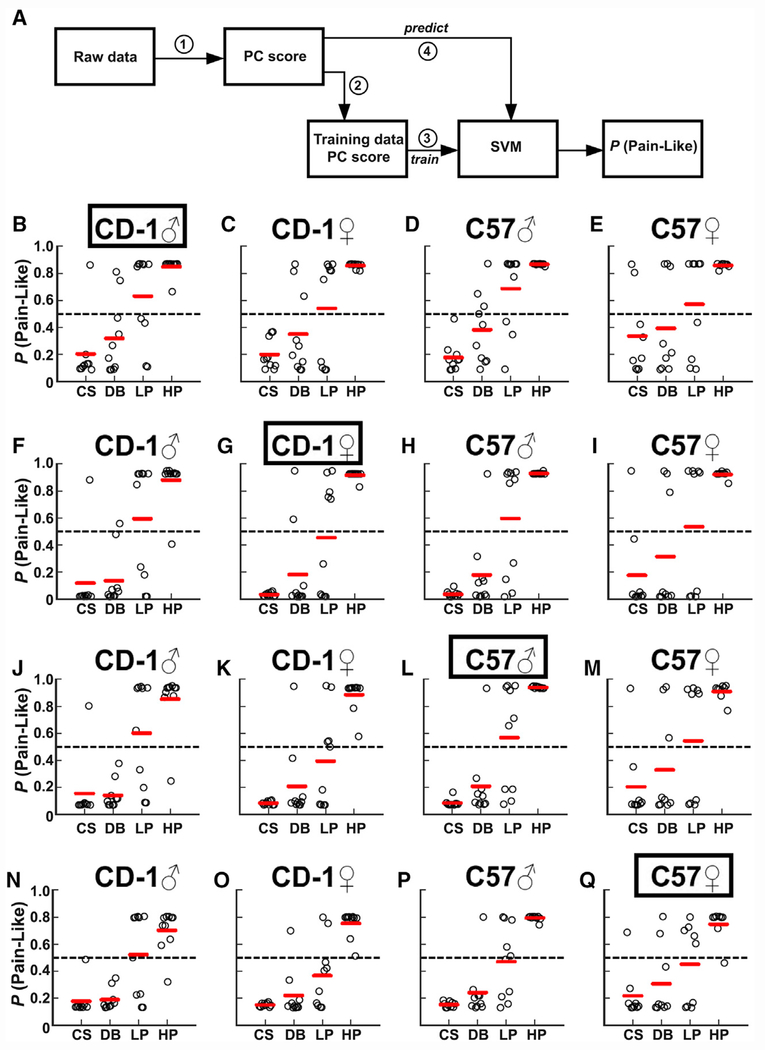
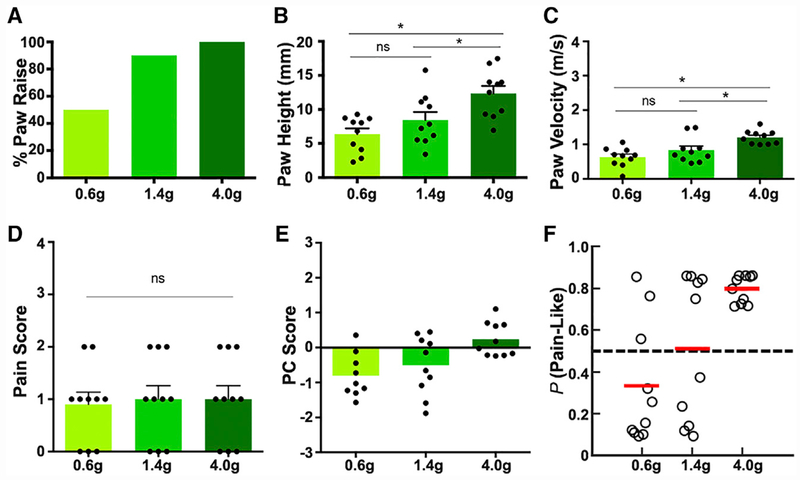
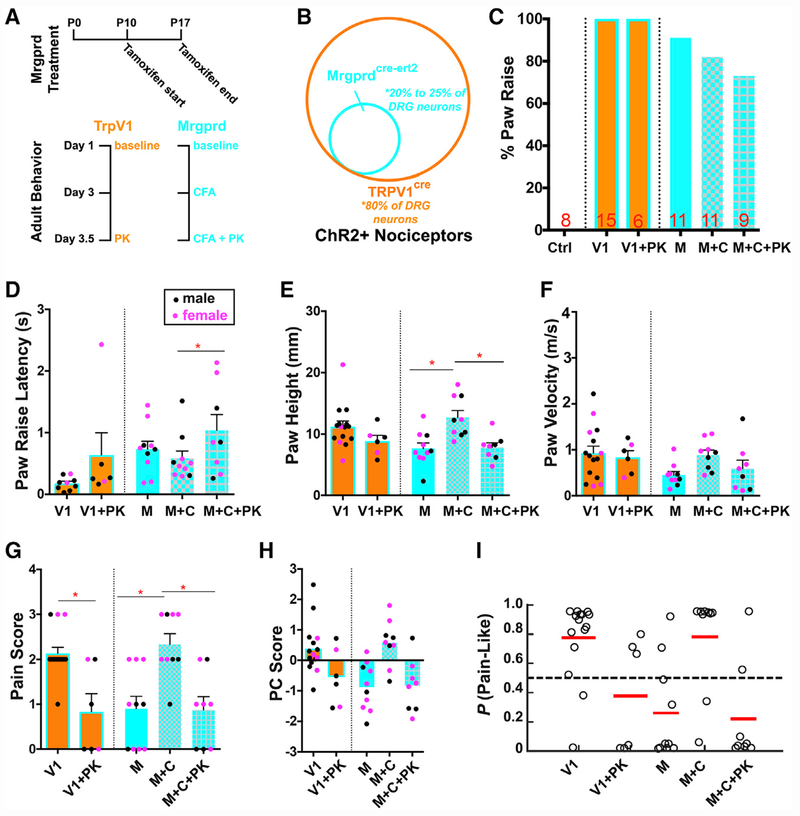
Rodents are the main model systems for pain research, but determining their pain state is challenging. To develop an objective method to assess pain sensation in mice, we adopt high-speed videography to capture sub-second behavioral features following hind paw stimulation with both noxious and innocuous stimuli and identify several differentiating parameters indicating the affective and reflexive aspects of nociception. Using statistical modeling and machine learning, we integrate these parameters into a single index and create a "mouse pain scale," which allows us to assess pain sensation in a graded manner for each withdrawal. We demonstrate the utility of this method by determining sensations triggered by three different von Frey hairs and optogenetic activation of two different nociceptor populations. Our behavior-based "pain scale" approach will help improve the rigor and reproducibility of using withdrawal reflex assays to assess pain sensation in mice.

Keywords: high-speed imaging; machine learning; mouse pain behavior; nociceptors; optogenetics; pain scale; principle component analysis; somatosensation.


Conflict of interest statement

DECLARATION OF INTERESTS

The authors declare no competing interests.

Figures

Figure 1.
Figure 1.. Sub-second Temporal Mapping of Mouse Behavioral Features in Response to Natural Mechanical Stimuli
(A) Schematic of behavioral setup showing lateral placement of high-speed camera in relation to contained yet freely behaving mouse. (B–E) Representative single-frame images taken from high-speed videos of CD1 male mice following stimulation. Black arrows indicate paw shake in (B) and orbital tightening in (E), while animal jumping with paws off the mesh is shown in (C) and paw guarding with abnormal paw placement back on mesh floor is shown in (D). (F–K) Percentage of paw raises (F), first movement being either head (black) or paw (gray) (G), and latency of head and paw movement for each stimulus in (H) CD1 and percentage of paw raises (I), first movement a head (black) or paw (gray) (J), and latency of head and paw movement for each stimulus (K) in C57 male mice. (L and M) Raster plot of CD1 (L) and C57 (M) mice sub-second behaviors (color-coded) in response to cotton swab (CS), dynamic brush (DB), light pinprick (LP), and heavy pinprick (HP) during either the first 2 s or the first 200 ms. For each raster plot, time of behavior shown on x axis, while each trial per animal is on y axis. n = 10 animals for all groups in (F)–(M).
Figure 2.
Figure 2.. Quantification of the Three Behavior Parameters Showing Statistical Differences between Innocuous and Noxious Stimuli
Each dot represents a given trial. Statistical significance between stimuli is determined using one-way ANOVA followed by Tukey’s multiple comparison test. Red stars represent p values < 0.05 when comparing CS with LP or CS with HP (LP or HP > CS), while red asterisks represent p values < 0.05 when comparing DB with LP or DB with HP (LP or HP > DB). Error bars represent SEM, and the longest horizontal line represents the mean. (A–D) The maximum height of the first paw raise of the stimulated paw in CD1 males (A), CD1 females (B), C57 males (C), and C57 females (D). (E–H) The paw velocity of the first paw raise of the stimulated paw in CD1 males (E), CD1 females (F), C57 males (G), and C57 females (H). (I–L) The pain score for a given animal to each stimulus in CD1 males (I), CD1 females (J), C57 males (K), and C57 females (L). The pain score is a composite measurement of orbital tightening, jumping, paw shaking, and paw guarding. Genotype and sex are indicated at top of each column; n = 10 animals for all groups.
Figure 3.
Figure 3.. Statistical Analyses to Normalize the Three Parameters into One PC Score
(A–L) Z scores of individual mice are plotted relative to the combined mean from the four groups of sex and genotype in Figure 3. Each dot represents an individual mouse. Multiple trials of the same mouse from the same stimulus were averaged first for this analysis. Plotted are Z scores for paw height in CD1 males (A), CD1 females (B), C57 males (C), and C57 females (D); paw velocity in CD1 males (E), CD1 females (F), C57 males (G), C57 females (H); and pain score in CD1 males (I), CD1 females (J), C57 males (K), and C57 females (L). (M–P) The PC1 was plotted as a PC score following calculation of Z scores for individual measures and obtaining eigenvalues for CD1 males (M), CD1 females (N), C57 males (O), and C57 females (P). Genotype and sex are indicated at top of each column; n = 10 animals for all groups.
Figure 4.
Figure 4.. Machine Learning Predicts “Pain-like” Probability for Each Paw Withdrawal Reflex
A trained support vector machine (SVM) analyzed each behavior trial and output its probability of being pain-like. (A) Graphical representation of the SVM process. Step (1): generate PCA1 eigenvalues from PCA datasets from Table 1. Step (2): calculate PC score of the PCA dataset. Step (3): train SVM with PC scores of fitting data (red circles). Step (4): predict pain-like probability (P [pain-like]) of all PC scores. (B–E) Predictions made in CD1 males (B), CD1 females (C), C57 males (D), and C57 females (E) following training with CS and HP trials from CD1 males (outlined). (F–I) Predictions made in CD1 males (F), CD1 females (G), C57 males (H), and C57 females (I) following training with CS and HP trials from CD1 females (outlined). (J–M) Predictions made in CD1 males (J), CD1 females (K), C57 males (L), and C57 females (M) following training with CS and HP trials from C57 males (outlined). (N–Q) Predictions made in CD1 males (N), CD1 females (O), C57 males (P), and C57 females (Q) following training with CS and HP trials from C57 females (outlined). n = 10 animals for all groups.
Figure 5.
Figure 5.. Analysis of Mouse Paw Withdrawal Reflex in Response to von Frey Hairs
(A) Responsive rate of CD1 male mice to each VFH filament. (B–D) Paw height (B), paw velocity (C), and pain score (D) were quantified for each VFH filament. Each dot represents an individual mouse. (E) PC score plot for each VFH filament. (F) SVM predications for each VFH filament. SVM was trained with CS and HP data of CD1 males. n = 10 animals for all groups.
Figure 6.
Figure 6.. Optogenetic Activation of TRPV1-ChR2+ and MRGPRD+ Primary Afferents
(A) Diagram of treatment paradigm and experimental design for paw reflexive behavior assays with Trpv1-ChR2 mice (orange) and Mrgprd-ChR2 (blue) mice. (B) Graphical representation of the nociceptor populations targeted in Trpv1-ChR2 and Mrgprd-ChR2 mice. (C) Percentage of animals displaying paw raise. “Ctrl” indicates ChR2f/f littermate control (n = 8 animals). “V” indicates Trpv1-ChR2 mice at baseline (n = 15 animals), and “V+PK” indicates Trpv1-ChR2 mice treated with painkiller (n = 6 animals). “M” indicates Mrgprd-ChR2 mice at baseline (n = 11 animals), “M+C” indicates Mrgprd-ChR2 mice at 3 days post-CFA (n = 11 animals), and “M+C+PK” indicates Mrgprd-ChR2 mice receiving painkiller at 3.5 days after CFA injection (n = 9 animals). (D) Latency between blue light stimulation and paw raise. (E–G) quantification for paw height (E), paw velocity (F), and pain score (G). (H) PC scores of Trpv1-ChR2 and Mrgprd-ChR2 mice at baseline, after CFA, and CFA + painkillers using eigenvectors derived from wild-type mice of both sexes and genotypes. Trials with female mice indicated as pink dots and males as black dots. (I) SVM pain-probability graphs using all wild-type mice of both sexes and genotypes as training datasets to predict the probability of a pain response for Trpv1-ChR2 and Mrgprd-ChR2 optogenetic responses in baseline, after CFA, and CFA + painkillers.

References

    1. Akintola T, Raver C, Studlack P, Uddin O, Masri R, and Keller A (2017). The grimace scale reliably assesses chronic pain in a rodent model of trigeminal neuropathic pain. Neurobiol Pain 2, 13–17. - PMC - PubMed
    1. Arcourt A, Gorham L, Dhandapani R, Prato V, Taberner FJ, Wende H, Gangadharan V, Birchmeier C, Heppenstall PA, and Lechner SG (2017). Touch receptor-derived sensory information alleviates acute pain signaling and fine-tunes nociceptive reflex coordination. Neuron 93, 179–193. - PubMed
    1. Barik A, Thompson JH, Seltzer M, Ghitani N, and Chesler AT (2018). A brainstem-spinal circuit controlling nocifensive behavior. Neuron 100, 1491–1503. e3. - PubMed
    1. Barrot M (2012). Tests and models of nociception and pain in rodents. Neuro-science 211, 39–50. - PubMed
    1. Beaudry H, Daou I, Ase AR, Ribeiro-da-Silva A, and Sdguela P (2017). Distinct behavioral responses evoked by selective optogenetic stimulation of the major TRPV1+ and MrgD+ subsets of C-fbers. Pain 158, 2329–2339. - PubMed

Publication types

LinkOut - more resources