. 2019 Aug 6;8(8):281.
doi: 10.3390/antiox8080281.

Carnosine Decreases PMA-Induced Oxidative Stress and Inflammation in Murine Macrophages

Affiliations

Carnosine Decreases PMA-Induced Oxidative Stress and Inflammation in Murine Macrophages

Giuseppe Caruso et al. Antioxidants (Basel). .

Abstract

Carnosine is an endogenous dipeptide composed of β-alanine and L-histidine. This naturally occurring molecule is present at high concentrations in several mammalian excitable tissues such as muscles and brain, while it can be found at low concentrations in a few invertebrates. Carnosine has been shown to be involved in different cellular defense mechanisms including the inhibition of protein cross-linking, reactive oxygen and nitrogen species detoxification as well as the counteraction of inflammation. As a part of the immune response, macrophages are the primary cell type that is activated. These cells play a crucial role in many diseases associated with oxidative stress and inflammation, including atherosclerosis, diabetes, and neurodegenerative diseases. In the present study, carnosine was first tested for its ability to counteract oxidative stress. In our experimental model, represented by RAW 264.7 macrophages challenged with phorbol 12-myristate 13-acetate (PMA) and superoxide dismutase (SOD) inhibitors, carnosine was able to decrease the intracellular concentration of superoxide anions (O2-•) as well as the expression of Nox1 and Nox2 enzyme genes. This carnosine antioxidant activity was accompanied by the attenuation of the PMA-induced Akt phosphorylation, the down-regulation of TNF-α and IL-6 mRNAs, and the up-regulation of the expression of the anti-inflammatory mediators IL-4, IL-10, and TGF-β1. Additionally, when carnosine was used at the highest dose (20 mM), there was a generalized amelioration of the macrophage energy state, evaluated through the increase both in the total nucleoside triphosphate concentrations and the sum of the pool of intracellular nicotinic coenzymes. Finally, carnosine was able to decrease the oxidized (NADP+)/reduced (NADPH) ratio of nicotinamide adenine dinucleotide phosphate in a concentration dependent manner, indicating a strong inhibitory effect of this molecule towards the main source of reactive oxygen species in macrophages. Our data suggest a multimodal mechanism of action of carnosine underlying its beneficial effects on macrophage cells under oxidative stress and inflammation conditions.

Keywords: antioxidants; carnosine; inflammation; macrophages; oxidative stress; superoxide.


Conflict of interest statement

The authors declare no conflict of interest.

Figures

Figure 1
Figure 1
Detection of intracellular concentrations of O2• (as detected by microchip electrophoresis with laser-induced fluorescence (ME-LIF)) in resting (control) macrophages and in macrophages stimulated with phorbol 12-myristate 13-acetate (PMA) and superoxide dismutase (SOD) inhibitors, in absence or presence of increasing concentrations (5, 10, or 20) of carnosine or anserine. (A) Change in O2• production (expressed as Average peak area/Cell) in macrophages subjected to two different acute stimulations with PMA. (B,C) show the ability of carnosine and anserine in decreasing the intracellular concentrations of O2• PMA-induced, respectively. The O2• levels are expressed as the percent variation with respect to the PMA-stimulated cells. Values are means ± SD of three to five independent experiments. *** p < 0.001 vs. CTRL; θ p < 0.05 vs. PMA 30 min; # p < 0.05 vs. PMA; ### p < 0.001 vs. PMA; ϕ p < 0.05 vs. PMA + C5; ϕϕ p < 0.01 vs. PMA + C10; ϕϕϕ p < 0.001 vs. PMA + C5; ωω p < 0.01 vs. PMA + A5.
Figure 2
Figure 2
Changes in nucleoside triphosphate concentrations (ATP, GTP, UTP, and CTP), expressed as nmol/million cells, in resting (control) macrophages and in macrophages stimulated with PMA and SOD inhibitors, in absence or presence of increasing concentrations (5, 10, or 20) of carnosine. Values are means ± SD of four independent experiments. ** p < 0.01 vs. CTRL; ## p < 0.01 vs. PMA; ### p < 0.001 vs. PMA; ϕ p < 0.05 vs. PMA + C5 and PMA + C10; ϕϕ p < 0.01 vs. PMA + C5 and PMA + C10.
Figure 3
Figure 3
Consequences of the different cell treatments on (A) the sum (NAD+ + NADH and NADP+ + NADPH) and (B) the ratio (NAD+/NADH and NADP+/NADPH) of intracellular nicotinic coenzymes in resting (control) macrophages and in macrophages stimulated with PMA and SOD inhibitors, in absence or presence of increasing concentrations (5, 10, or 20) of carnosine. The sum of intracellular nicotinic coenzymes is expressed as nmol/million cells. Values are means ± SD of four independent experiments. * p < 0.05 vs. CTRL; ** p < 0.01 vs. CTRL; *** p < 0.001 vs. CTRL; # p < 0.05 vs. PMA; ## p < 0.01 vs. PMA; ### p < 0.001 vs. PMA; ϕ p < 0.05 vs. PMA + C5 and PMA + C10; ϕϕϕ p < 0.001 vs. PMA + C5.
Figure 3
Figure 3
Consequences of the different cell treatments on (A) the sum (NAD+ + NADH and NADP+ + NADPH) and (B) the ratio (NAD+/NADH and NADP+/NADPH) of intracellular nicotinic coenzymes in resting (control) macrophages and in macrophages stimulated with PMA and SOD inhibitors, in absence or presence of increasing concentrations (5, 10, or 20) of carnosine. The sum of intracellular nicotinic coenzymes is expressed as nmol/million cells. Values are means ± SD of four independent experiments. * p < 0.05 vs. CTRL; ** p < 0.01 vs. CTRL; *** p < 0.001 vs. CTRL; # p < 0.05 vs. PMA; ## p < 0.01 vs. PMA; ### p < 0.001 vs. PMA; ϕ p < 0.05 vs. PMA + C5 and PMA + C10; ϕϕϕ p < 0.001 vs. PMA + C5.
Figure 4
Figure 4
Measurement of (A) Nox1, (B) Nox2, and (C) iNOS mRNA expression levels (quantitative real-time PCR (qRT-PCR)) in resting (control) macrophages and in macrophages stimulated with PMA and SOD inhibitors, in absence or presence of increasing concentrations (5, 10, or 20) of carnosine. The abundance of each mRNA of interest was expressed relative to the abundance of GAPDH-mRNA, as an internal control. As a negative control, a reaction in absence of cDNA (no template control, NTC) was performed. Values are means ± SD of three to seven independent experiments. ** p < 0.01 vs. CTRL; *** p < 0.001 vs. CTRL; # p < 0.05 vs. PMA; ## p < 0.01 vs. PMA.
Figure 5
Figure 5
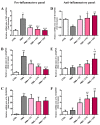
Measurement of (A) TNF-α, (B) IL-6, (C) IL-1β, (D) TGF-β1, (E) IL-4, and (F) IL-10mRNA expression levels (qRT-PCR) in resting (control) macrophages and in macrophages stimulated with PMA and SOD inhibitors, in absence or presence of increasing concentrations (5, 10, or 20) of carnosine. GAPDH-mRNA and NTC reactions were used as internal and negative controls, respectively, as described in Figure 4. Values are means ± SD of three to seven independent experiments. * p < 0.05 vs. CTRL; ** p < 0.01 vs. CTRL; *** p < 0.001 vs. CTRL; # p < 0.05 vs. PMA; ## p < 0.01 vs. PMA; ### p < 0.001 vs. PMA; ϕ p < 0.05 vs. PMA + C5.
Figure 6
Figure 6
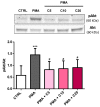
Carnosine partially reduced Akt phosphorylation levels PMA-induced in macrophages. Representative immunoblots of phosphorylated Akt (p(ser473)Akt) and total Akt (Akt) in total protein extracts from resting (control) macrophages and macrophages stimulated with PMA and SOD inhibitors, in absence or presence of increasing concentrations (5, 10, or 20) of carnosine. Histograms refer to the means ± SD of five independent experiments. The densitometric values of pAkt bands were normalized against Akt. *** p < 0.001 vs. CTRL; # p < 0.05 vs. PMA.

References

    1. De Campos R.P., Siegel J.M., Fresta C.G., Caruso G., Da Silva J.A., Lunte S.M. Indirect detection of superoxide in raw 264.7 macrophage cells using microchip electrophoresis coupled to laser-induced fluorescence. Anal. Bioanal. Chem. 2015;407:7003–7012. doi: 10.1007/s00216-015-8865-1. - DOI - PMC - PubMed
    1. Ma Z.A., Zhao Z., Turk J. Mitochondrial dysfunction and beta-cell failure in type 2 diabetes mellitus. Exp. Diabetes Res. 2012;2012:703538. doi: 10.1155/2012/703538. - DOI - PMC - PubMed
    1. Birben E., Sahiner U.M., Sackesen C., Erzurum S., Kalayci O. Oxidative stress and antioxidant defense. World Allergy Organ. J. 2012;5:9–19. doi: 10.1097/WOX.0b013e3182439613. - DOI - PMC - PubMed
    1. Gunasekara D.B., Siegel J.M., Caruso G., Hulvey M.K., Lunte S.M. Microchip electrophoresis with amperometric detection method for profiling cellular nitrosative stress markers. Analyst. 2014;139:3265–3273. doi: 10.1039/C4AN00185K. - DOI - PMC - PubMed
    1. Weidinger A., Kozlov A.V. Biological activities of reactive oxygen and nitrogen species: Oxidative stress versus signal transduction. Biomolecules. 2015;5:472–484. doi: 10.3390/biom5020472. - DOI - PMC - PubMed