. 2019 Aug 7;19(1):345.
doi: 10.1186/s12870-019-1953-1.

Genome-wide identification, structure characterization, and expression pattern profiling of aquaporin gene family in cucumber

Affiliations

Genome-wide identification, structure characterization, and expression pattern profiling of aquaporin gene family in cucumber

Yong-Xing Zhu et al. BMC Plant Biol. .

Abstract

Background: Aquaporin (AQP) proteins comprise a group of membrane intrinsic proteins (MIPs) that are responsible for transporting water and other small molecules, which is crucial for plant survival under stress conditions including salt stress. Despite the vital role of AQPs, little is known about them in cucumber (Cucumis sativus L.).

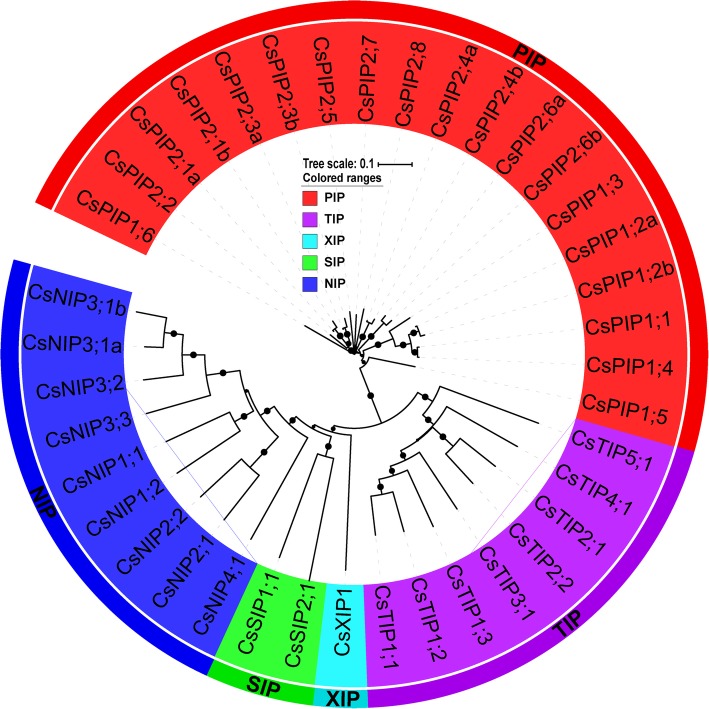
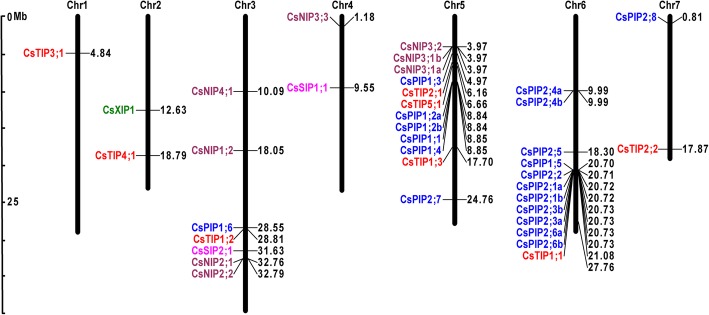
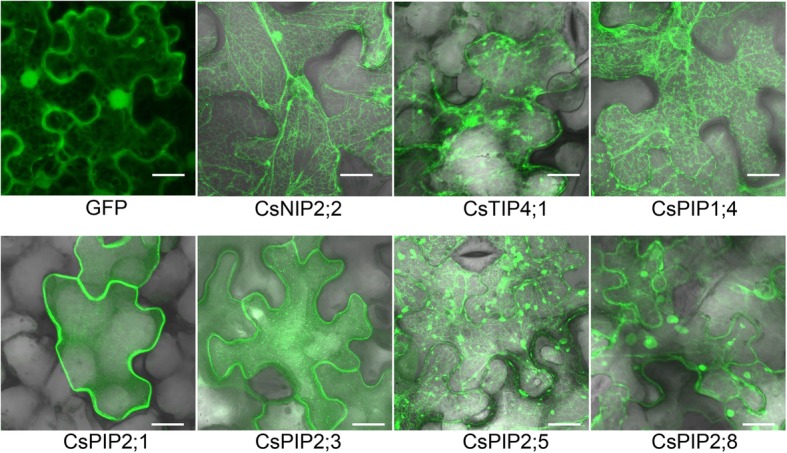
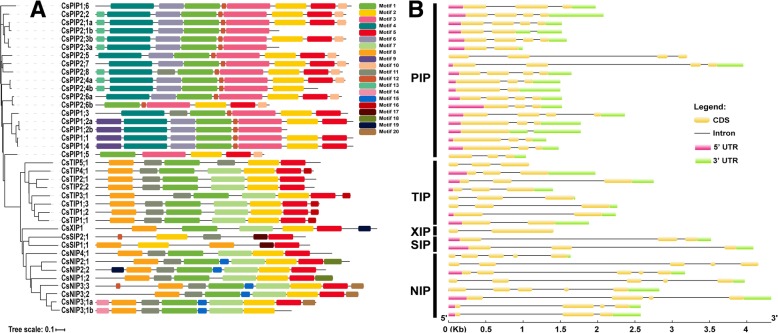
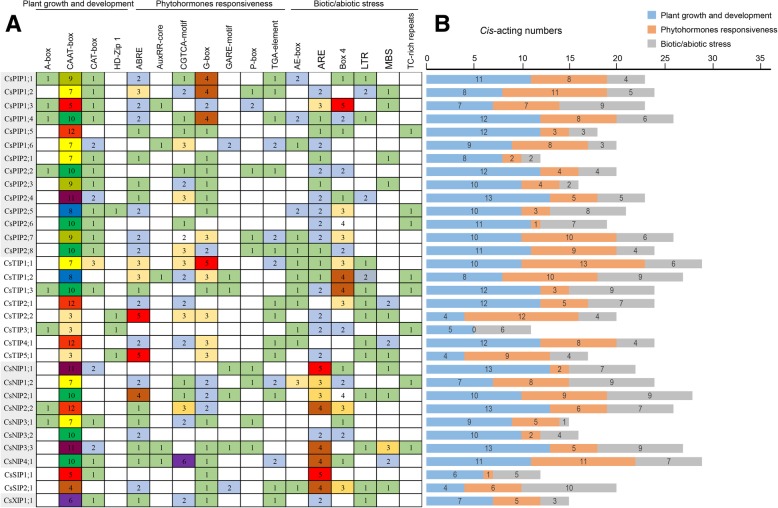
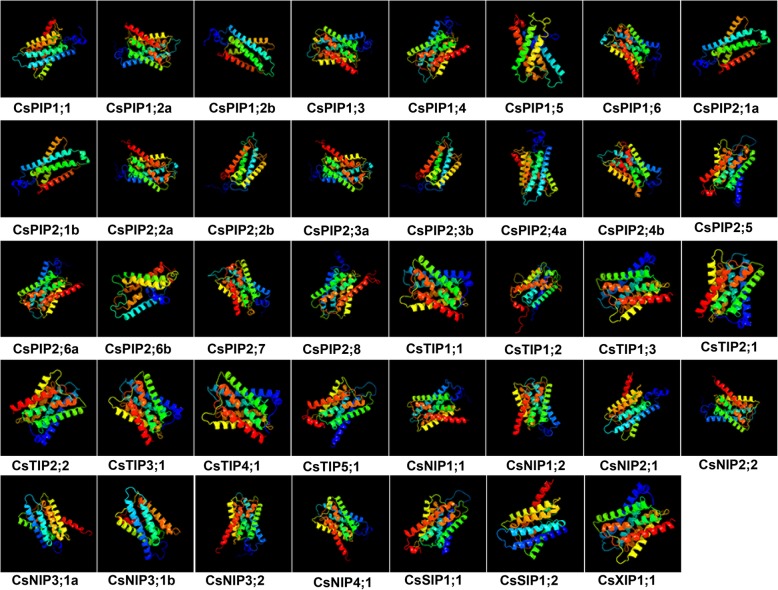
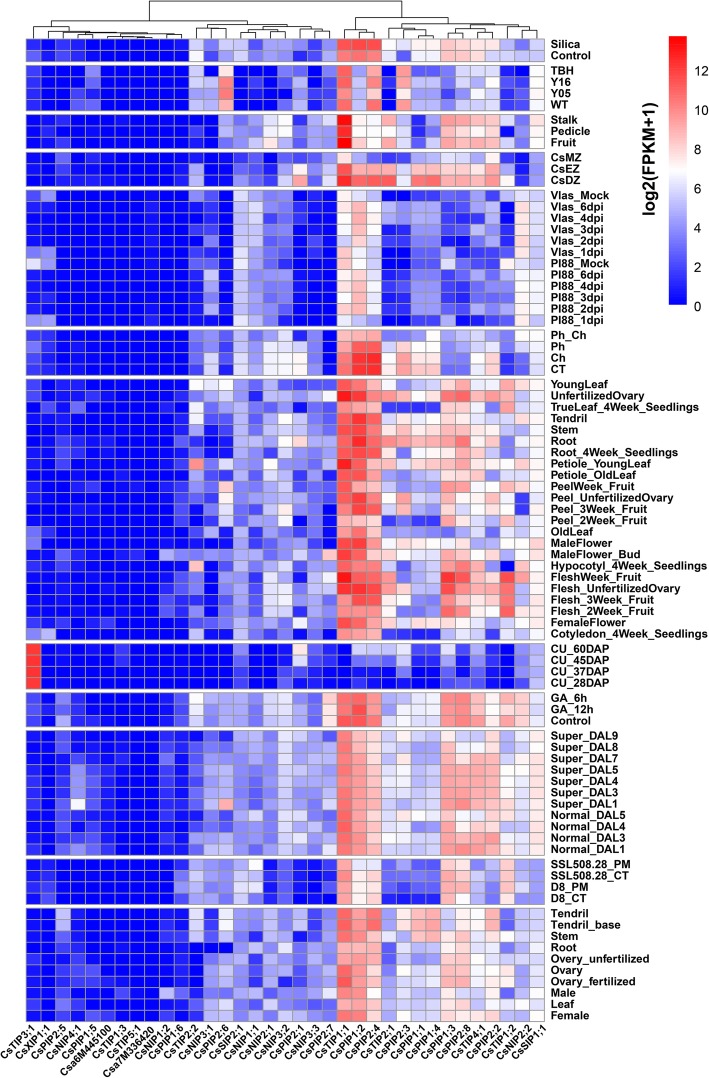
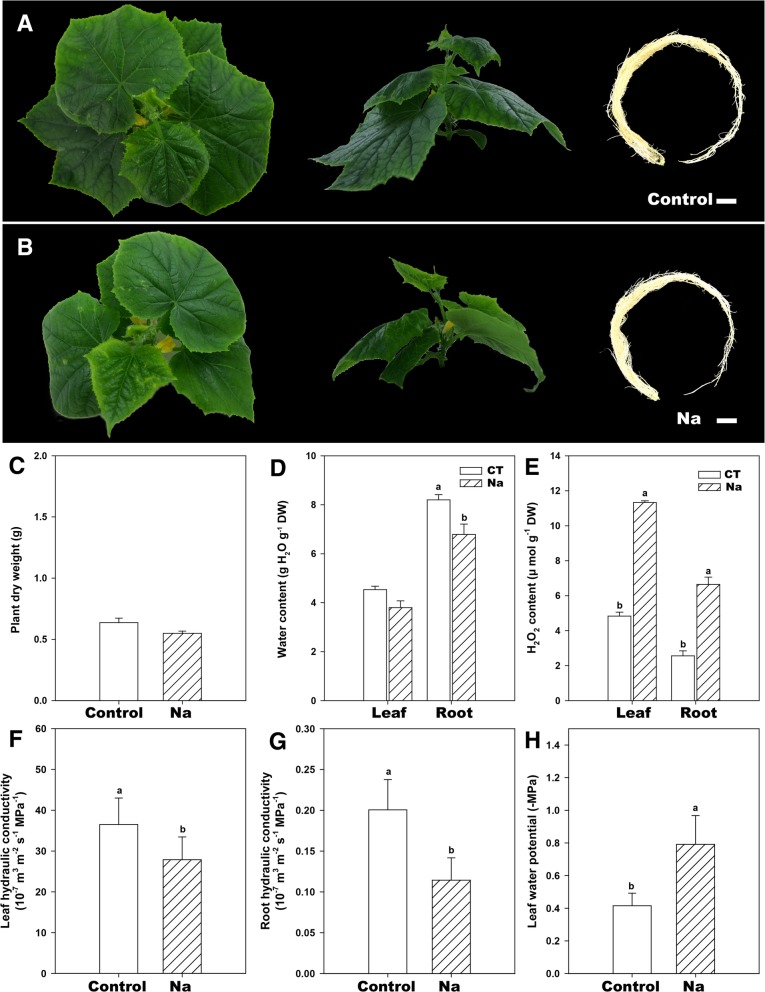
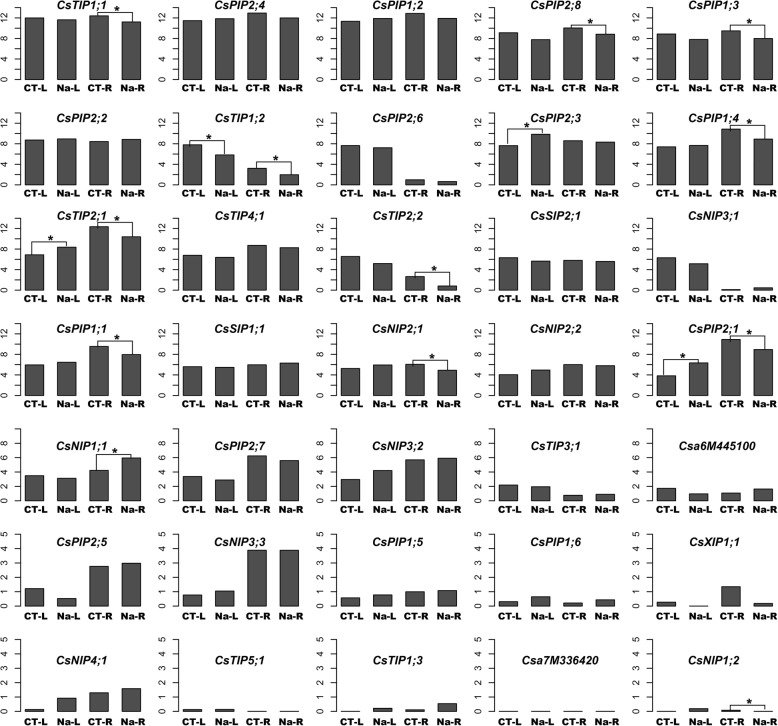
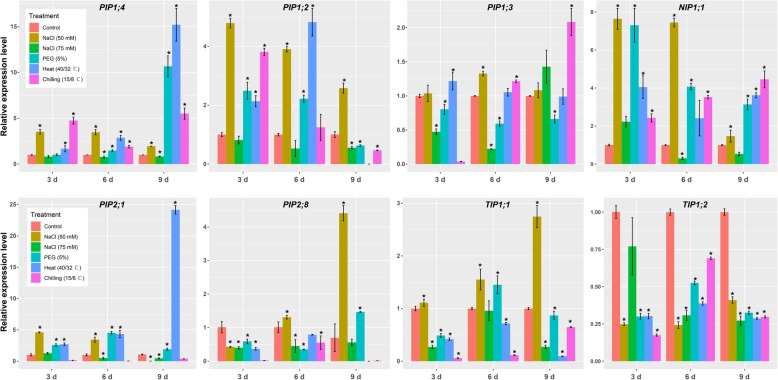
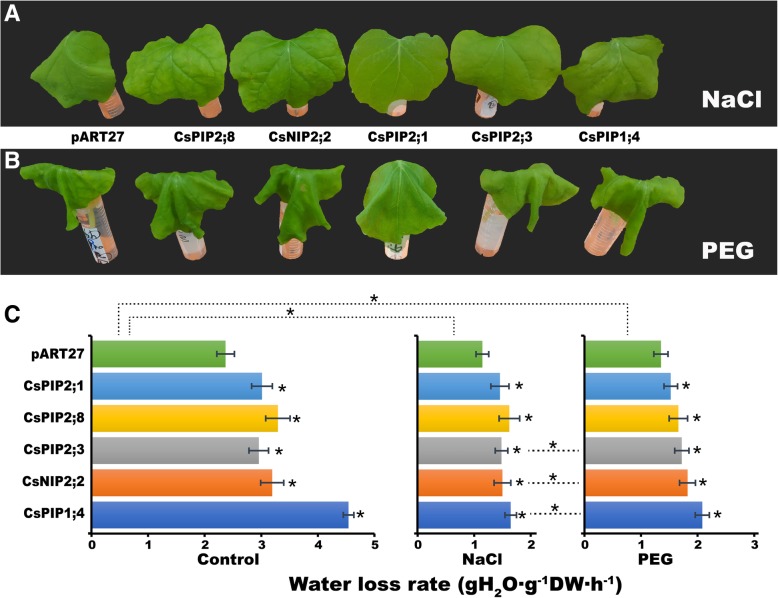
Results: In this study, we identified 39 aquaporin-encoding genes in cucumber that were separated by phylogenetic analysis into five sub-families (PIP, TIP, NIP, SIP, and XIP). Their substrate specificity was then assessed based on key amino acid residues such as the aromatic/Arginine (ar/R) selectivity filter, Froger's positions, and specificity-determining positions. The putative cis-regulatory motifs available in the promoter region of each AQP gene were analyzed and results revealed that their promoter regions contain many abiotic related cis-regulatory elements. Furthermore, analysis of previously released RNA-seq data revealed tissue- and treatment-specific expression patterns of cucumber AQP genes (CsAQPs). Three aquaporins (CsTIP1;1, CsPIP2;4, and CsPIP1;2) were the most transcript abundance genes, with CsTIP1;1 showing the highest expression levels among all aquaporins. Subcellular localization analysis in Nicotiana benthamiana epidermal cells revealed the diverse and broad array of sub-cellular localizations of CsAQPs. We then performed RNA-seq to identify the expression pattern of CsAQPs under salt stress and found a general decreased expression level of root CsAQPs. Moreover, qRT-PCR revealed rapid changes in the expression levels of CsAQPs in response to diverse abiotic stresses including salt, polyethylene glycol (PEG)-6000, heat, and chilling stresses. Additionally, transient expression of AQPs in N. benthamiana increased leaf water loss rate, suggesting their potential roles in the regulation of plant water status under stress conditions.

Conclusions: Our results indicated that CsAQPs play important roles in response to salt stress. The genome-wide identification and primary function characterization of cucumber aquaporins provides insight to elucidate the complexity of the AQP gene family and their biological functions in cucumber.

Keywords: Abiotic stresses; Gene structure; Phylogenetic analysis; Protein characterization; RNA-seq; Water loss rate.


Conflict of interest statement

The authors declare that the research was conducted in the absence of any commercial or financial relationships that could be construed as a potential conflict of interest.

Figures

Fig. 1
Fig. 1
Phylogenetic analysis of 39 aquaporins identified in cucumber. Predicted amino acid sequences were aligned using ClustalW2 and the phylogenetic tree was constructed using MEGA7.0 software with the maximum likelihood method (1000 replicates). Different colors represent different aquaporin subfamilies
Fig. 2
Fig. 2
Distribution of the aquaporin genes on 7 cucumber chromosomes. Chr1–7 represent the chromosome 1 to 7. The rule on the left indicates the physical map distance among genes (Mbp). Blue, red, brown, pink, and green colors represent for PIPs, TIPs, NIPs, SIPs, and XIP, respectively
Fig. 3
Fig. 3
Subcellular localization of CsAQPs. The free GFP (positive control), as well as the AQP:GFP fusion proteins of CsNIP2;2, CsTIP4;1, CsPIP1;1, CsPIP2;1, CsPIP2;3, CsPIP2;5, and CsPIP2;8, were transiently expressed in tobacco leaves via Agrobacterium tumefaciens strain GV3101. Subcellular localization was then observed by confocal laser scanning microscopy after 48 h from the infiltration. Scale bar = 20 μm
Fig. 4
Fig. 4
Conserved motifs of aquaporin proteins and exon-intron organization of corresponding coding genes in cucumber. a The motifs were identified by MEME tools. Twenty motifs (1–20) were indicated by different colored numbers (1–20). b Exon-Intron structure of 39 cucumber aquaporins genes. Untranslated Regions (UTRs) are represented by red and green boxes, coding regions (CDS) are shown as yellow round-corner rectangle, and introns are shown as black lines
Fig. 5
Fig. 5
Analysis of cis-acting element numbers in cucumber aquaporin genes. a The different colors and numbers of the grid indicated the numbers of different promoter elements in these aquaporin genes. b The different colored histogram represented the sum of the cis-acting elements in each category
Fig. 6
Fig. 6
Predicted 3D models of cucumber aquaporin proteins. Models were generated by using Phyre2 server. Models were visualized by rainbow color from N to C terminus. Two templates, c2w2eA and d1j4na from structures of Yeast aquaporin were used in the modelling of CsPIP sub-family. Among them, template d1j4na were used in CsPIP1;5, CsPIP2;5, and CsPIP2;6b modelling; the rest of the members were modelling with template c2w2eA (from Yeast). In the CsTIP sub-family, template c5i32A (from Arabidopsis thaliana) were used in CsTIP1;1, CsTIP1;3, CsTIP2;1; CsTIP2;2, CsTIP3;1, and CsTIP4;1 modelling; template c2w2eA (from Yeast) was used in CsTIP1;2 modelling; template d1j4na was used in CsTIP5;1 modelling. Template c2w2eA (from Yeast) were used in CsNIP sub-family members modelling. Template d1j4na was used in CsSIP1;1 modelling; template c2w2eA (from Yeast) was used in CsSIP2;1 modelling. And template c5i32A (from Arabidopsis thaliana) was used in CsXIP1;1 modelling
Fig. 7
Fig. 7
Expression pattern profiling of cucumber AQP genes. The different tissues used for expression analysis including root, leaf, seed, ovary, flower, fruit, pedicle, and stem. Experimental design: CT, control; DAP, day after pollination; DAL, the normal ovary blooms at 4–5 days after labeling (when the ovary is visible); tbh, a tiny branched hair mutant; Y05, fruit spine on fruits of 0.5 cm long; Y16, fruit spine on fruits of 1.6 cm long; WT, wild type cucumber; CsDZ, Root differentiation zone; CsEZ, Root elongation zone; CsMZ, Root meristematic zone; Ch, treated with chrysophanol; Ph, treated with physcion; GA_12h, treated with GA at 12 h; GA_6h, treated with GA at 6 h. Red indicates high concentrations, whereas low relative concentrations are deep blue. Data were normalized. Expression values are given after logarithmic transformation of RPKM (reads per kilobase of exon model per million mapped reads). All detailed information can be found in Cucurbit Genomics Database (http://cucurbitgenomics.org/organism/2)
Fig. 8
Fig. 8
Effect of salt stress in cucumber. a, b The symptoms of salt injury in cucumber exposed to 3 days salt stress. Effect of salt on (c) plant total dry weight, d water content, e H2O2 content, f, g plant hydraulic conductance and (h) leaf water potential of cucumber seedlings. These parameters were determined after 3 d of salt treatment. Data are means ± SD (n = 8 for plant total dry weight, total water content, 5 for H2O2 content, plant hydraulic conductance, and leaf water potential). Different letters in a column indicate significant differences between the treatments at p < 0.05 level
Fig. 9
Fig. 9
Regulating patterns of cucumber AQP genes in responding to salt stress. CK-L and Na-L, control and salt stressed samples of leaves; CK-R and Na-R, control and salt stressed samples of roots. Y-axis represents the expression levels of corresponding genes which indicates as log2(FPKM+1). * represents significantly differentially expressed genes (fold change ≥2, p value and FDR ≤ 0.05)
Fig. 10
Fig. 10
The expression patterns of eight CsAQPs in roots. The roots were sampled after 3, 6, and 9 days of NaCl (50 mmol, 75 mmol), PEG-induced drought, heat, and chilling treatments. The relative expression was determined by qRT-PCR. Values are mean ± SD of three replications, and each replication included two technical replications. * indicate significant differences in comparison with the control at p < 0.05, respectively
Fig. 11
Fig. 11
Overexpression of AQPs transiently affected water loss rate in tobacco leaves. Phenotype of detached leaves after 6 h of (a) NaCl and (b) PEG treatments; (c) The water loss rate of detached leaves after 6 h of NaCl, and PEG treatments. In (c), asterisks in the left (CK), middle (NaCl), and right (PEG) panels indicate statistically significant differences of each gene compared to pART27. Asterisks above left (CK), middle (NaCl), and right (PEG) panels indicate statistically significant differences of each gene in NaCl or PEG treatment compared to that in CK. Asterisks between middle (NaCl), and right (PEG) panels indicate statistically significant differences of each gene between NaCl and PEG treatments. Data are means ± SE of n = 3 biological replicates, at least 10 leaves per replicate. * indicates significance, p < 0.05 as determined using the Student’s t-test

References

    1. Yin J, Jia J, Lian Z, Hu Y, Guo J, Huo H, Zhu Y, Gong H. Silicon enhances the salt tolerance of cucumber through increasing polyamine accumulation and decreasing oxidative damage. Ecotox Environ Safe. 2019;169:8–17. - PubMed
    1. Aroca R, Porcel R, Ruiz-Lozano JM. Regulation of root water uptake under abiotic stress conditions. J Exp Bot. 2011;63(1):43–57. - PubMed
    1. Zhu Y, Gong H, Yin J. Role of silicon in mediating salt tolerance in plants: a review. Plants. 2019;8:147. - PMC - PubMed
    1. Johansson I, Karlsson M, Johanson U, Larsson C, Kjellbom P. The role of aquaporins in cellular and whole plant water balance. Biochim Biophys Acta. 2000;1465(1–2):324–342. - PubMed
    1. Fox AR, Maistriaux LC, Chaumont F. Toward understanding of the high number of plant aquaporin isoforms and multiple regulation mechanisms. Plant Sci. 2017;264:179–187. - PubMed