. 2019 Aug 7;7(1):210.
doi: 10.1186/s40425-019-0691-0.

miR-448 targets IDO1 and regulates CD8+ T cell response in human colon cancer

Affiliations

miR-448 targets IDO1 and regulates CD8+ T cell response in human colon cancer

Qiong Lou et al. J Immunother Cancer. .

Abstract

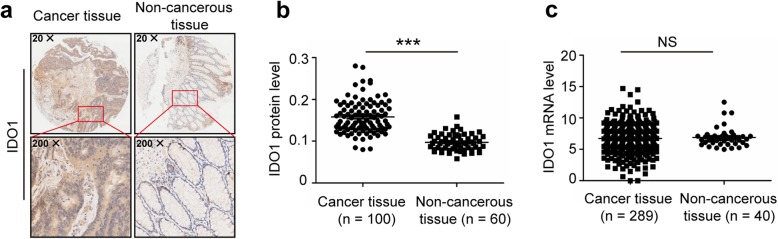
Background: Indoleamine 2,3-dioxygenase 1 (IDO1) is a critical regulator of T cell function, contributing to immune tolerance. Upregulation of IDO1 has been found in many cancer types; however, the regulatory mechanisms and clinical significance of IDO1 in colon cancer are still unclear. Here, we investigated the role of dysregulated microRNA (miRNA) targeting IDO1 in the colon cancer microenvironment.

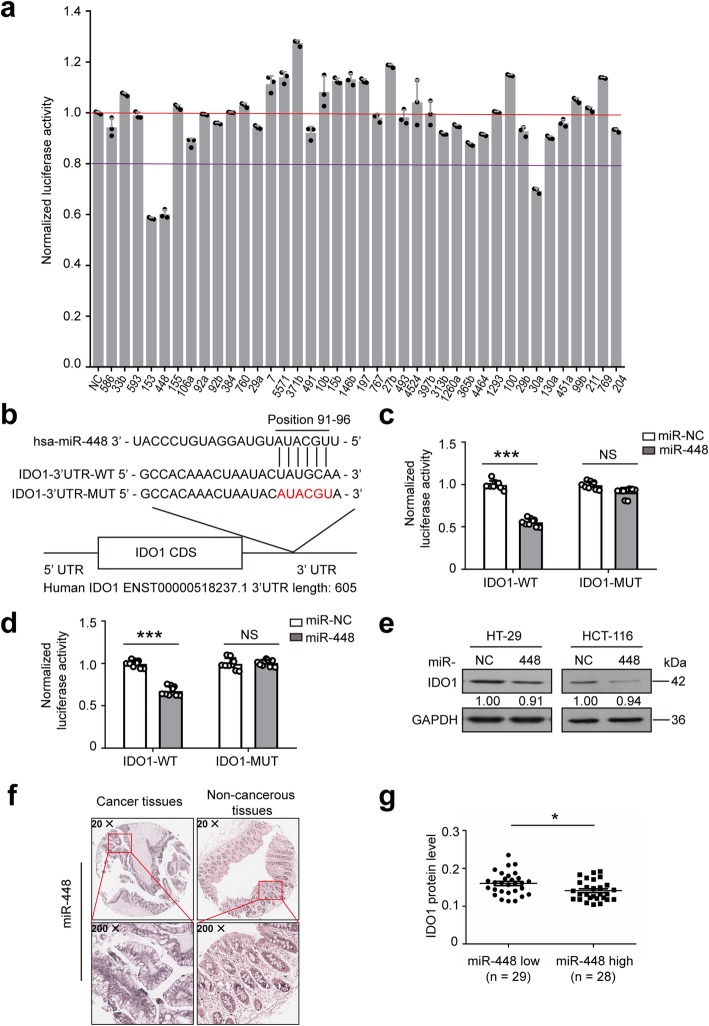
Methods: We elucidated IDO1 function by performing cell-based assays and establishing transplanted tumor models in BALB/c mice and BALB/c nude mice. We evaluated IDO1 protein expression by immunohistochemistry (IHC) in a tissue microarray (TMA) and analyzed IDO1 mRNA expression with The Cancer Genome Atlas (TCGA). We screened miRNAs targeting IDO1 by using a dual luciferase reporter assay. We tested the function of microRNA-448 (miR-448) by using western blotting (WB) and fluorescence-activated cell sorting (FACS).

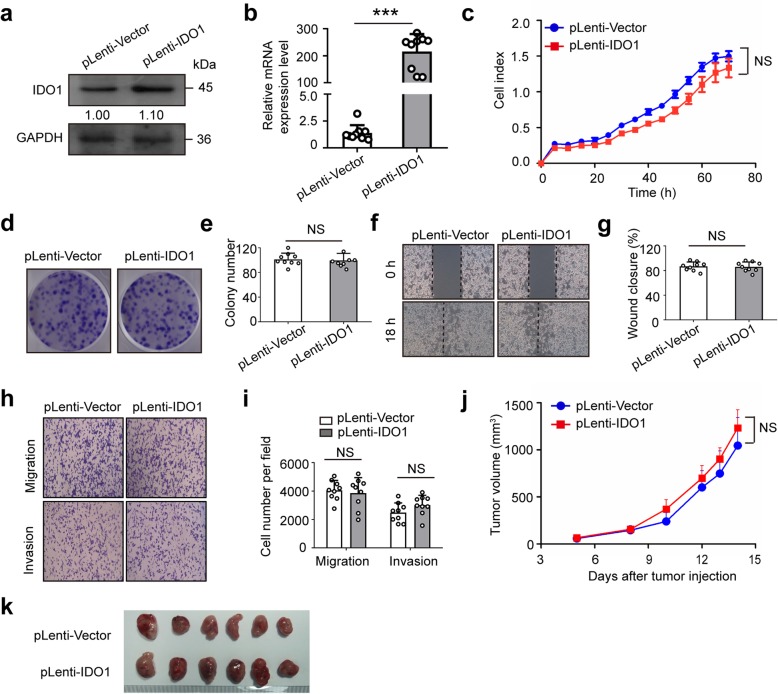
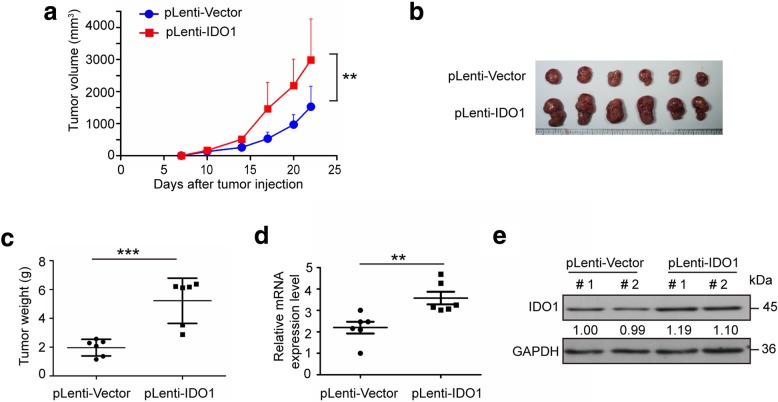
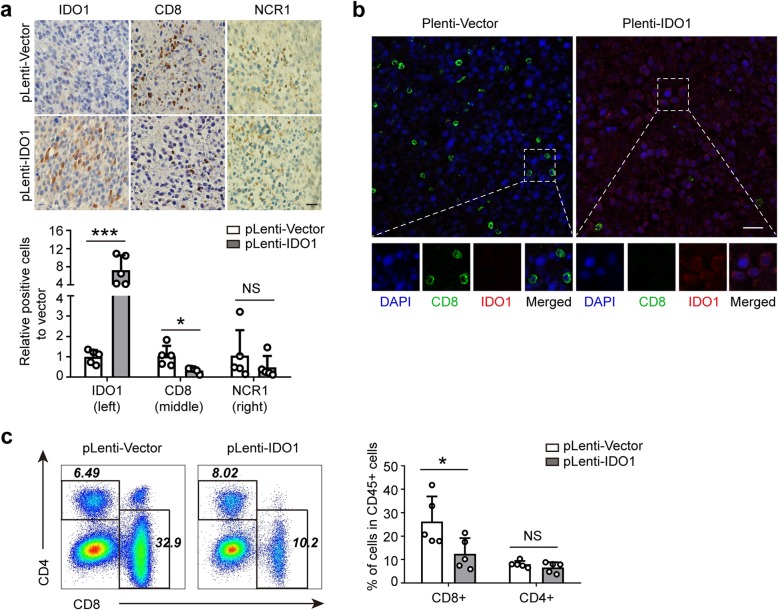
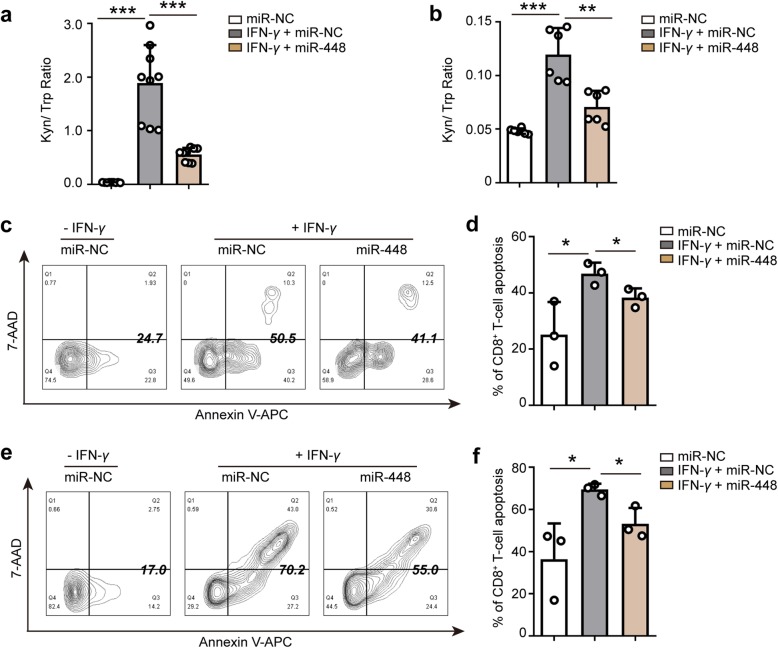
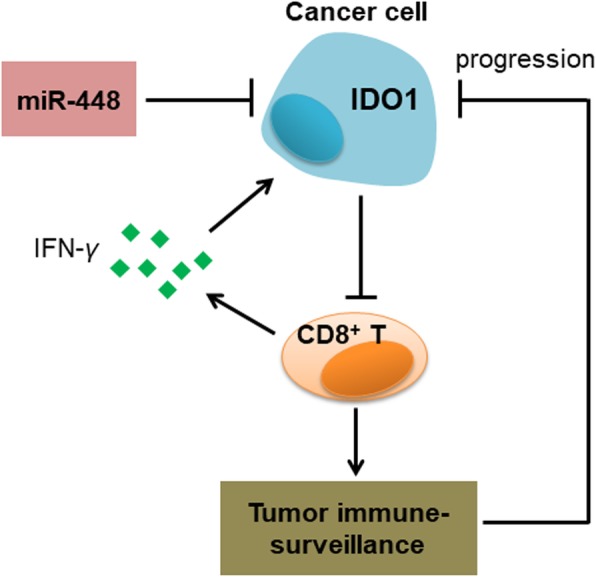
Results: We demonstrated that stable IDO1 overexpression enhanced xenograft tumor growth in BALB/c mice but not in BALB/c nude mice. We also revealed the involvement of posttranscriptional regulation of IDO1 in colon cancer by observing IDO1 protein levels and mRNA levels. Furthermore, ectopic expression of miRNA mimics suggested that miR-448 could significantly downregulate IDO1 protein expression. Notably, we proved that miR-448 suppressed the apoptosis of CD8+ T cells by suppressing IDO1 enzyme function.

Conclusion: Our findings indicated that IDO1 suppressed the CD8+ T cell response in colon cancer. miR-448, as a tumor-suppressive miRNA, enhanced the CD8+ T cell response by inhibiting IDO1 expression. The results provide a theoretical basis for the development of new immunotherapy for the treatment of colon cancer.

Keywords: CD8; Colon cancer; IDO1; Immunology; Tumor microenvironment; miR-448.


Conflict of interest statement

The authors declare that they have no competing interests.

Figures

Fig. 1
Fig. 1
IDO1 overexpression has no effect on the migration, invasion and proliferation of CT26 cells. a Representative western blots and b qRT-PCR results of IDO1 in CT26 cells from the stable IDO1 overexpression (pLenti-IDO1) group and the vector control (pLenti-Vector) group. GAPDH was served as the internal control. c Representative pictures of real-time proliferation assay in CT26 cells from the pLenti-IDO1 group and the pLenti-Vector group. d Representative pictures and e quantitative data of colony formation assay in CT26 cells from the pLenti-IDO1 group and the pLenti-Vector group. f Representative pictures and g quantitative data of wound healing assay in CT26 cells from the pLenti-IDO1 group and the pLenti-Vector group. h Representative pictures and i quantitative data of transwell assay in CT26 cells from the pLenti-IDO1 group and the pLenti-Vector group. a, c, d, f, h Images are representative of three biological replicates. j Average growth curves of subcutaneous xenograft tumors in BALB/c nude mice after inoculation of CT26 cells with pLenti-IDO1 or with pLenti-Vector. k Representative pictures of tumors in BALB/c nude mice from the pLenti-IDO1 group and the pLenti-Vector group. b, c, e, g, i, j Mean ± SEM. b, e, g, i n = 9 measurements from three biological replicates performed in triplicate; c n = 3; j, k n = 6. b, c, e, g, i Two-tailed Student’s t-test and j one-way ANOVA were performed for statistical analysis; ***P < 0.001, NS: not significant
Fig. 2
Fig. 2
Stable IDO1 overexpression enhances xenograft tumor growth in BALB/c mice. a Average growth curves of subcutaneous xenograft tumors in BALB/c mice after inoculation of CT26 cells with stable IDO1 overexpression (pLenti-IDO1) or with vector control (pLenti-Vector). b Representative pictures of tumors in BALB/c mice from the pLenti-IDO1 group and the pLenti-Vector group. c Tumor weight in mice from the pLenti-IDO1 group and the pLenti-Vector group. d qRT-PCR results and e representative western blots of IDO1 in subcutaneous tumor tissues from the pLenti-IDO1 group and the pLenti-Vector group. # 1 and # 2 represents tumor tissues from different mice. Images are representative of three biological replicates. a Mean ± SEM; c, d mean ± SD. a-d n = 6. a One-way ANOVA and c, d two-tailed Student’s t-test were performed for statistical analysis; **P < 0.01, ***P < 0.001
Fig. 3
Fig. 3
IDO1 suppresses the CD8+ T cell response in subcutaneous tumor tissue. a Immunohistochemical staining for IDO1, CD8 and NCR1 in sections of mouse tumor tissues from the pLenti-IDO1 group and the pLenti-Vector group. Top, representative pictures; bottom, quantitative data. Data represent the relative percentage of IDO1+, CD8+ and NCR1+ cells in the pLenti-IDO1 group to that in the pLenti-Vector group. Scale bars: 20 μm. b Representative pictures of immunofluorescent staining for IDO1 expression tumor cells and infiltrating CD8+ lymphocytes in sections of mouse tumor tissues from the pLenti-IDO1 group and the pLenti-Vector group. Blue, DAPI staining; red, IDO1 staining; green, CD8 staining. Scale bars: 20 μm. c FACS analysis of CD8+ T cells and CD4+ T cells in CD45+ cells of mice tumor tissues in the pLenti-IDO1 group and pLenti-Vector group. Left, representative pictures; right, quantitative data. a Mean ± SEM; c mean ± SD. a-c n = 5. a, c Two-tailed Student’s t-test was performed for statistical analysis; *P < 0.05, ***P < 0.001, NS: not significant
Fig. 4
Fig. 4
The protein and mRNA expression patterns of IDO1 are different in human colon cancer. a Representative IHC staining of IDO1 in human colon cancer tissues and adjacent noncancerous tissues. b IDO1 protein expression of 100 colon cancer tissues and 60 adjacent noncancerous tissues by IHC in a tissue microarray. The data were quantified by measuring the mean density of all the DAB stained areas of each micrograph using Image-Pro Plus 6.0 software, and the Y-axis for “IDO1 protein level” represents the mean density of DAB staining (integral optical density (IOD) / area of interest (AOI)). c IDO1 mRNA expression between 289 colon cancer tissues and 40 adjacent noncancerous tissues. The data were downloaded from TCGA. b, c Two-tailed Student’s t-test was performed for statistical analysis; ***P < 0.001, NS: not significant
Fig. 5
Fig. 5
miR-448 downregulates IDO1 expression. a Luciferase reporter containing wild-type (WT) IDO1 3′ UTR was cotransfected with 40 miRNA mimics or a negative control (NC) into HCT-116 cells. Relative firefly luciferase expression was normalized to Renilla luciferase. NC: miRNA mimic negative control, 586: miRNA-586 mimic, etc. b The binding site of miR-448 in the IDO1 mRNA. The relative luciferase activity in c HT-29 cells and d HCT-116 cells cotransfected with miR-448 mimics and IDO1-WT, or cotransfected with miR-448 mimics and IDO1-MUT. e Representative western blots of IDO1 in HT-29 and HCT-116 cells transfected with miR-NC or miR-448 followed by IFN-γ treatment. GAPDH was served as the internal control. Images are representative of three biological replicates. f Representative ISH staining of miR-448 in human colon cancer tissues and adjacent noncancerous tissues. g IDO1 protein expression in miR-448low group (n = 29) and miR-448high group (n = 28). miR-448low group and miR-448high group were divided according to the ratio of miR-448 expression in colon cancer tissues to that in adjacent noncancerous tissues (cut-off = 1.33). a Mean ± SD; c, d, g mean ± SEM. c, d n = 9 measurements from three biological replicates performed in triplicate. a, c, d, g Two-tailed Student’s t-test was performed for statistical analysis; *P < 0.05, ***P < 0.001, NS: not significant. miR-NC: miRNA mimic negative control; miR-448: miRNA-448 mimic
Fig. 6
Fig. 6
miR-448 enhances the survival of CD8+ T cells by suppressing IDO1 function. The Kyn/Trp ratio was analyzed in the culture medium from a HT-29 and b HCT-116 transfected with miR-NC, or transfected with miR-NC followed by IFN-γ treatment, or transfected with miR-448 followed by IFN-γ treatment. The concentration of Kyn and Trp were determined by HPLC and the Kyn/Trp ratio was calculated. c, e Representative contour plots and d, f apoptosis quantification of FACS analysis for the percentage of apoptotic CD8+ T cells in miR-NC, miR-NC + IFN-γ, miR-448 + IFN-γ conditional medium systems from c, d HT-29 and e, f HCT-116 supernatant. a, b, d, f Mean ± SEM. a n = 9 measurements from three biological replicates performed in triplicate; b n = 6 measurements from two biological replicates performed in triplicate; c-f n = 3 biologically independent experiments. a, b, d, f Two-tailed Student’s t-test was performed for statistical analysis; *P < 0.05, **P < 0.01, ***P < 0.001. miR-NC: miRNA mimic negative control; miR-448: miRNA-448 mimic
Fig. 7
Fig. 7
A possible negative feedback loop to regulate CD8+ T cell activation. Upregulation of IDO1 occurs in tumors in response to IFN-γ, which is secreted by activated CD8+ T cells, while the expression of IDO1 is increased, CD8+ T cell response will be suppressed, resulting in tumor immune evasion and tumor growth. However, miR-448 downregulates IDO1 protein expression, and the feedback of IDO1 to CD8+ T cells will be impaired. Thus, the number of CD8+ T cells in the tumor microenvironment will be increased, resulting in tumor rejection

References

    1. Bray F, Ferlay J, Soerjomataram I, Siegel RL, Torre LA, Jemal A. Global Cancer Statistics 2018: GLOBOCAN estimates of incidence and mortality worldwide for 36 cancers in 185 countries. CA Cancer J Clin. 2018;68:394–424. doi: 10.3322/caac.21492. - DOI - PubMed
    1. Zou W. Immunosuppressive networks in the tumour environment and their therapeutic relevance. Nat Rev Cancer. 2005;5(4):263–274. doi: 10.1038/nrc1586. - DOI - PubMed
    1. Singh PP, Sharma PK, Krishnan G, Lockhart AC. Immune checkpoints and immunotherapy for colorectal cancer. Gastroenterol Rep. 2015;3(4):289–297. - PMC - PubMed
    1. Kalyan A, Kircher S, Shah H, Mulcahy M, Benson A. Updates on immunotherapy for colorectal cancer. J Gastrointest Oncol. 2018;9(1):160–169. doi: 10.21037/jgo.2018.01.17. - DOI - PMC - PubMed
    1. Chen DS, Mellman I. Elements of cancer immunity and the cancer-immune set point. Nature. 2017;541(7637):321–330. doi: 10.1038/nature21349. - DOI - PubMed

Publication types

MeSH terms