. 2019 Aug 20;116(34):16961-16970.
doi: 10.1073/pnas.1902596116. Epub 2019 Aug 7.

Epithelial delamination is protective during pharmaceutical-induced enteropathy

Affiliations

Epithelial delamination is protective during pharmaceutical-induced enteropathy

Scott T Espenschied et al. Proc Natl Acad Sci U S A. .

Abstract

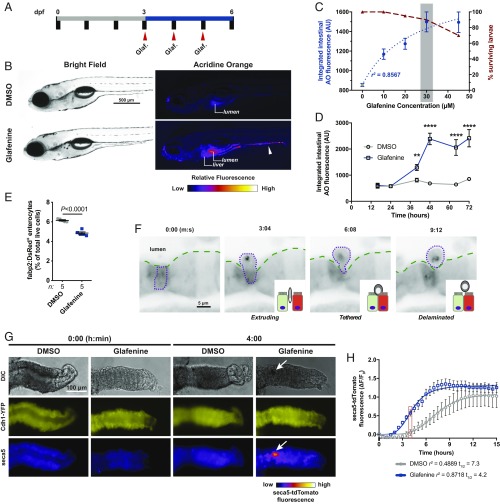
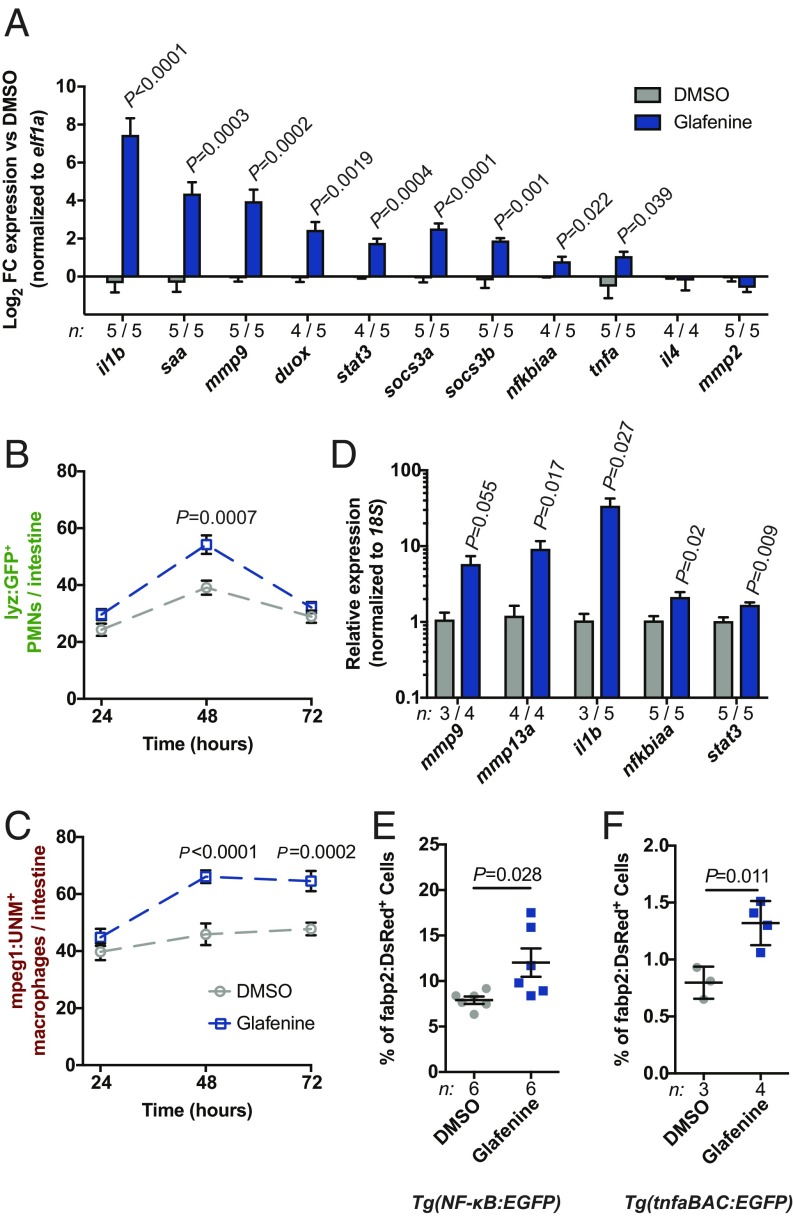
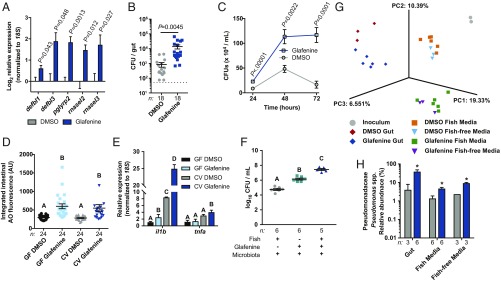
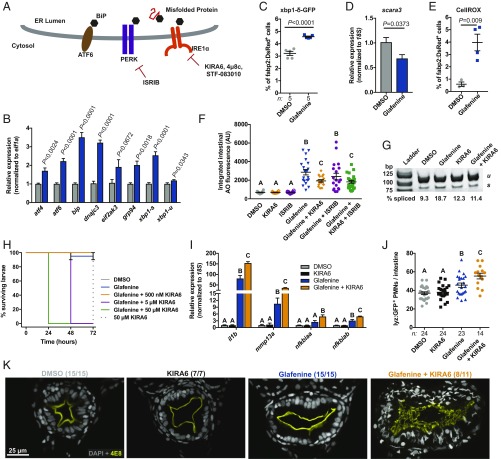
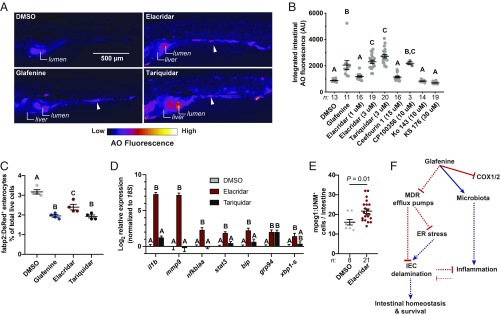
Intestinal epithelial cell (IEC) shedding is a fundamental response to intestinal damage, yet underlying mechanisms and functions have been difficult to define. Here we model chronic intestinal damage in zebrafish larvae using the nonsteroidal antiinflammatory drug (NSAID) Glafenine. Glafenine induced the unfolded protein response (UPR) and inflammatory pathways in IECs, leading to delamination. Glafenine-induced inflammation was augmented by microbial colonization and associated with changes in intestinal and environmental microbiotas. IEC shedding was a UPR-dependent protective response to Glafenine that restricts inflammation and promotes animal survival. Other NSAIDs did not induce IEC delamination; however, Glafenine also displays off-target inhibition of multidrug resistance (MDR) efflux pumps. We found a subset of MDR inhibitors also induced IEC delamination, implicating MDR efflux pumps as cellular targets underlying Glafenine-induced enteropathy. These results implicate IEC delamination as a protective UPR-mediated response to chemical injury, and uncover an essential role for MDR efflux pumps in intestinal homeostasis.

Keywords: MDR efflux pump; NSAID; intestine; microbiota; zebrafish.


Conflict of interest statement

The authors declare no conflict of interest.

Figures

Fig. 1.
Fig. 1.
Serial Glafenine exposure results in IEC delamination. (A) Schematic of dosing regimen used for serial Glafenine (Glaf.) exposure. (B) Representative brightfield and AO fluorescence images of 6 dpf DMSO- and Glafenine-treated larvae (arrowhead points to AO+ material in the intestinal lumen). (C) Glafenine dose–response for quantified intestinal AO fluorescence (left y axis, blue, 3-parameter least-squares fit) and survival (right y axis, maroon). (D) Kinetics of intestinal AO response with 30 μM Glafenine (n = 20 larvae per condition per time point; significance was determined between treatment groups within each time point by unpaired 2-sided Student’s t test; **P < 0.01, ****P < 0.0001). (E) Flow cytometry analysis of relative abundance of viable (7-AAD) Tg(fabp2:DsRed)+ enterocytes from DMSO- and Glafenine-treated larvae (each point is a pool of 20 larvae; significance was determined in by unpaired 2-sided Student’s t test). (F) Sequential frames from live confocal imaging of Tg(fabp2:DsRed) larvae at 40 h into the treatment regimen. (G) Representative images of dissected larval zebrafish intestines exposed to DMSO or Glafenine ex vivo at 0 and 4 h (arrow points to mass of apoptotic cells in the intestinal lumen). (H) Quantification of seca5-tdTomato fluorescence in larval intestinal explants (n = 6 DMSO-treated and 5 Glafenine-treated intestines; 4-parameter least-squares fit; comparison of t1/2: P = 0.0002 [extra sum-of-squares F test]).
Fig. 2.
Fig. 2.
Serial Glafenine exposure results in intestinal inflammation. (A) qRT-PCR analysis of proinflammatory mRNAs from dissected digestive tissues of Glafenine- and DMSO-treated larvae (20 larval intestines per replicate; significance determined by unpaired 2-sided Student’s t test). (B and C) Quantification of intestine-associated PMNs (lyz:GFP+ cells, B) and macrophages (mpeg1:UNM+ cells, C)) (n = 20 larvae per condition per time point, statistical comparisons were performed between treatment conditions at individual time points; significance determined by unpaired 2-sided Student’s t test). (DF) qRT-PCR analysis of FACS-isolated fabp2:DsRed+ enterocytes (D), and flow cytometry analysis of NFκB:EGFP (E) and tnfa:EGFP (F) reporter activity in fabp2:DsRed+ enterocytes (cells isolated from replicate pools of 20 larvae; significance determined by unpaired 2-sided Student’s t test).
Fig. 3.
Fig. 3.
Glafenine treatment alters the intestinal and environmental microbiotas. (A) qRT-PCR analysis of dissected digestive tracts from 6 dpf DMSO- and Glafenine-treated larvae for mRNAs encoding antimicrobial peptides (significance determined by unpaired 2-sided Student’s t test). (B and C) Quantification of culturable bacteria from dissected digestive tracts and media (in C, statistical comparisons performed between treatment groups at individual time points; significance determined by unpaired 2-sided Student’s t test). (D) Quantification of intestinal AO staining in GF and CV DMSO- and Glafenine-treated larvae (significance determined by 2-way ANOVA; letters indicate significantly different groups). (E) qRT-PCR analysis of dissected digestive tracts. (F) Media bacterial load at 72 h from the indicated groups. (G) Principal coordinates analysis of Jaccard β-diversity. (H) Relative abundance of Pseudomonas spp. from the indicated samples (significance was determined with LEfSe; asterisk indicates log10 LDA > 4.5). For E and F, significance was determined by 1-way ANOVA with Tukey’s multiple-comparison test; letters indicate groups determined to be statistically different. CFU, colony-forming unit.
Fig. 4.
Fig. 4.
Ire1α mediates Glafenine-induced IEC delamination to restrict inflammation and mortality. (A) Schematic of UPR sensors and small-molecule antagonists. (B) qRT-PCR analysis of UPR target gene expression in isolated fabp2:DsRed+ enterocytes (n = 5 replicates per group; significance determined by unpaired 2-sided Student’s t test). (C) Flow cytometry analysis for percent xbp1-δ-GFP+ of fabp2:DsRed+ cells (n = 4 replicates per condition, ≥5,000 cells per replicate; significance determined by unpaired 2-sided Student’s t test). (D) scara3 expression in isolated fabp2:DsRed+ enterocytes (n = 4 replicates per group; ≥5,000 cells per replicate; significance determined by unpaired 2-sided Student’s t test). (E) Proportion CellROX+ of fabp2:DsRed+ enterocytes (determined by flow cytometry; n = 4 replicates per group; ≥5,000 cells per replicate; significance determined by unpaired 2-sided Student’s t test). (F) Intestinal AO quantification from larvae treated with Glafenine or UPR inhibitors. (G) xbp1 splicing assay from fabp2:DsRed+ enterocytes isolated from larvae treated as indicated. (H) qRT-PCR analysis of inflammatory mRNAs in fabp2:DsRed+ enterocytes isolated from larvae treated as indicated (n = 3 replicates for DMSO and KIRA6, 4 replicates for Glafenine and Glafenine+KIRA6). (I) Quantification of intestine-associated lyz:GFP+ PMNs. (J) Survival of larvae treated as indicated. (K) Representative confocal micrographs of transverse sections from larvae of the specified treatment groups immunostained with the brush border reactive antibody 4E8. For F, H, and I, significance was determined by 1-way ANOVA with Tukey’s multiple comparison test; letters indicate groups determined to be statistically different.
Fig. 5.
Fig. 5.
A subset of MDR efflux pump inhibitors phenocopy the effects of Glafenine. (A) Representative fluorescence images of AO-stained larvae from the indicated treatment groups (arrowheads indicate AO+ material in the intestinal lumen). (B) Intestinal AO quantification for larvae treated with DMSO, Glafenine, or the indicated MDR inhibitors (each dot corresponds to an individual larva; significance determined by 1-way ANOVA with Tukey’s multiple comparison test). (C) Relative abundance of fabp2:DsRed+ enterocytes from (n = 4 replicates group, 20 larvae per replicate). (D) qRT-PCR analysis of inflammatory and UPR mRNAs (n = 4 replicates per condition, ≥5,000 cells per replicate). (E) Quantification of intestine associated macrophages (mpeg1+ cells) from DMSO- and Elacridar-treated larvae (each point corresponds to an individual larva; significance determined by unpaired 2-sided Student’s t test). For B, C, and D, significance was determined by 1-way ANOVA with Tukey’s multiple comparisons test; letters indicate groups determined to be statistically different. (F) Proposed model of Glafenine-induced intestinal toxicity (solid lines indicated experimentally confirmed direct interactions, while dashed lines indicate relationships that may be indirect).

References

    1. Delgado M. E., Grabinger T., Brunner T., Cell death at the intestinal epithelial front line. FEBS J. 283, 2701–2719 (2016). - PubMed
    1. Bisanz J. E., Spanogiannopoulos P., Pieper L. M., Bustion A. E., Turnbaugh P. J., How to determine the role of the microbiome in drug disposition. Drug Metab. Dispos. 46, 1588–1595 (2018). - PMC - PubMed
    1. Spanogiannopoulos P., Bess E. N., Carmody R. N., Turnbaugh P. J., The microbial pharmacists within us: A metagenomic view of xenobiotic metabolism. Nat. Rev. Microbiol. 14, 273–287 (2016). - PMC - PubMed
    1. Zhou F., et al. , Toward a new age of cellular pharmacokinetics in drug discovery. Drug Metab. Rev. 43, 335–345 (2011). - PubMed
    1. Vasiliou V., Vasiliou K., Nebert D. W., Human ATP-binding cassette (ABC) transporter family. Hum. Genomics 3, 281–290 (2009). - PMC - PubMed

Publication types

MeSH terms

Substances

LinkOut - more resources