. 2019 Aug 7;11(504):eaau4972.
doi: 10.1126/scitranslmed.aau4972.

Targeting pyrimidine synthesis accentuates molecular therapy response in glioblastoma stem cells

Affiliations

Targeting pyrimidine synthesis accentuates molecular therapy response in glioblastoma stem cells

Xiuxing Wang et al. Sci Transl Med. .

Abstract

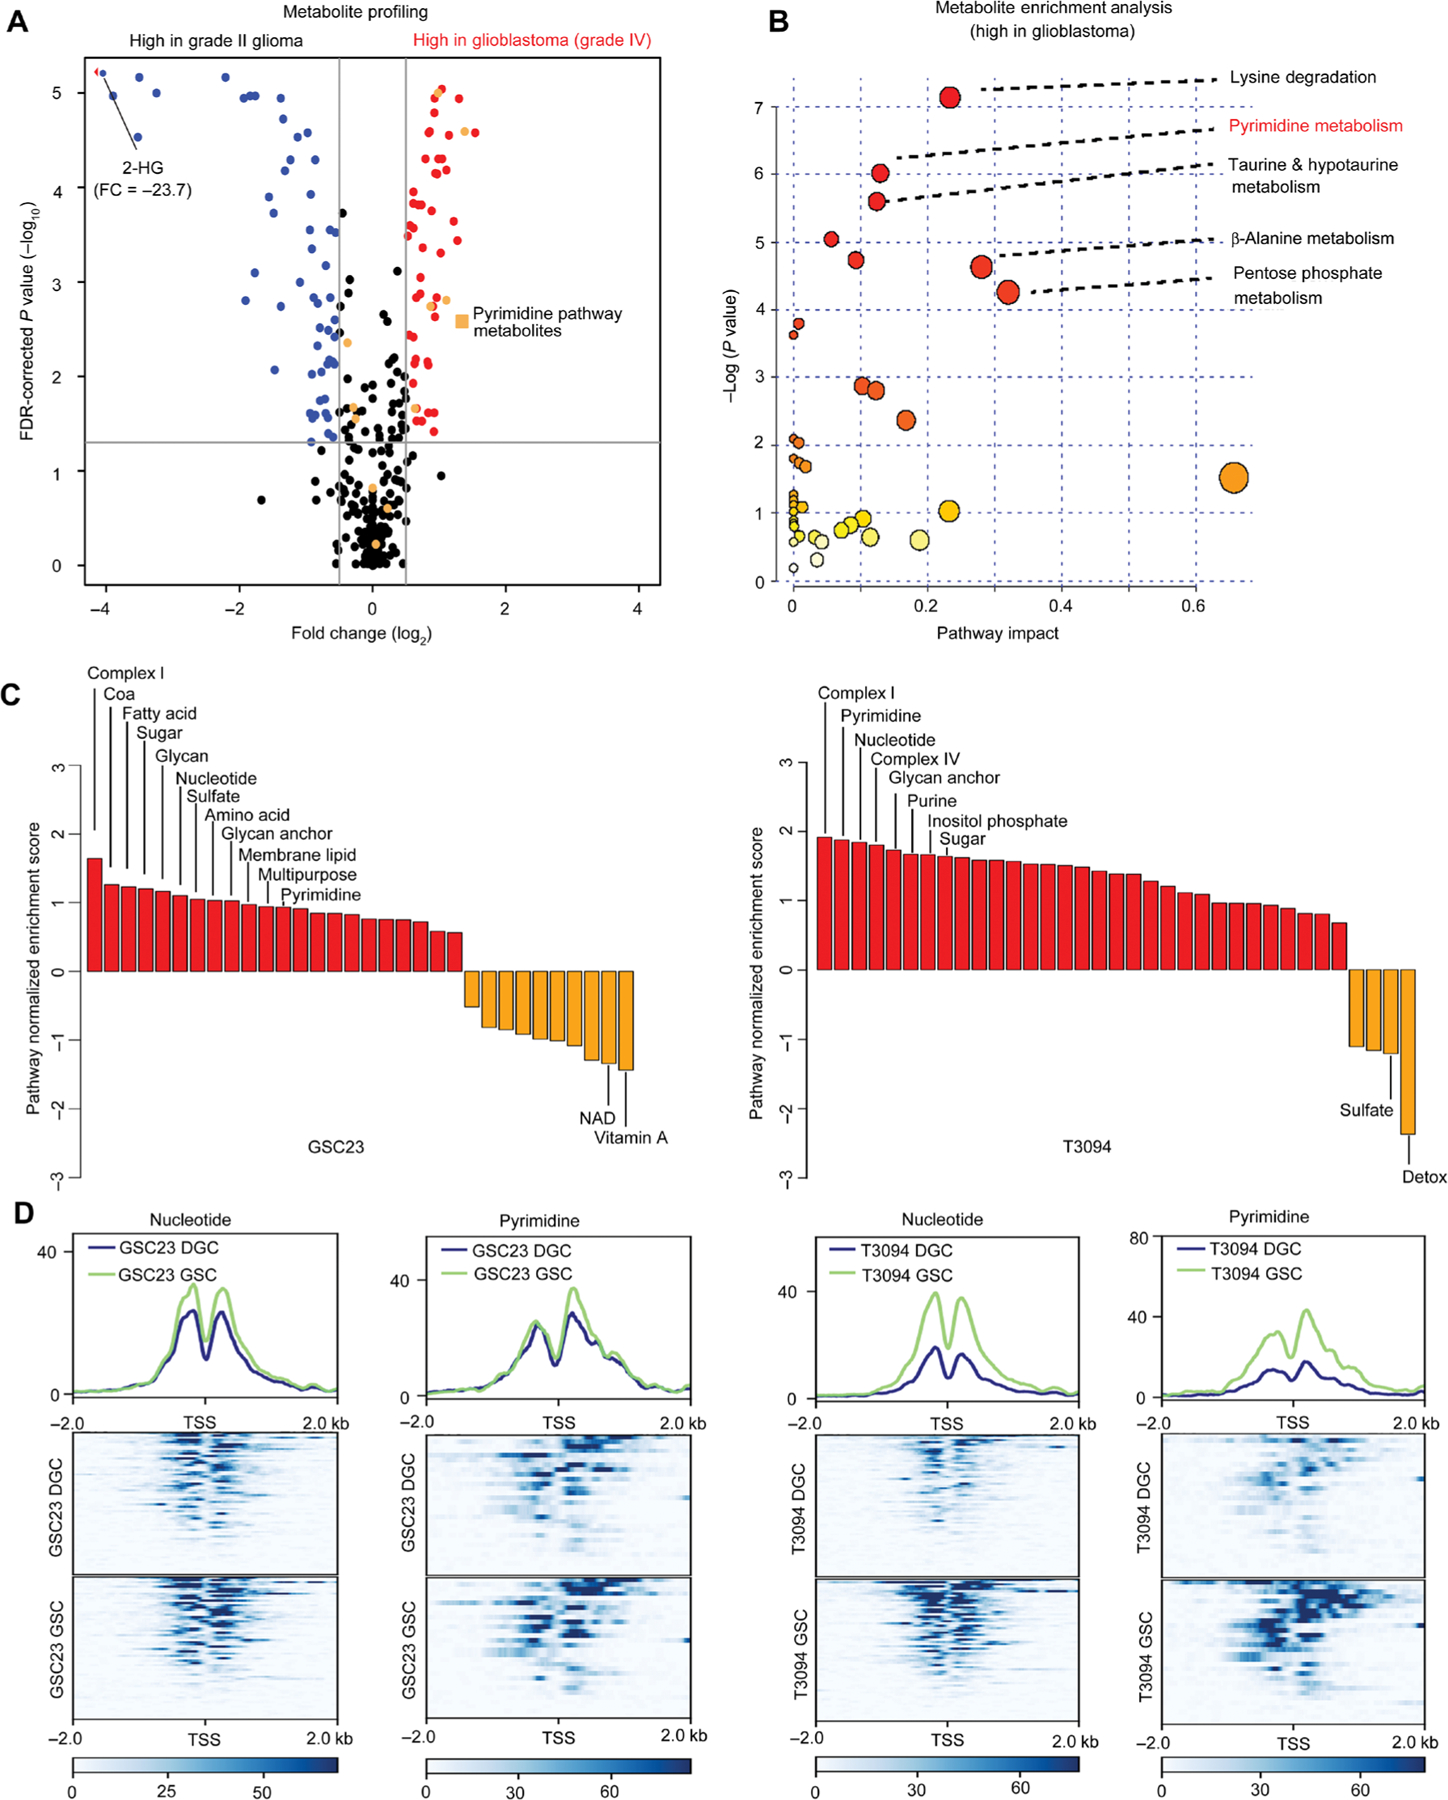
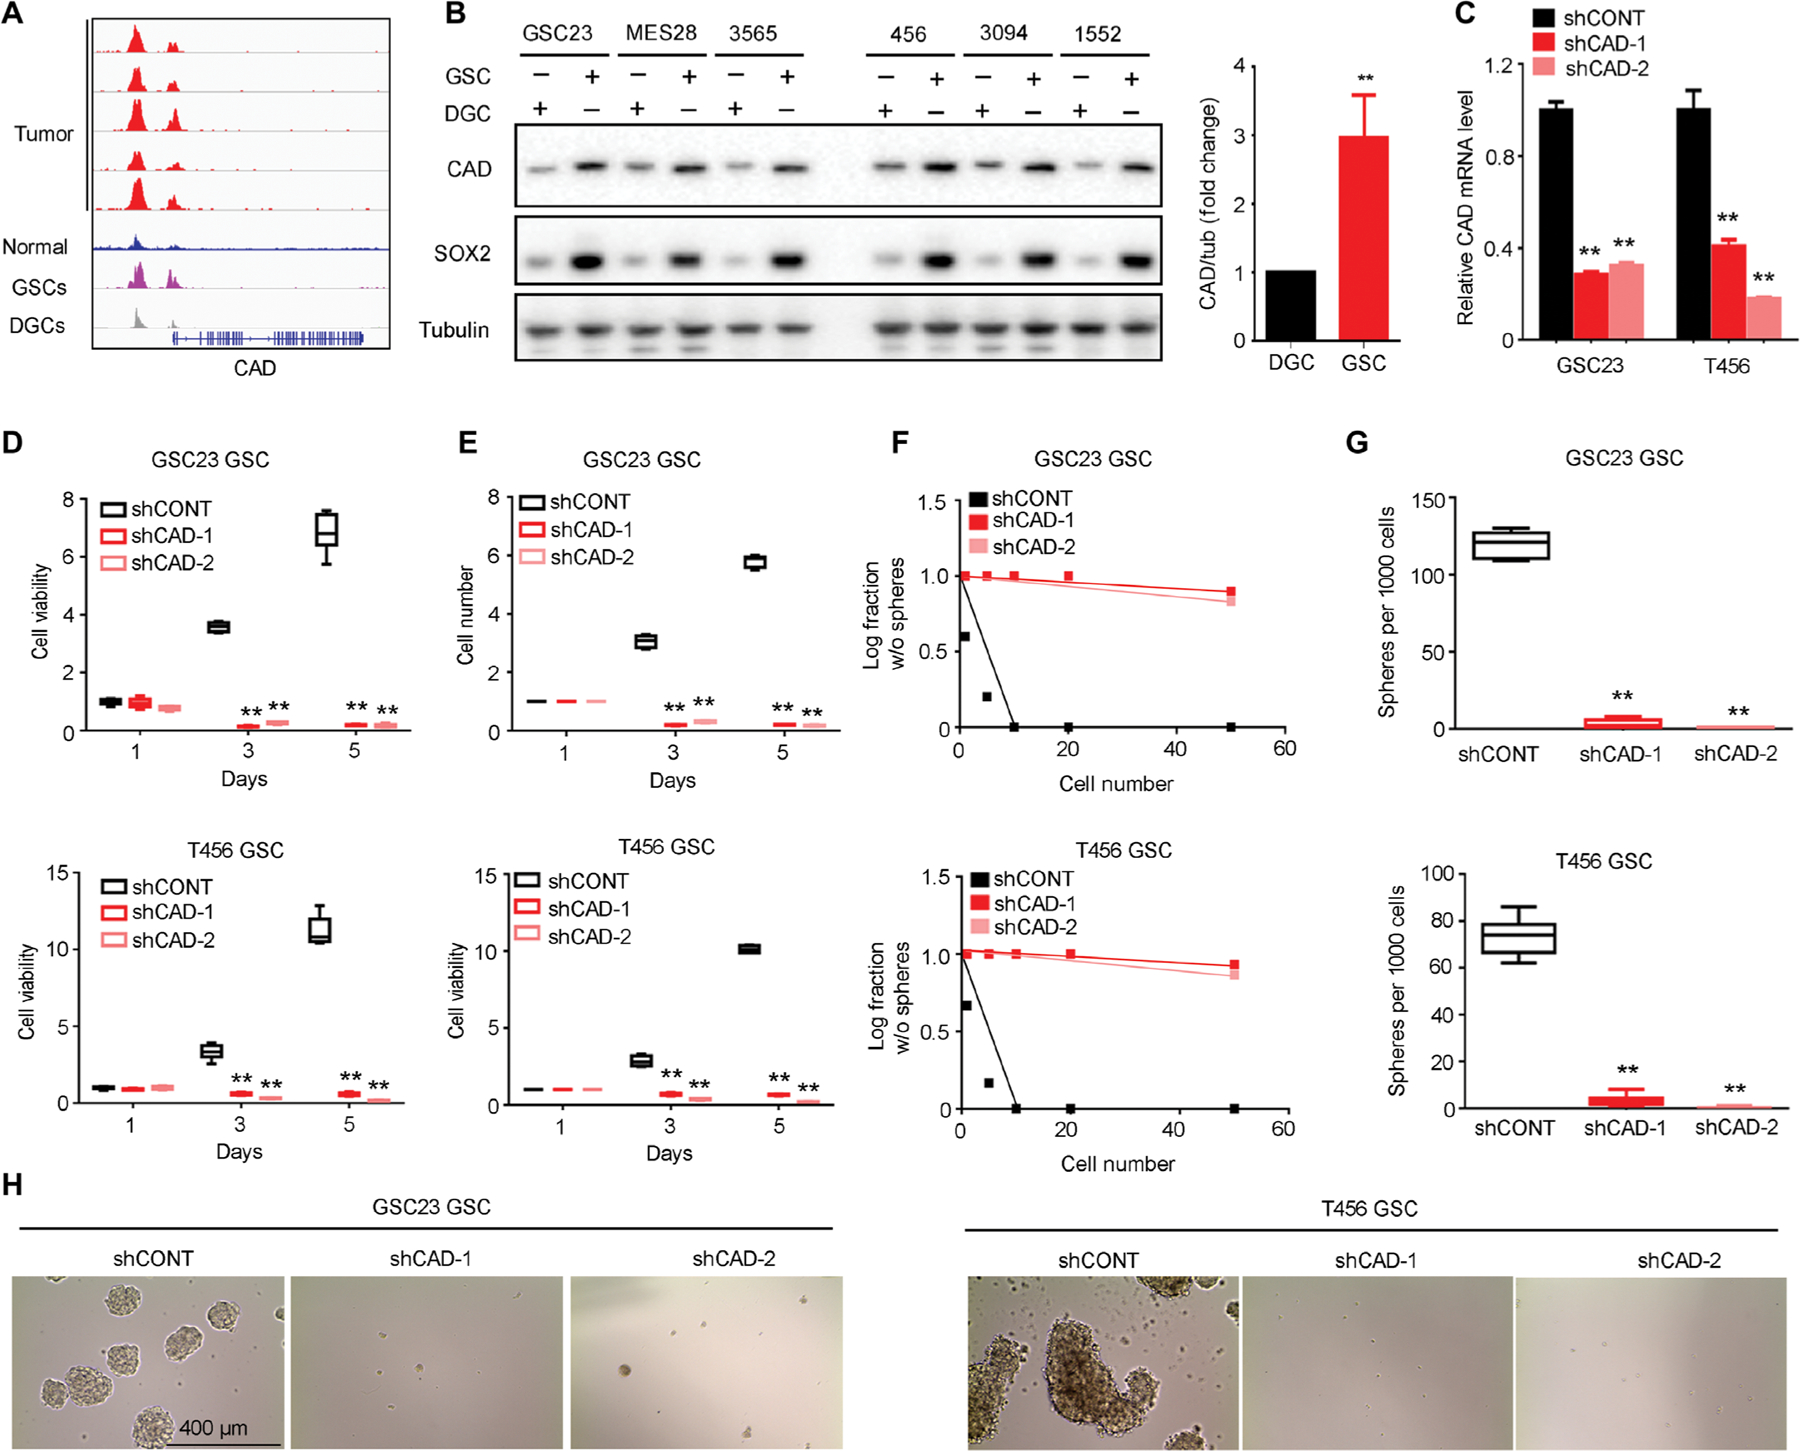
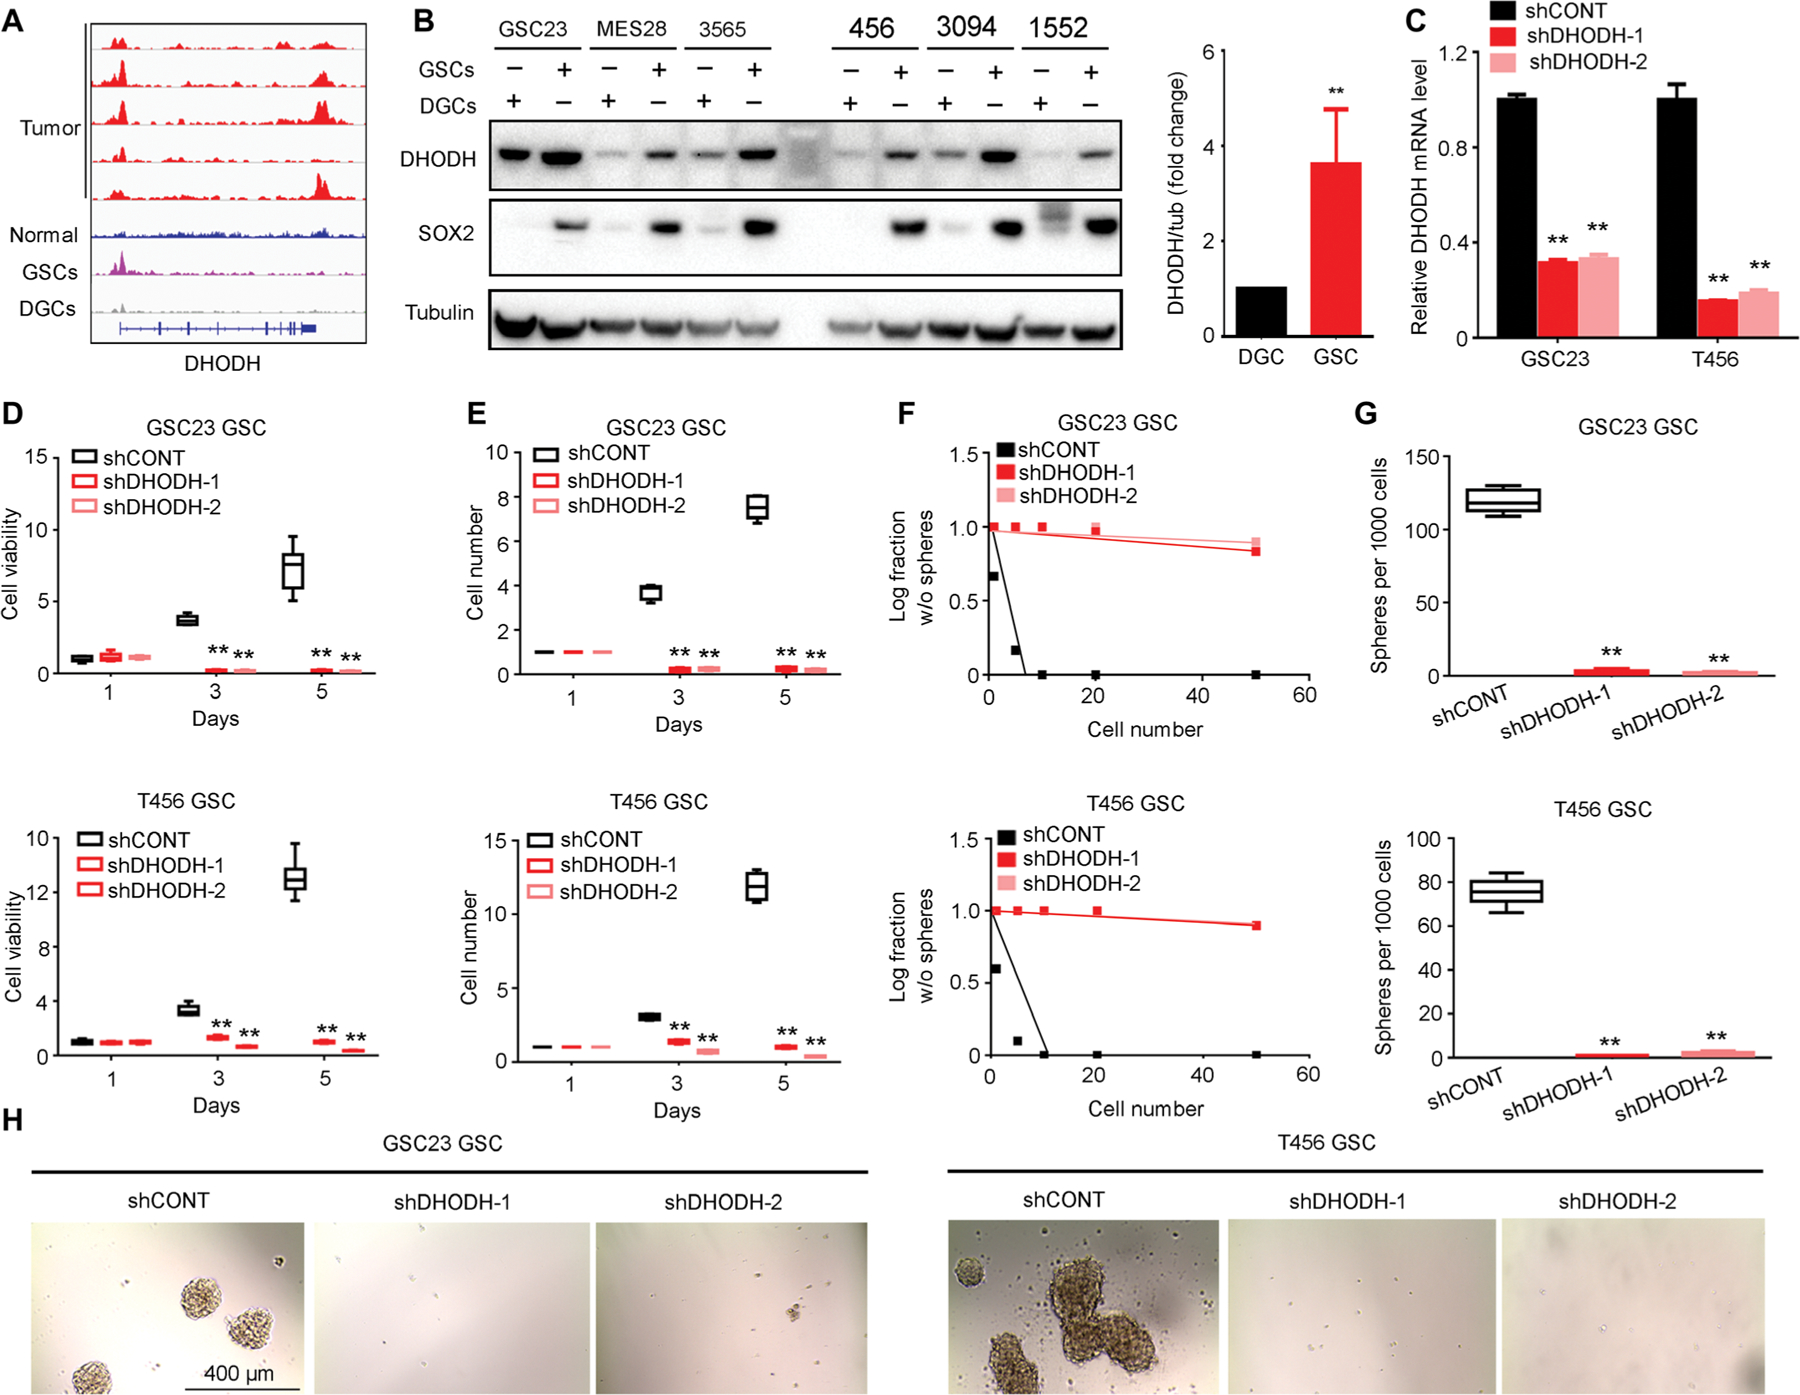
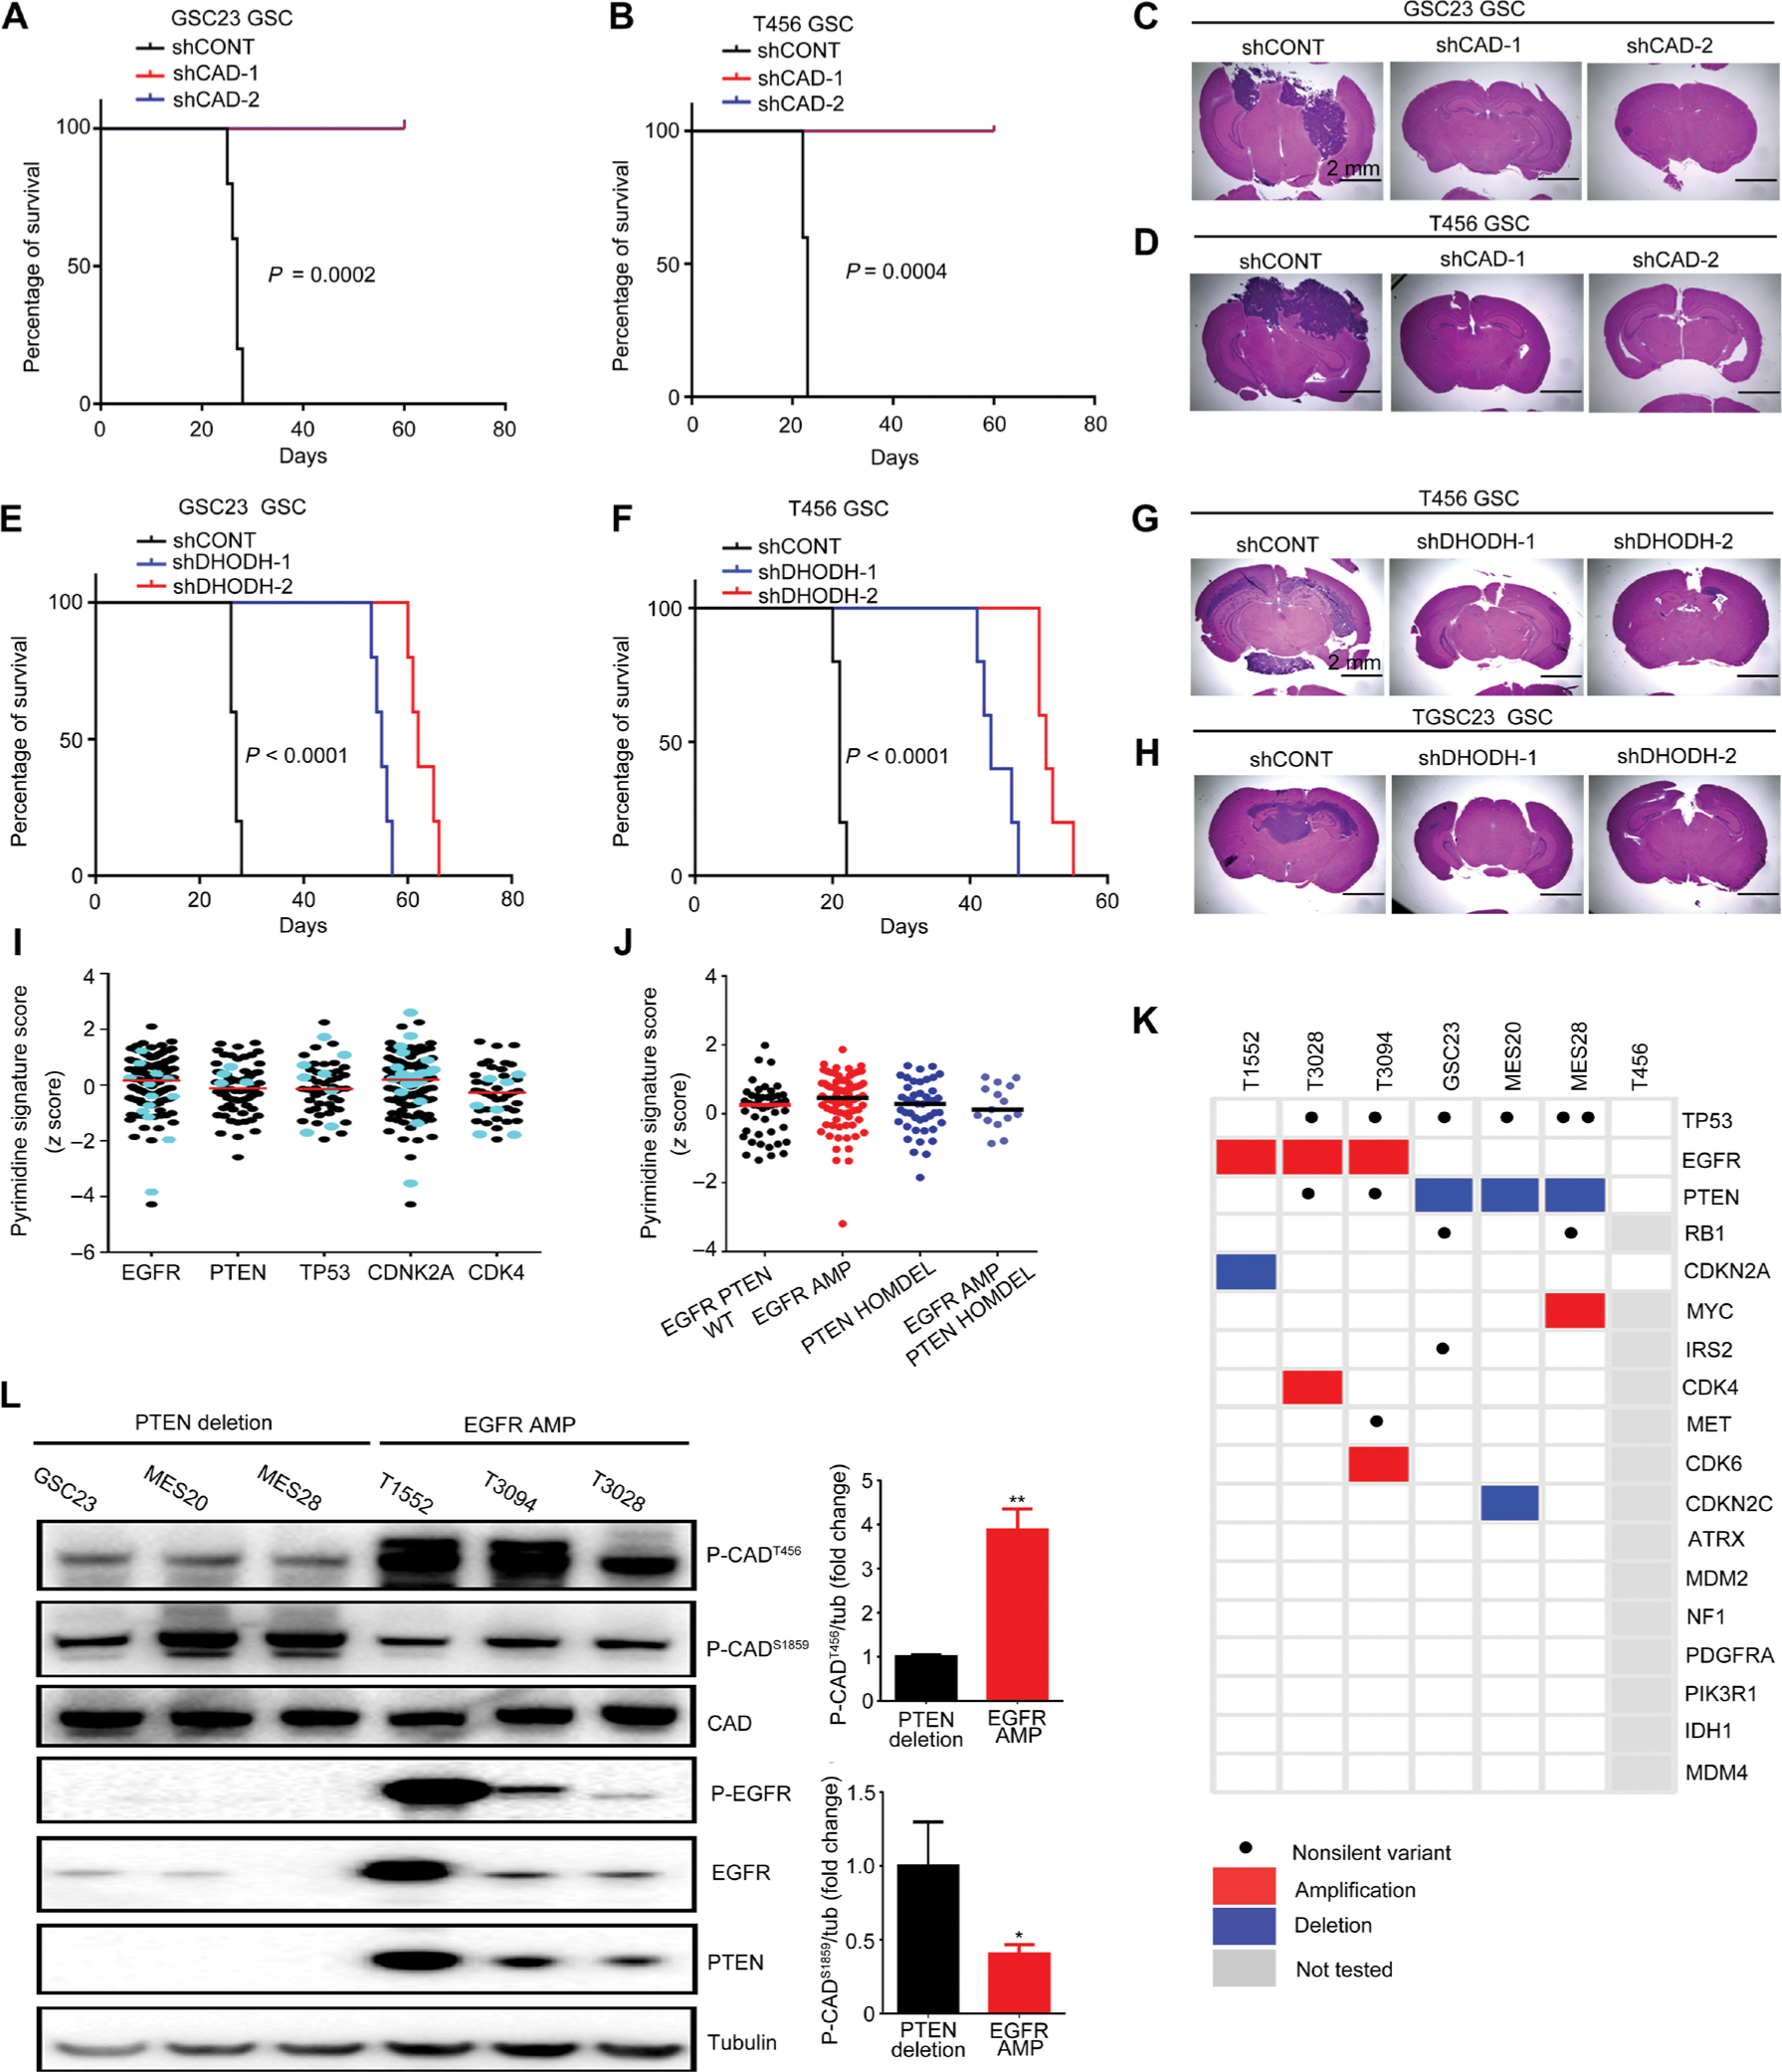
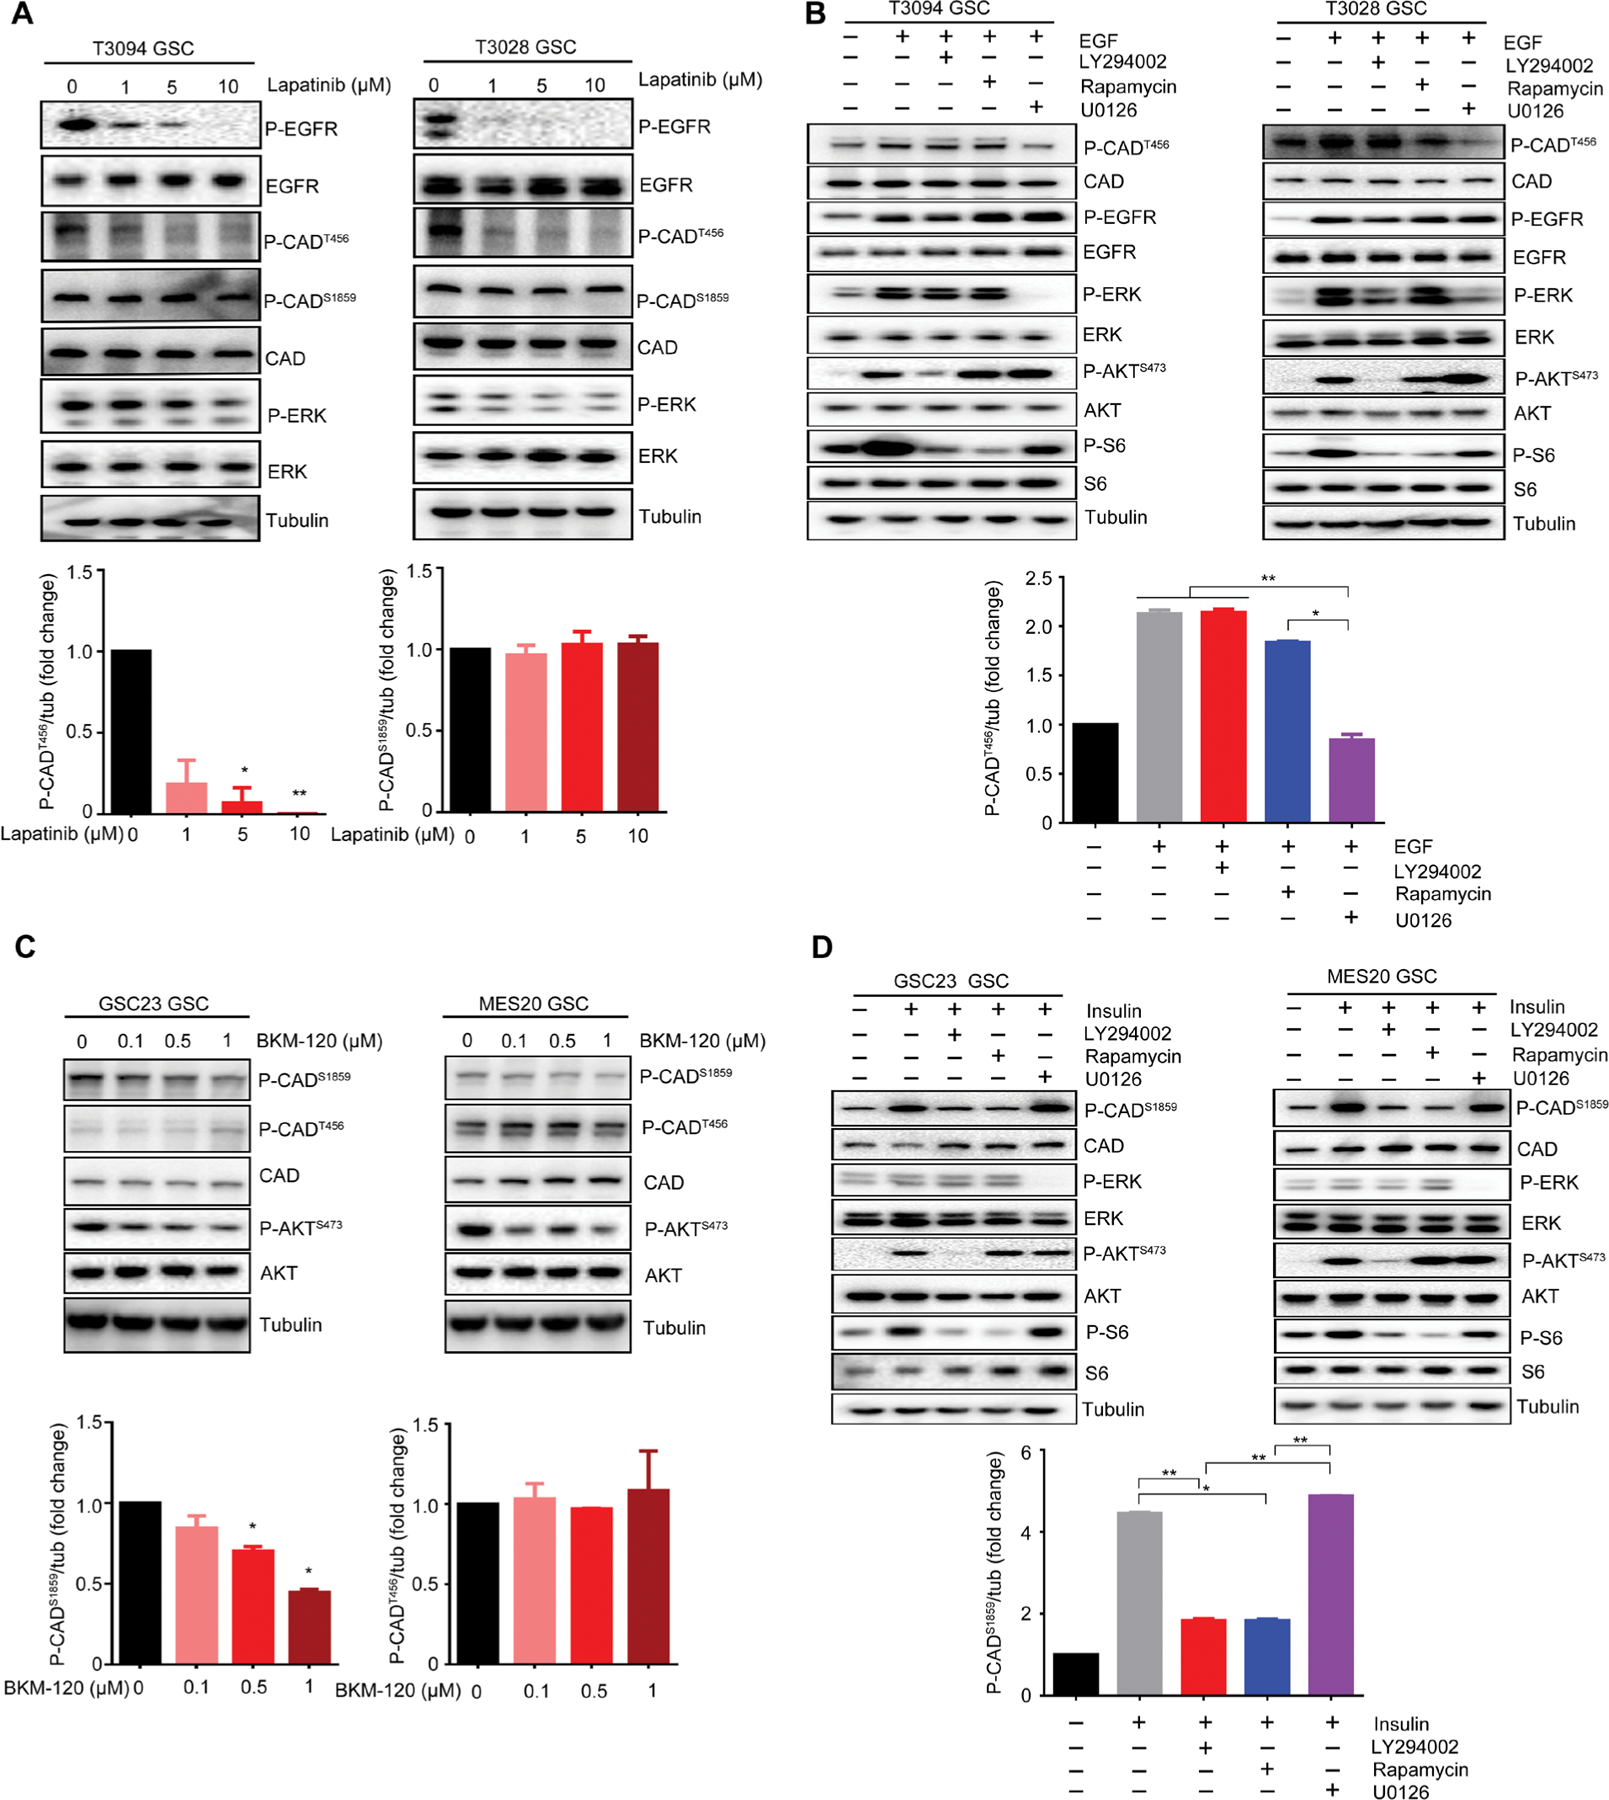
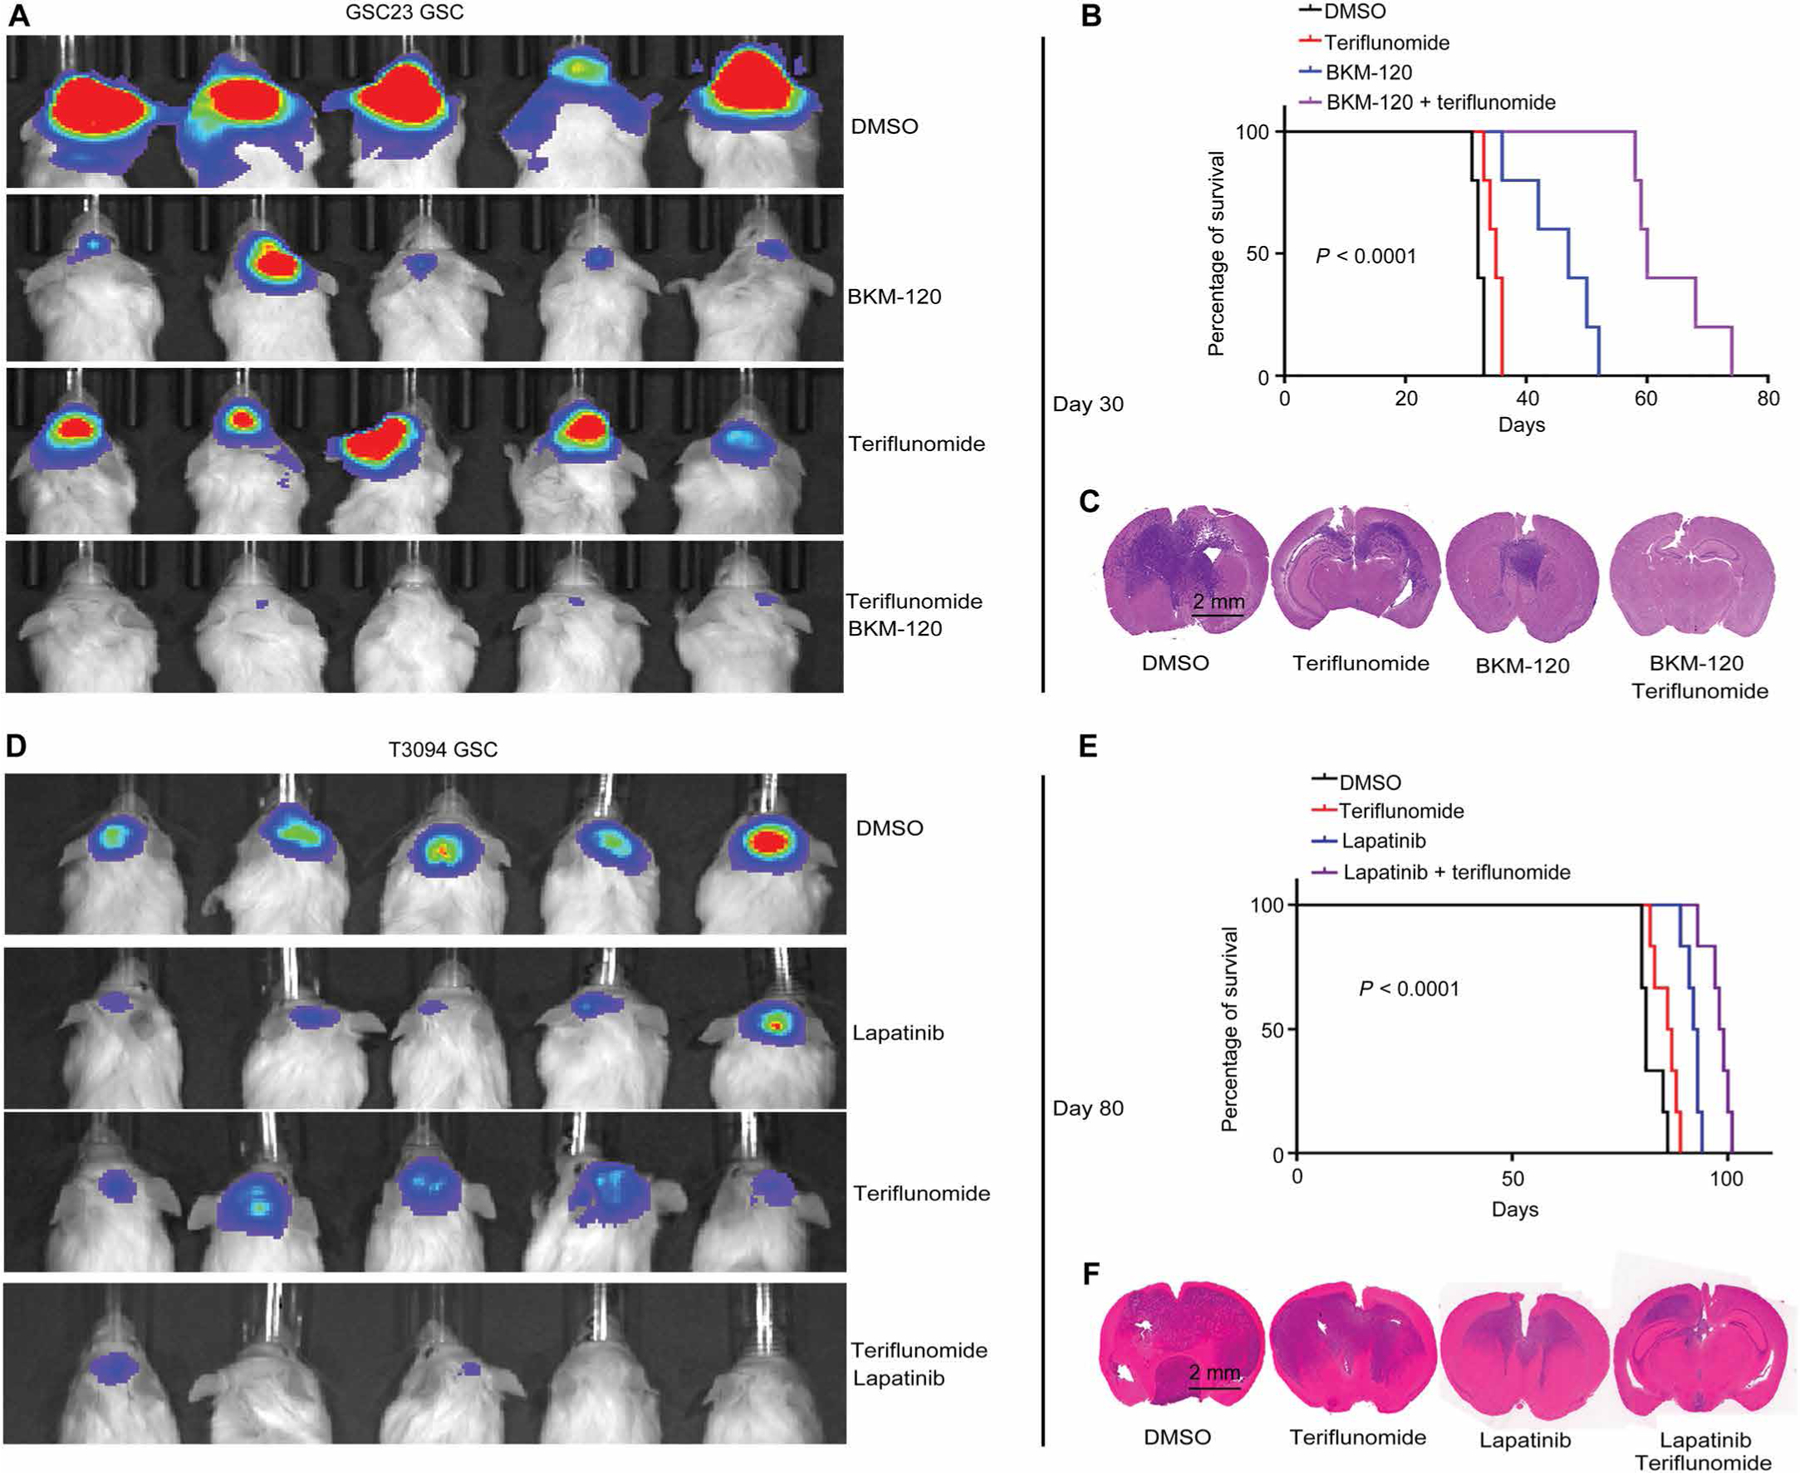
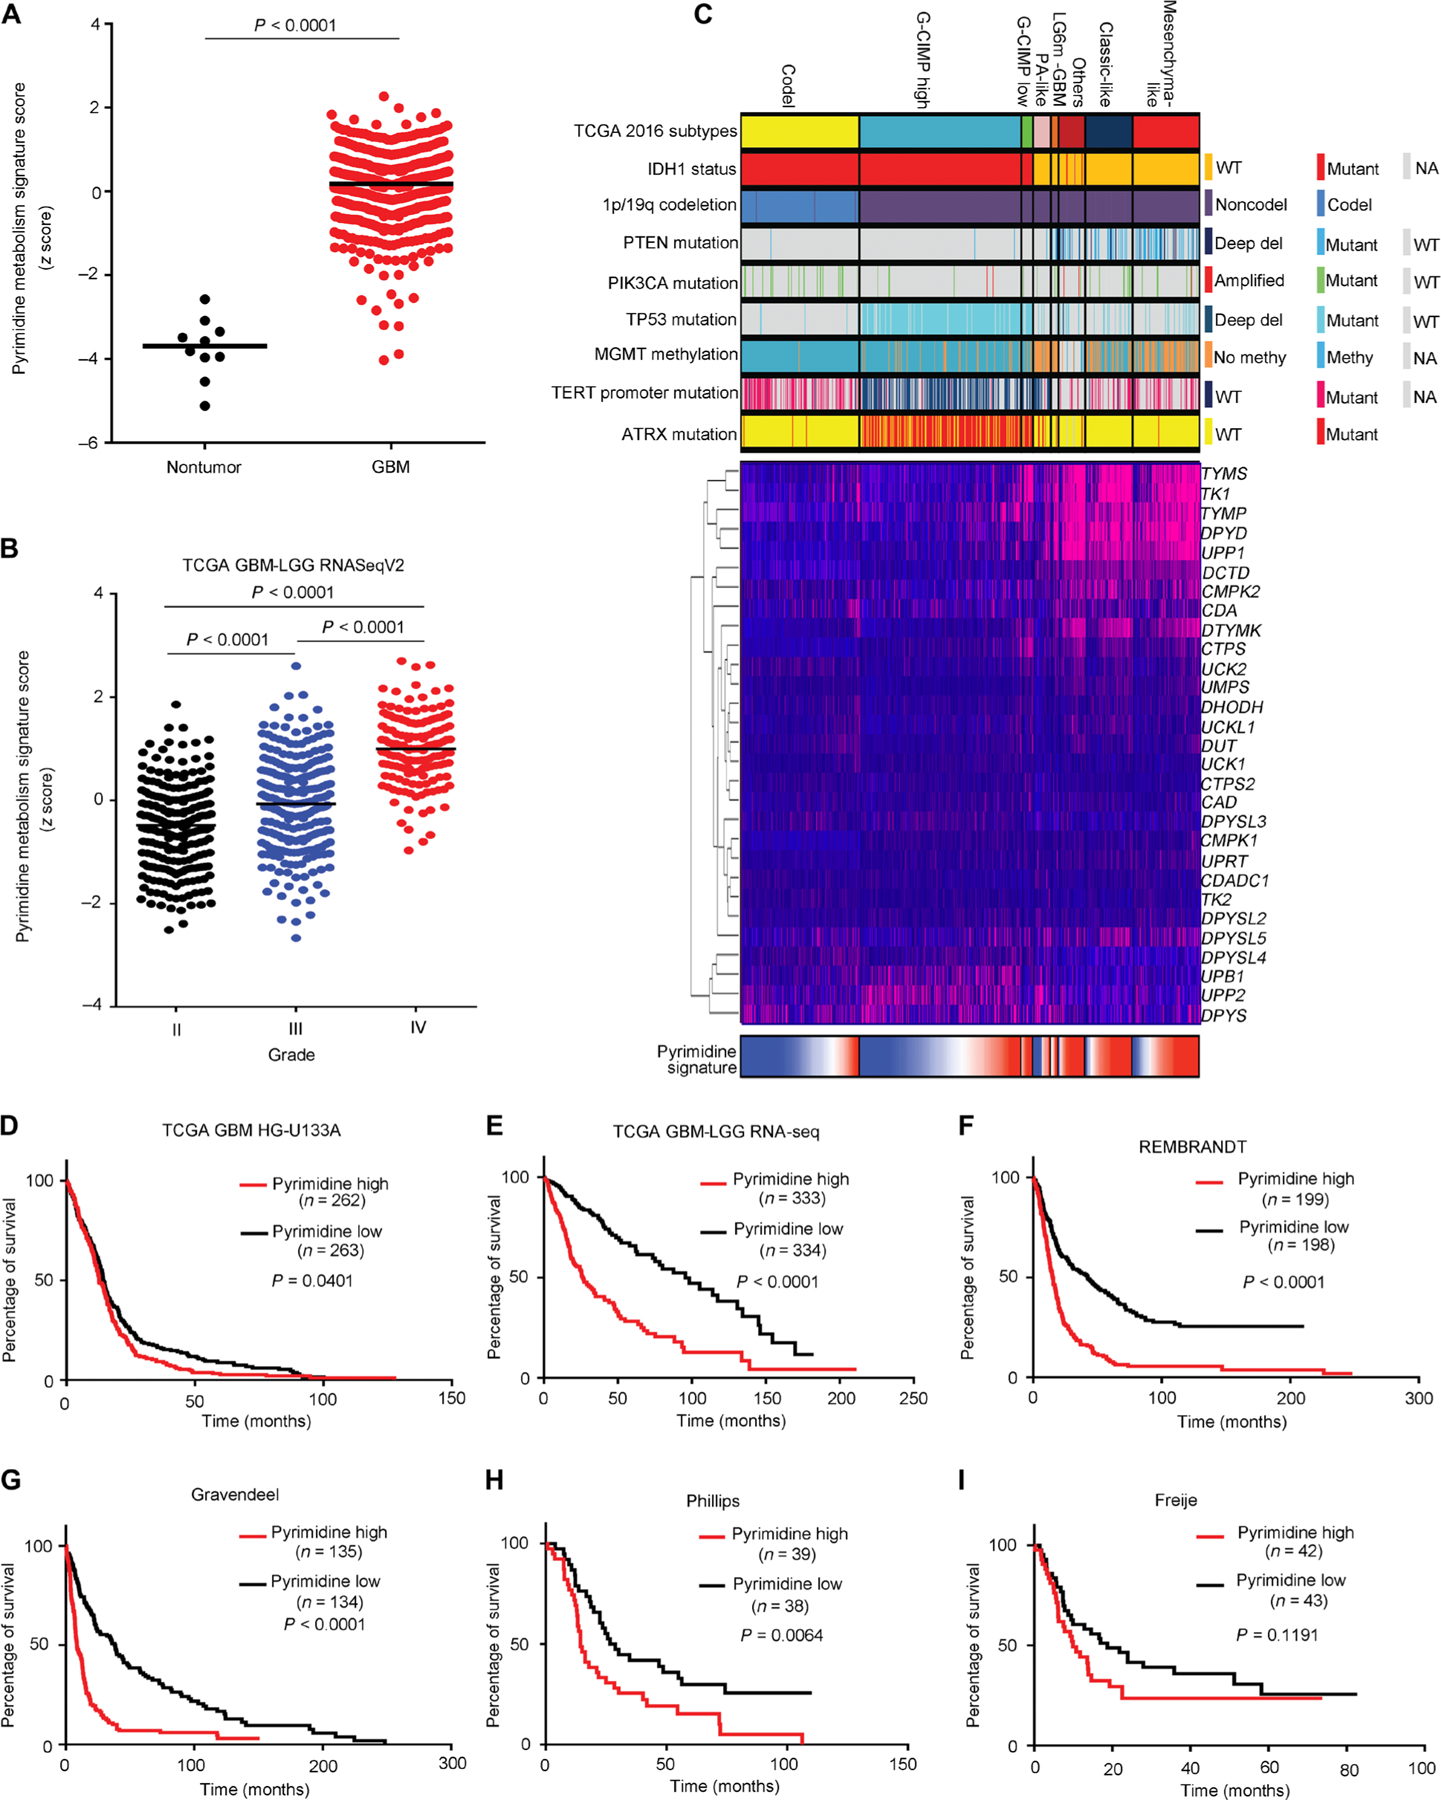
Glioblastoma stem cells (GSCs) reprogram glucose metabolism by hijacking high-affinity glucose uptake to survive in a nutritionally dynamic microenvironment. Here, we trace metabolic aberrations in GSCs to link core genetic mutations in glioblastoma to dependency on de novo pyrimidine synthesis. Targeting the pyrimidine synthetic rate-limiting step enzyme carbamoyl-phosphate synthetase 2, aspartate transcarbamylase, dihydroorotase (CAD) or the critical downstream enzyme dihydroorotate dehydrogenase (DHODH) inhibited GSC survival, self-renewal, and in vivo tumor initiation through the depletion of the pyrimidine nucleotide supply in rodent models. Mutations in EGFR or PTEN generated distinct CAD phosphorylation patterns to activate carbon influx through pyrimidine synthesis. Simultaneous abrogation of tumor-specific driver mutations and DHODH activity with clinically approved inhibitors demonstrated sustained inhibition of metabolic activity of pyrimidine synthesis and GSC tumorigenic capacity in vitro. Higher expression of pyrimidine synthesis genes portends poor prognosis of patients with glioblastoma. Collectively, our results demonstrate a therapeutic approach of precision medicine through targeting the nexus between driver mutations and metabolic reprogramming in cancer stem cells.


Conflict of interest statement

Competing interests: P.S.M. is a cofounder of Pretzel Therapeutics Inc., for which he owns equity and serves as a consultant. All other authors declare that they have no competing interests.

Figures

Fig. 1.
Fig. 1.. Profiling reveals specific up-regulation of de novo pyrimidine synthesis pathway in GSCs.
(A) Comparative metabolomic analysis of grade II glioma (n = 18) versus glioblastoma (n = 36). Volcano plot showing differential metabolite abundances from primary tumor samples between grade II glioma and glioblastoma (25). Red dots indicate metabolites that were increased [false discovery rate (FDR) P < 0.05] in glioblastoma compared to grade II glioma, whereas blue dots indicate those that were decreased (FDR P < 0.05). Orange dots indicate metabolites in the pyrimidine synthesis pathway. 2-HG, 2-hydroxyglutarate. (B) Metabolite pathway enrichment analysis of metabolites increased [FDR P < 0.05; fold change (FC) > 1] in glioblastoma compared to grade II glioma (25). Pathway impact refers to the importance of altered metabolites in the respective metabolic pathway, as calculated by Metabo-Analyst. (C) Enrichment analysis of all metabolic pathways up-regulated in glioblastoma stem cells (GSCs; red) versus differentiated glioblastoma cells (DGCs; orange) derived from differential H3K27ac in the GSC23 and T3094 glioblastoma models. NAD, nicotinamide adenine dinucleotide. (D) Patient-derived GSCs (GSC23 and T3094) were cultured under serum-free conditions to maintain their GSC state or induced into DGCs and then subjected to histone 3 lysine 27 acetyl chromatin immunoprecipitation followed by deep sequencing (H3K27ac ChIP-seq). Comparative coverage plots between matched GSCs and DGCs illustrate the specific promoters of matched GSC23 and T3094 GSCs and DGCs for focused metabolic pathways. Heat maps are shown to depict H3K27ac signal, normalized to read depth, for ±5 kb surrounding enhancer peaks. Color scale indicates reads per kilobase per million mapped reads (RPKM). The y axis is also normalized H3K27ac read depth (RPKM). Transcriptional start sites (TSS) for selected metabolic genes were mapped for nucleotide and pyrimidine metabolism. Pathway enrichment was assessed using single-sample gene set enrichment analysis (ssGSEA) comparing pathway enrichment scores between GSCs and DGCs [GSC23: P < 0.0001 (nucleotide) and P = 0.0178 (pyrimidine); T3094: P < 0.0001 (nucleotide) and P < 0.0001 (pyrimidine); sign test was used for statistical analysis].
Fig. 2.
Fig. 2.. CAD regulates GSC growth and self-renewal.
(A) H3K27ac ChIP-seq enrichment plot centered at the gene locus for CAD. Active chromatin was profiled by H3K27ac ChIP-seq for five primary glioblastoma tumors, five normal brain tissues, and three matched pairs of GSCs and DGCs from patient-derived glioblastoma specimens. Raw data from enhancer profiling of primary glioma tissues were downloaded from GSE101148. Matched pairs of GSCs and DGCs and normal tissues H3K27ac ChIP-seq data were downloaded from NCBI Gene Expression Omnibus GSE54047 and GSE17312. (B) Protein concentrations of CAD with normalized quantifications in matched pairs of GSCs and DGCs across human glioblastoma specimens GSC23, MES28, T3565, T456, T3094, and T1552 (n = 6 biological replicates; **P < 0.01, one-way ANOVA). (C) Quantitative RT-PCR assessment of CAD mRNA in GSC23 and T456 GSCs expressing a nontargeting control shRNA (shCONT), shCAD-1, or shCAD-2 (n = 6 independent experiments per group; **P < 0.01, one-way ANOVA). (D) Cell growth of GSC23 and T456 GSCs expressing shCONT, shCAD-1, or shCAD-2 was measured by CellTiter-Glo assay (n = 5 independent experiments per group; **P < 0.01, one-way ANOVA). (E) Growth of GSC23 and T456 GSCs expressing shCONT, shCAD-1, or shCAD-2 was measured by direct cell number count (n = 5 independent experiments per group; **P < 0.01, one-way ANOVA). (F) Sphere formation using an extreme limiting dilution assay (ELDA) was performed with GSC23 and T456 GSCs expressing shCONT, shCAD-1, or shCAD-2 (GSC23, P < 0.01; T456, P < 0.01, ELDA analysis). (G) The number of spheres formed using GSC23 and T456 GSCs expressing shCONT, shCAD-1, or shCAD-2 was determined with ELDA per 1000 cells seeded (n = 6 independent experiments per group; **P < 0.01, one-way ANOVA). (H) Representative images of neurospheres derived from GSC23 and T456 GSCs expressing shCONT, shCAD-1, or shCAD-2. Scale bar, 400 μm. Each image is representative of at least five similar experiments.
Fig. 3.
Fig. 3.. DHODH promotes GSC growth and self-renewal.
(A) H3K27ac ChIP-seq enrichment plot centered at the gene locus for DHODH. Active chromatin was profiled by H3K27ac ChIP-seq for five primary glioblastoma tumors, five normal brain tissue, and three matched pairs of GSCs and DGCs from patient-derived glioblastoma specimens. Raw data for enhancer profiling of primary glioma tissues were downloaded from GSE101148. Matched pairs of GSCss and DGCs and normal tissues H3K27ac ChIP-seq data were downloaded from NCBI Gene Expression Omnibus GSE54047 and GSE17312. (B) Protein concentrations of DHODH with normalized quantifications in matched pairs of GSCs and DGCs across human glioblastoma specimens GSC23, MES28, T3565, T456, T3094, and T1552 (n = 6 biological replicates; **P < 0.01, one-way ANOVA). (C) Quantitative RT-PCR assessment of DHODH mRNA in GSC23 and T456 GSCs expressing shCONT, shDHODH-1, or shDHODH-2 (n = 3 independent experiments per group; **P < 0.01, one-way ANOVA). (D) Cell growth of GSC23 and T456 GSCs expressing shCONT, shDHODH-1, or shDHODH-2 was measured by CellTiter-Glo assay (n = 6 independent experiments per group; **P < 0.01, one-way ANOVA). (E) Growth of GSC23 and T456 GSCs expressing shCONT, shDHODH-1, or shDHODH-2 was measured by direct cell number count (n = 5 independent experiments per group; **P < 0.01, one-way ANOVA). (F) Sphere formation using an ELDA was performed with GSC23 and T456 GSCs expressing shCONT, shDHODH-1, or shDHODH-2 (GSC23, P < 0.01; T456, P < 0.01, ELDA analysis). (G) The number of spheres formed using GSC23 and T456 GSCs expressing shCONT, shDHODH-1, or shDHODH-2 was determined with ELDA per 1000 cells seeded (n = 6 independent experiments per group; **P < 0.01, one-way ANOVA). (H) Representative images of neurospheres derived from GSC23 and T456 GSCs expressing shCONT, shDHODH-1, or shDHODH-2. Scale bar, 400 μm. Each image is representative of at least five similar experiments.
Fig. 4.
Fig. 4.. CAD and DHODH are essential for GSC maintenance with glioblastoma driver mutations differentially regulating pyrimidine synthesis.
(A and B) Kaplan- Meier survival curves of immunocompromised mice bearing intracranial GSC23 (A) or T456 (B) GSCs transduced with either a control shRNA (shCONT) or one of two shRNAs targeting CAD (shCAD-1 or shCAD-2) [n = 5 for each group; P = 0.0002 (GSC23) and P = 0.0004 (T456) using log-rank test]. (C and D) Representative images of hematoxylin and eosin-stained sections of mouse brains collected on day 20 after transplantation of GSC23 (C) or T456 (D) GSCs expressing shCONT, shCAD-1, or shCAD-2. Scale bar, 2 mm. (E and F) Kaplan-Meier survival curves of immunocompromised mice bearing intracranial GSC23 (E) or T456 (F) GSCs expressing shCONT or one of two shRNAs targeting DHODH (shDHODH-1 or shDHODH-2) (n = 5 for each group; P < 0.0001 for GSC23 and T456, log-rank test). (G and H) Representative images of hematoxylin and eosin-stained sections of mouse brains collected on day 20 after transplantation of GSC23 (G) or T3094 (H) GSCs expressing shCONT, shDHODH-1, or shDHODH-2. Scale bar, 2 mm. (I and J) Overall expressions of pyrimidine metabolism genes across the TCGA glioblastoma dataset with different gene mutations/alterations, including EGFR, PTEN, TP53, CDKN2A, or CDK4. Black: Glioblastoma with mutation in the designated gene (may also have other gene mutations). Cyan: Glioblastoma with mutation only in the designated gene. WT, wild type; AMP, amplification; HOMDEL, homozygous deletion. (K) Genetic alterations in PTEN and EGFR were analyzed using exome sequencing for each GSC model used in this study. Black dot represented nonsilent variants including nonsynonymous mutations and/or splice site variants predicted to have moderate to high impact on protein structure. Red and blue represented focal amplifications (log2 copy number ratio > 2 or > 1, if focal) and deletions (log2 copy number ratio < −2 or < −1, if focal), respectively. (L) Immunoblot assessment and normalized quantifications of phosphorylation at CADT456 and CADS1859 across patient-derived GSC23, MES20, MES28, T1552, T3028, and T3094 GSCs. Tubulin was used as a loading control (n = 3 biological replicates; *P < 0.05 and **P < 0.01, one-way ANOVA).
Fig. 5.
Fig. 5.. EGFR and PI3K/PTEN differentially activate CAD phosphorylation sites.
(A) Immunoblot assessment of phosphorylated EGFR, phosphorylated ERK, phosphorylated CADS1859, phosphorylated CADT456, and total CAD protein after treatment with the EGFR inhibitor lapatinib (1, 5, and 10 μM) for 48 hours in T3094 and T3028 GSCs. Normalized quantifications with tubulin as control were performed for phosphorylated CADS1859 and phosphorylated CADT456 (n = 2 biological replicates; *P < 0.05 and **P < 0.01, one-way ANOVA). (B) GSCs (T3094 and T3028) were treated with EGF (100 ng/ml) over a 30-min time course, together with inhibitors of the PI3K (LY294002), mTOR (rapamycin), or MEK (U0126) pathways. Amounts of phosphorylated CADT456, total CAD, phosphorylated EGFR, total EGFR, phosphorylated ERK, total ERK, phosphorylated AKTS473, total AKT, phosphorylated S6, and total S6 were assessed by immunoblot. Normalized quantifications with tubulin as control were performed for phosphorylated CADT456 (n = 2 biological replicates; *P < 0.05 and **P < 0.01, one-way ANOVA). (C) Immunoblot assessment of phosphorylated CADS1859, phosphorylated CADT456, total CAD, phosphorylated AKTS473, and total AKT after treatment with the PI3K inhibitor BKM120 (0.1, 0.5, and 1 μM) for 48 hours in GSC23 and MES20 GSCs. Normalized quantifications with tubulin as control were performed for phosphorylated CADS1859 and phosphorylated CADT456 (n = 2 biological replicates; *P < 0.05, one-way ANOVA). (D) GSCs (GSC23 and MES20) were treated with insulin (1 μM) over a 30-minute time course, together with inhibitors of the PI3K (LY294002), mTOR (rapamycin), or MEK (U0126) pathways. Amounts of phosphorylated CADS1859, total CAD, phosphorylated ERK, total ERK, phosphorylated AKTS473, total AKT, phosphorylated S6, and total S6 were assessed by immunoblot. Normalized quantifications with tubulin as control were performed for phosphorylated CADS1859 (n = 2 biological repli cates; *P < 60.05 and **P < 0.01, one-way ANOVA).
Fig. 6.
Fig. 6.. Combined targeting of pyrimidine synthesis inhibits GSC tumorigenesis in vivo.
(A) GSCs (GSC23) were transduced with firefly luciferase before implantation into NOD.Cg-Prkdcscid Il2rgtm1Wjl/SzJ (NSG) immunocompromised mice. In vivo bioluminescence imaging was performed on NSG mice bearing intracranial xenografts derived from PTEN-deleted GSC23 treated with vehicle control (DMSO), teriflunomide monotherapy (50 mg/kg per day), BKM120 monotherapy (50 mg/kg per day), or the combination of teriflunomide (50 mg/kg per day) and BKM120 (50 mg/kg per day) (n = 5 independent experiments per group). (B) Kaplan-Meier survival curves of immunocompromised mice bearing intracranial tumors derived from PTEN-deleted GSC23 from the four treatment groups in (A) (n = 5 for each group; P < 0.0001, log-rank test). (C) Representative images of hematoxylin and eosin-stained sections of mouse brains from six independent experiments per group collected on day 35 after transplantation of PTEN-deleted GSC23 from the four treatment groups in (A). Scale bar, 2 mm. (D) In vivo bioluminescence imaging was performed on NSG mice bearing intracranial xenografts derived from EGFR-amplified T3094 GSCs treated with vehicle (DMSO), teriflunomide monotherapy (50 mg/kg per day), lapatinib monotherapy (50 mg/kg per day), or the combination of teriflunomide (50 mg/kg per day) and lapatinib (50 mg/kg per day) (n = 6 independent experiments per group). (E) Kaplan-Meier survival curves of immunocompromised mice bearing intracranial tumors derived from EGFR-amplified T3094 from the four treatment groups in (D) (n = 6 for each group; P < 0.0001, log-rank test). (F) Representative images of hematoxylin and eosin-stained sections of mouse brains from six independent experiments per group collected on day 35 after transplantation of EGFR-amplified T3094 GSCs from the four treatment groups in (D). Scale bar, 2 mm.
Fig. 7.
Fig. 7.. Pyrimidine metabolism informs poor clinical outcome in glioblastoma.
(A and B) KEGG pyrimidine metabolism signature ssGSEA score distribution between nontumor and tumor specimens in TCGA glioblastoma (GBM) HG-U133A (A) and among different grades in TCGA glioblastoma-LGG RNA-seq V2 datasets (B). (C) mRNA expression pattern of genes comprising the KEGG pyrimidine metabolism signature and corresponding ssGSEA score distribution in TCGA glioblastoma-LGG cohort (n = 667) stratified by TCGA DNA methylation cluster groups and associated molecular markers. G-CIMP, glioma CpG island methylator phenotype. (D to I) Kaplan-Meier survival analysis based on KEGG pyrimidine metabolism signature ssGSEA scores stratified by the median of six different glioma datasets: (D) TCGA glioblastoma (34), (E) TCGA glioblastoma-LGG RNA-seq (35), (F) REMBRANDT (36), (G) Gravendeel (37), (H) Phillips (38), and (I) Freije (39).

References

    1. Ostrom QT, Gittleman H, de Blank PM, Finlay JL, Gurney JG, McKean-Cowdin R, Stearns DS, Wolff JE, Liu M, Wolinsky Y, Kruchko C, Barnholtz-Sloan JS, American Brain Tumor Association adolescent and young adult primary brain and central nervous system tumors diagnosed in the United States in 2008–2012. Neuro Oncol. 18 (suppl. 1), i1–i50 (2016). - PMC - PubMed
    1. Stupp R, Hegi ME, Mason WP, van den Bent MJ, Taphoorn MJ, Janzer RC, Ludwin SK, Allgeier A, Fisher B, Belanger K, Hau P, Brandes AA, Gijtenbeek J, Marosi C, Vecht CJ, Mokhtari K, Wesseling P, Villa S, Eisenhauer E, Gorlia T, Weller M, Lacombe D, Cairncross JG, Mirimanoff RO; European Organisation for Research and Treatment of Cancer Brain, Tumuour amd Radiation Oncology Groups; National Cancer Institute of Canada Clinical Trials, Effects of radiotherapy with concomitant and adjuvant temozolomide versus radiotherapy alone on survival in glioblastoma in a randomised phase III study: 5-year analysis of the EORTC-NCIC trial. Lancet Oncol. 10, 459–466 (2009). - PubMed
    1. Patel AP, Tirosh I, Trombetta JJ, Shalek AK, Gillespie SM, Wakimoto H, Cahill DP, Nahed BV, Curry WT, Martuza RL, Louis DN, Rozenblatt-Rosen O, Suva ML, Regev A, Bernstein BE, Single-cell RNA-seq highlights intratumoral heterogeneity in primary glioblastoma. Science 344, 1396–1401 (2014). - PMC - PubMed
    1. Bao S, Wu Q, McLendon RE, Hao Y, Shi Q, Hjelmeland AB, Dewhirst MW, Bigner DD, Rich JN, Glioma stem cells promote radioresistance by preferential activation of the DNA damage response. Nature 444, 756–760 (2006). - PubMed
    1. Liu G, Yuan X, Zeng Z, Tunici P, Ng H, Abdulkadir IR, Lu L, Irvin D, Black KL, Yu JS, Analysis of gene expression and chemoresistance of CD133+ cancer stem cells in glioblastoma. Mol. Cancer 5, 67 (2006). - PMC - PubMed

Publication types

MeSH terms