. 2019 Aug 7;11(504):eaax7392.
doi: 10.1126/scitranslmed.aax7392.

Personalized circulating tumor DNA analysis to detect residual disease after neoadjuvant therapy in breast cancer

Affiliations

Personalized circulating tumor DNA analysis to detect residual disease after neoadjuvant therapy in breast cancer

Bradon R McDonald et al. Sci Transl Med. .

Abstract

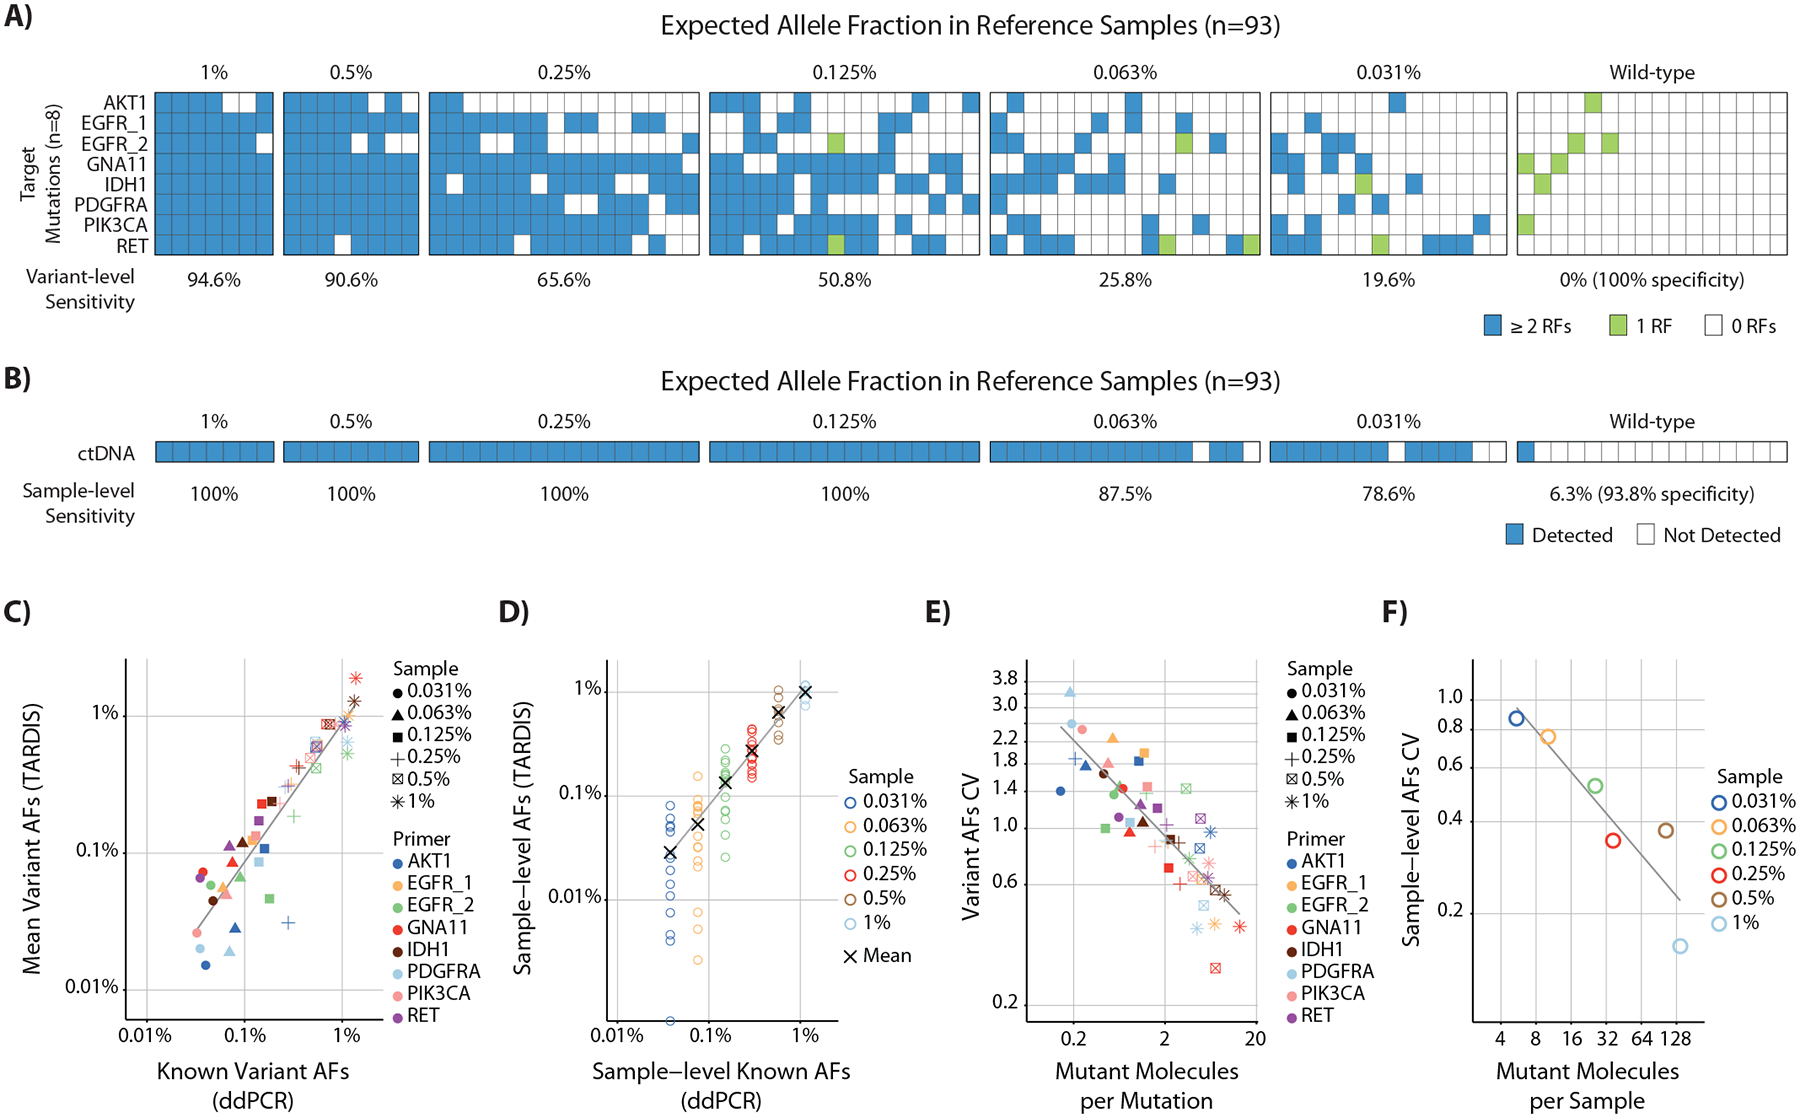
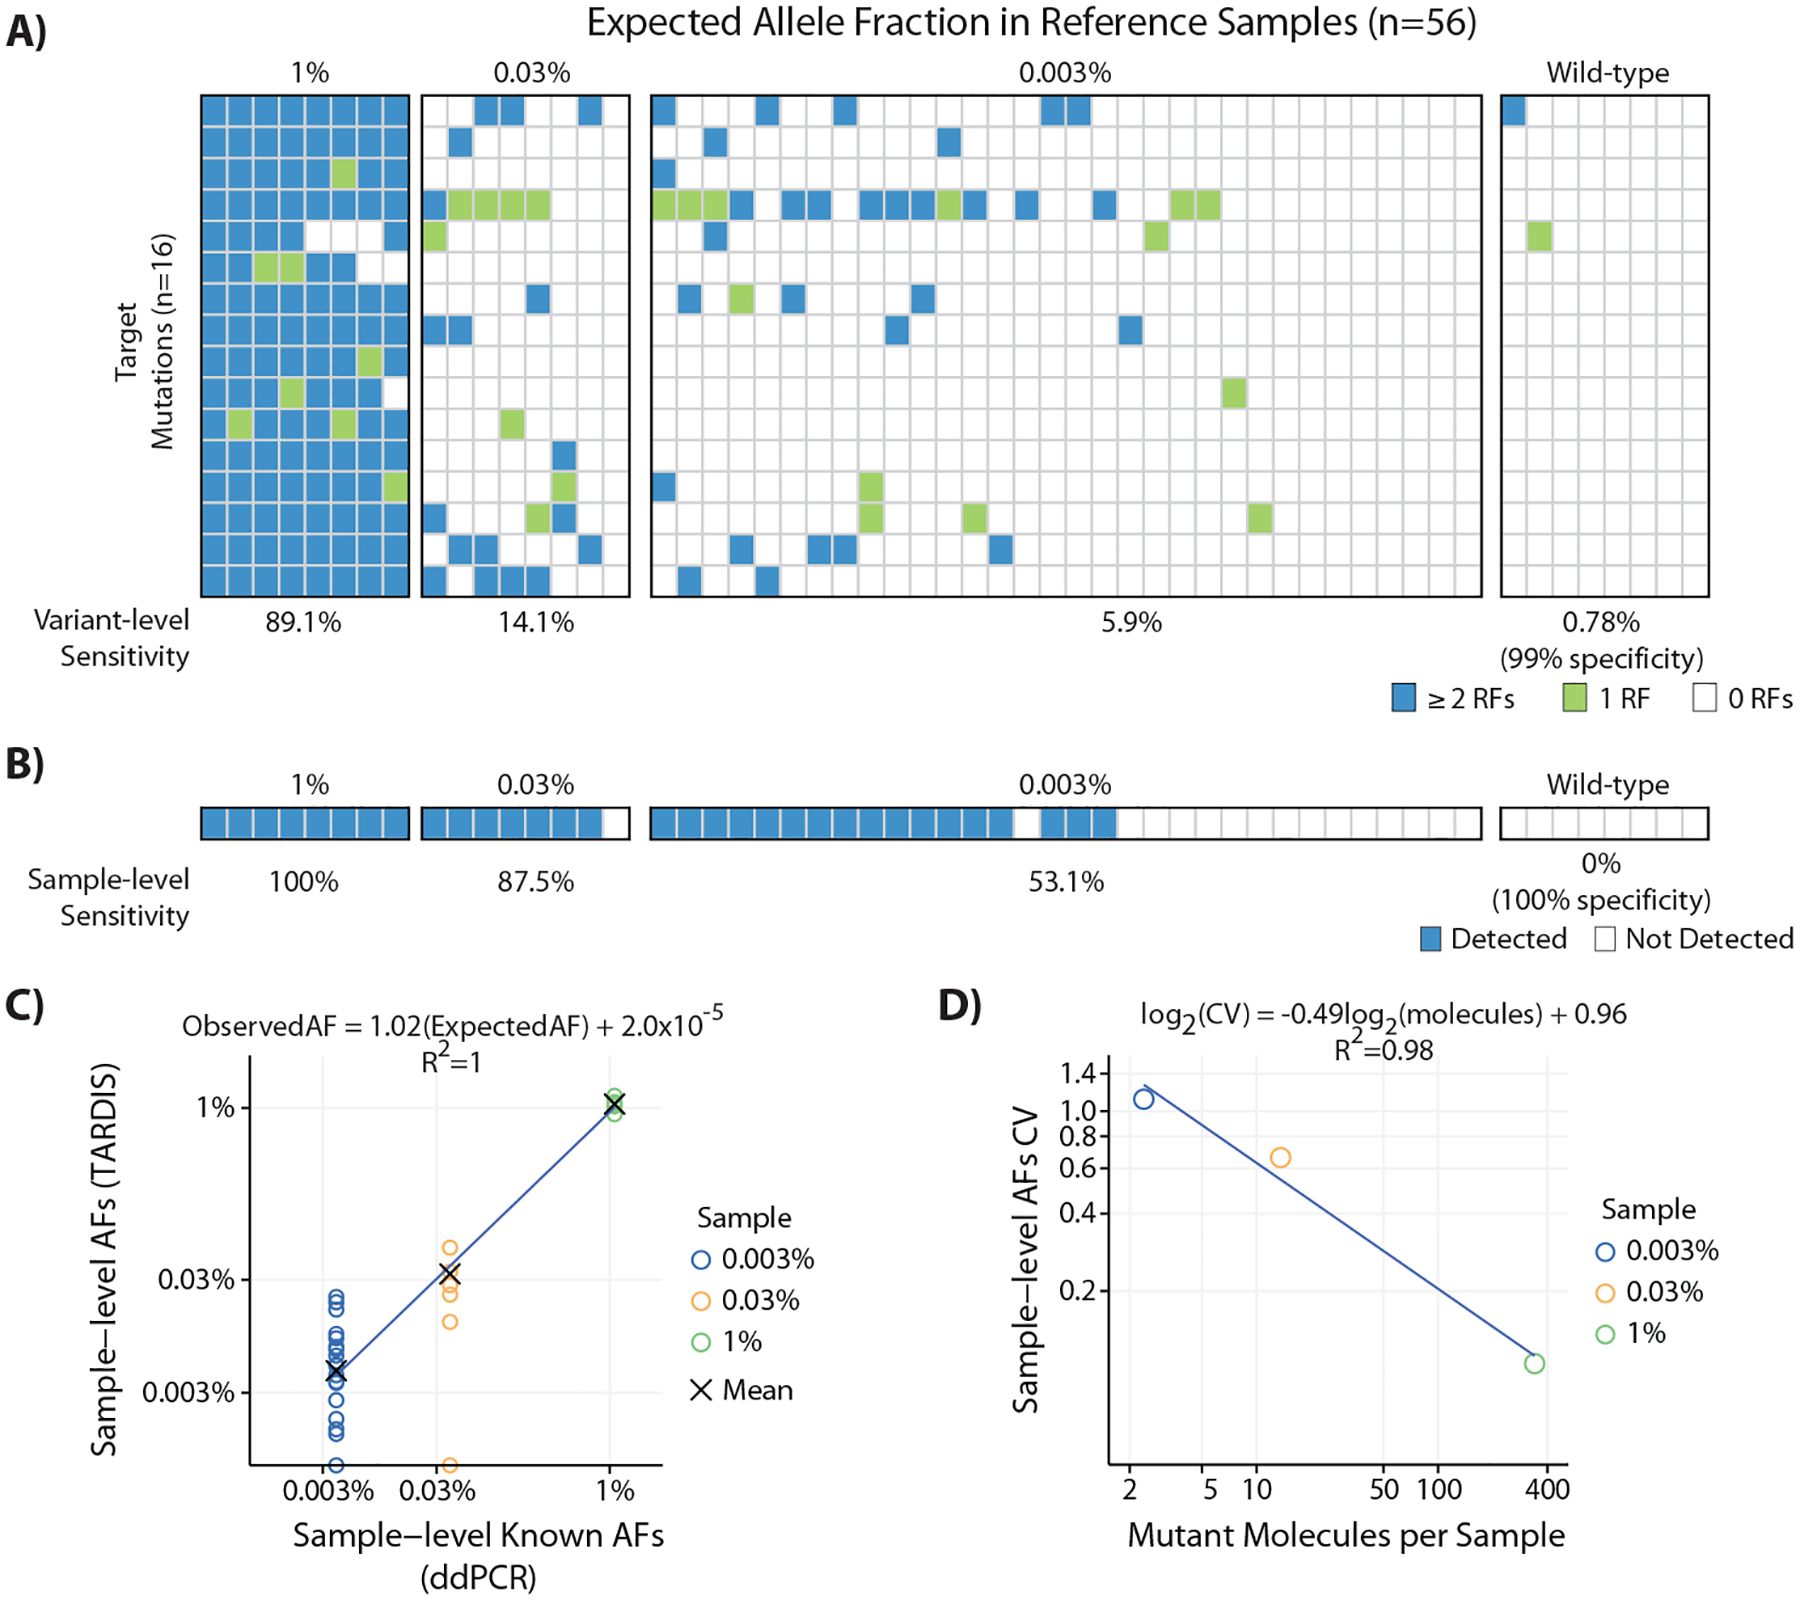
Longitudinal analysis of circulating tumor DNA (ctDNA) has shown promise for monitoring treatment response. However, most current methods lack adequate sensitivity for residual disease detection during or after completion of treatment in patients with nonmetastatic cancer. To address this gap and to improve sensitivity for minute quantities of residual tumor DNA in plasma, we have developed targeted digital sequencing (TARDIS) for multiplexed analysis of patient-specific cancer mutations. In reference samples, by simultaneously analyzing 8 to 16 known mutations, TARDIS achieved 91 and 53% sensitivity at mutant allele fractions (AFs) of 3 in 104 and 3 in 105, respectively, with 96% specificity, using input DNA equivalent to a single tube of blood. We successfully analyzed up to 115 mutations per patient in 80 plasma samples from 33 women with stage I to III breast cancer. Before treatment, TARDIS detected ctDNA in all patients with 0.11% median AF. After completion of neoadjuvant therapy, ctDNA concentrations were lower in patients who achieved pathological complete response (pathCR) compared to patients with residual disease (median AFs, 0.003 and 0.017%, respectively, P = 0.0057, AUC = 0.83). In addition, patients with pathCR showed a larger decrease in ctDNA concentrations during neoadjuvant therapy. These results demonstrate high accuracy for assessment of molecular response and residual disease during neoadjuvant therapy using ctDNA analysis. TARDIS has achieved up to 100-fold improvement beyond the current limit of ctDNA detection using clinically relevant blood volumes, demonstrating that personalized ctDNA tracking could enable individualized clinical management of patients with cancer treated with curative intent.


Conflict of interest statement

Competing interests: MM, TCC, BRM, AOB and NP are inventors or co-inventors on patent applications covering technologies described here including patent application numbers WO2017205540A1 and US201662343802P, both titled “Molecular tagging methods and sequencing libraries” and 62/866,543, titled “Detection and treatment of residual disease using circulating tumor DNA analysis”. MM serves as an expert witness in intellectual property litigation related to cell-free DNA analysis methods. CC is a member of AstraZeneca’s External Science Panel and is a recipient of research grants (administered by the University of Cambridge) from AstraZeneca, Genentech, Roche and Servier. All other authors declare that they have no competing interests.

Figures

Fig. 1.
Fig. 1.
Development of a multiplexed assay for personalized ctDNA detection and monitoring. (A) Results of binomial sampling at varying input DNA amounts (bottom x-axis) and corresponding plasma volumes (top x-axis). Maximum theoretical sensitivity for 1 in 105 tumor fraction (y-axis) was calculated as the probability of detecting at least 1 mutated DNA fragment for at least 1 targeted mutation. Each line shows the number of mutations tested (25 to 100, increments of 5). A plasma DNA concentration of 5 ng/ml plasma (or 1500 haploid genome copies) and no molecular loss during library preparation is assumed. Sensitivity for detection of ctDNA at 0.001% tumor fraction is limited if only 2–4 mutations are assayed but can be improved with higher input of plasma DNA and increasing number of patient-specific mutations. (B) For TARDIS, sequencing library preparation includes linear pre-amplification to improve molecular conversion, single-stranded DNA ligation using hairpin oligonucleotides to allow error suppression using template fragment sizes and unique molecular identifiers (UMIs), and multiplexed PCR to enrich targeted genomic loci. (C) Schematic representation of read structure and error suppression using TARDIS. TARDIS uses UMIs (indicated by different read colors) and fragment sizes to group sequencing reads into read families. We exclude PCR errors (red circle) by requiring consensus of all RF members and polymerase errors (yellow circles) introduced during linear pre-amplification by requiring support by at least 2 RFs. Additional description of error suppression strategies is provided in the Materials and Methods.
Fig. 2.
Fig. 2.
Analytical performance of TARDIS in reference samples. (A) Mutation-level sensitivity and specificity across 93 reference samples and 8 mutations, requiring each mutation to be supported by ≥2 RFs and an AF consistent with ≥0.5 mutant molecules. Each row corresponds to a targeted mutation and each column corresponds to a single sample analyzed at the identified AF. (B) Sample-level sensitivity and specificity, requiring ≥2 RFs contributed by one mutation with multiple fragment sizes or >1 mutations, each with an AF consistent with ≥0.5 mutant molecules. (C) Comparison of variant AFs observed using TARDIS (y-axis) with expected variant AFs measured using ddPCR (x-axis, 48 data points). For each variant, mean observed AF across all replicates (at the same expected AF) is presented,. Gray line is linear fit. (D) Comparison of sample AFs observed using TARDIS (mean for all 8 mutations assayed in each replicate sample, 77 data points) with known sample AFs (mean of known variant AFs). Gray line is linear fit to the mean at each expected AF. (E) CVs of variant AFs decreased with increasing number of mutant molecules per mutation. CVs calculated across 7–16 replicates at each mutation fraction for each of 8 mutations (48 data points). (F) CVs of sample-level AFs were lower than those for individual mutations, demonstrating the advantage of leveraging multiple mutations for ctDNA quantification. CVs calculated across 7–16 replicates for sample-level AFs across 6 mutation fractions.
Fig. 3.
Fig. 3.
Evaluation of analytical performance in reference samples at 3 in 105 tumor fraction. (A) Variant-level sensitivity and specificity across 56 reference samples and 16 mutations, requiring each mutation to be supported by ≥2 RFs and an AF consistent with ≥0.5 mutant molecules. 22 mutations were analyzed in this experiment. However, 6 mutations were inferred to contribute biological background because these were recurrently observed in a wild-type DNA sample sourced from immortalized cell lines. These included known hotspot variants in TP53 (n=4/4 targets), APC (n=1/2 targets), and GNAS (n=1/1 targets). These mutations were dropped from further analysis. Each row corresponds to a targeted mutation and each column corresponds to a single sample analyzed at the identified AF. (B) Sample-level sensitivity and specificity, requiring ≥2 RFs contributed by one mutation with multiple sizes or >1 mutations, each with an AF consistent with ≥0.5 mutant molecules. Although a mutation with 2 RFs was observed in 1 wild-type sample, this mutation was supported by a single size and at the sample-level, ctDNA was determined to be undetectable. (C) Accuracy evaluated by comparison of sample AFs observed using TARDIS (mean for all 16 mutations assayed in each replicate sample) with known sample AFs (mean of known variant AFs measured using digital PCR). Blue line is linear fit to the mean at each expected AF. (D) Precision evaluated using CVs of sample-level AFs, calculated across 8–32 replicates.
Fig. 4.
Fig. 4.
ctDNA analysis in patients with early and locally advanced breast cancer before treatment and after completion of neoadjuvant therapy. (A) Clinical characteristics of the cohort. (B) Summary of results, tumor stage, grade, mitotic rate, subtype, ctDNA detection before treatment and after neoadjuvant therapy and residual disease assessment. Pathological TNM staging was performed after surgery and completion of NAT. NA: not available or applicable, IDC: invasive ductal carcinoma, ILC: invasive lobular carcinoma, ypTis: in situ disease, ypT1–3 and ypN1–3, tumor and nodal stage upon pathological staging. (C) ctDNA fraction at baseline. (D). ctDNA fraction after completion of neoadjuvant therapy, grouped by clinical response to treatment (residual disease vs. pathological complete response). (E) Changes in pre- and post-treatment ctDNA fraction in patients with residual disease and pathCR.
Fig. 5.
Fig. 5.
Receiver operating characteristic curve for predicting residual disease using ctDNA fraction after completion of neoadjuvant therapy.

Comment in

References

    1. Katz SJ, Jagsi R, Morrow M, Reducing Overtreatment of Cancer With Precision Medicine: Just What the Doctor Ordered. JAMA 319, 1091–1092 (2018). - PubMed
    1. Cortazar P, Zhang L, Untch M, Mehta K, Costantino J, Wolmark N, Bonnefoi H, Cameron D, Gianni L, Valagussa P, Meta-analysis results from the collaborative trials in neoadjuvant breast cancer (CTNeoBC). Cancer Res 72, S1–S11 (2012).
    1. Symmans WF, Wei C, Gould R, Yu X, Zhang Y, Liu M, Walls A, Bousamra A, Ramineni M, Sinn B, Hunt K, Buchholz TA, Valero V, Buzdar AU, Yang W, Brewster AM, Moulder S, Pusztai L, Hatzis C, Hortobagyi GN, Long-Term Prognostic Risk After Neoadjuvant Chemotherapy Associated With Residual Cancer Burden and Breast Cancer Subtype. J Clin Oncol 35, 1049–1060 (2017). - PMC - PubMed
    1. Chagpar AB, Middleton LP, Sahin AA, Dempsey P, Buzdar AU, Mirza AN, Ames FC, Babiera GV, Feig BW, Hunt KK, Kuerer HM, Meric-Bernstam F, Ross MI, Singletary SE, Accuracy of physical examination, ultrasonography, and mammography in predicting residual pathologic tumor size in patients treated with neoadjuvant chemotherapy. Annals of surgery 243, 257–264 (2006). - PMC - PubMed
    1. Yuan Y, Chen XS, Liu SY, Shen KW, Accuracy of MRI in prediction of pathologic complete remission in breast cancer after preoperative therapy: a meta-analysis. AJR. American journal of roentgenology 195, 260–268 (2010). - PubMed

Publication types

Substances