. 2019 Aug 7;9(1):11447.
doi: 10.1038/s41598-019-47836-8.

High Glucose Environments Interfere with Bone Marrow-Derived Macrophage Inflammatory Mediator Release, the TLR4 Pathway and Glucose Metabolism

Affiliations

High Glucose Environments Interfere with Bone Marrow-Derived Macrophage Inflammatory Mediator Release, the TLR4 Pathway and Glucose Metabolism

Thais Soprani Ayala et al. Sci Rep. .

Abstract

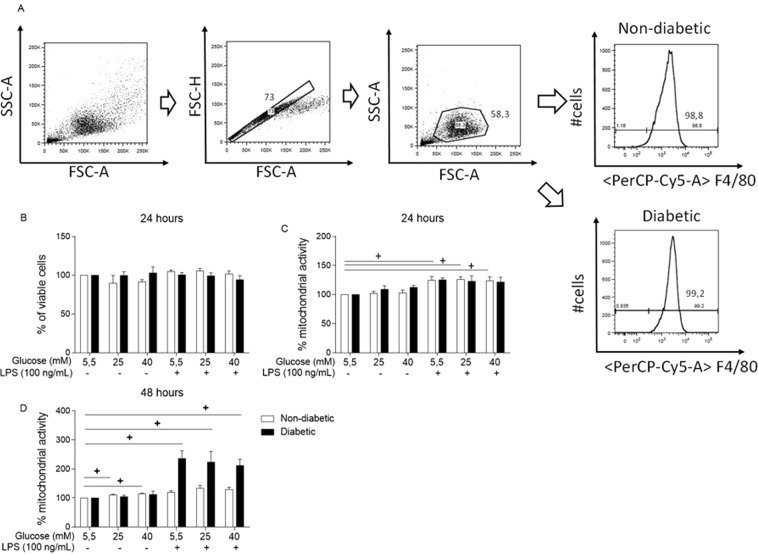
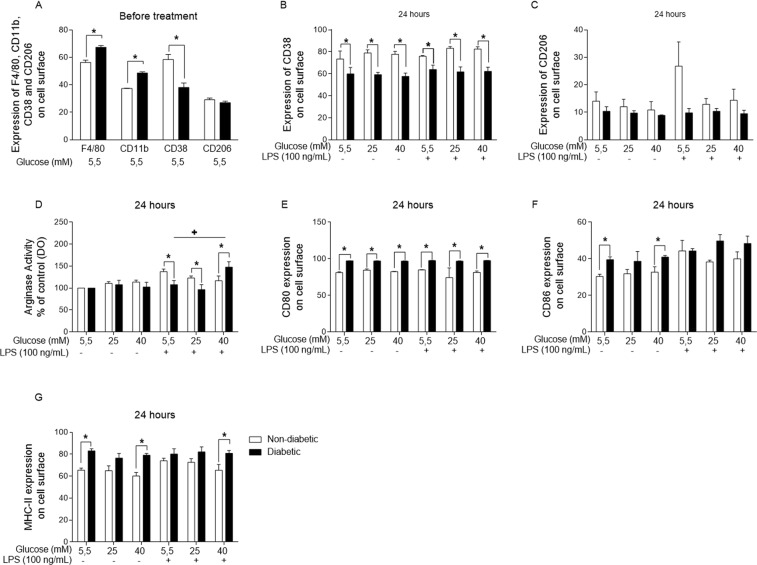
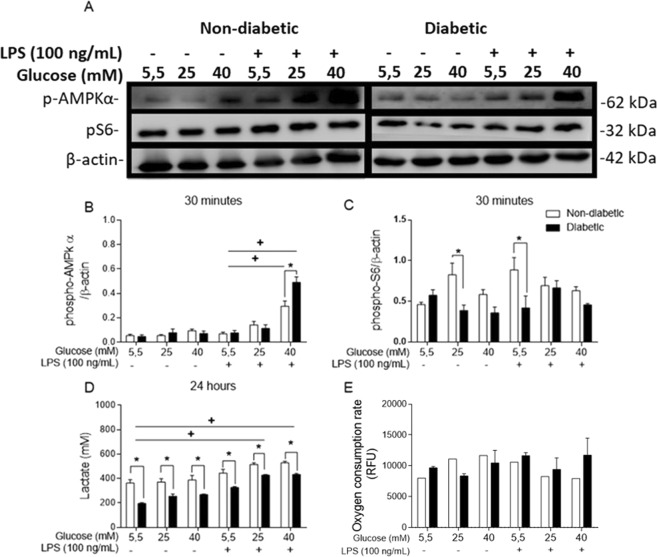
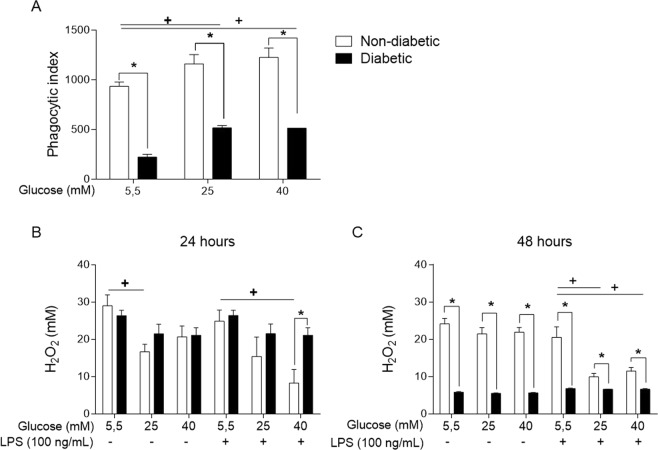
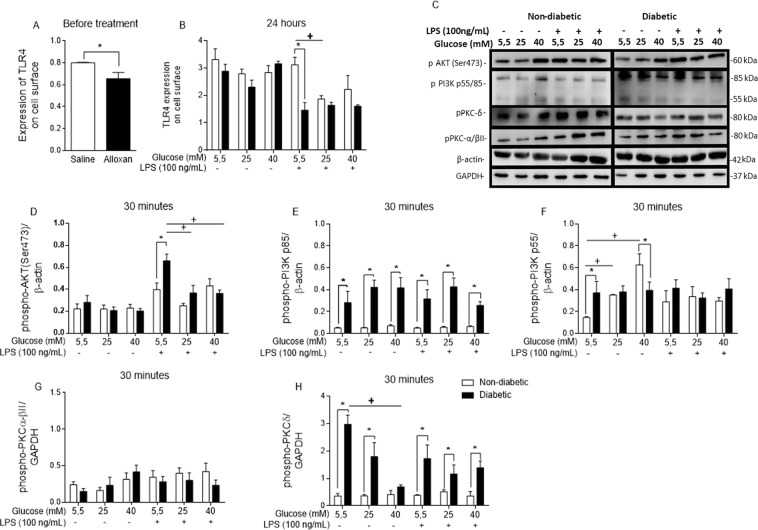
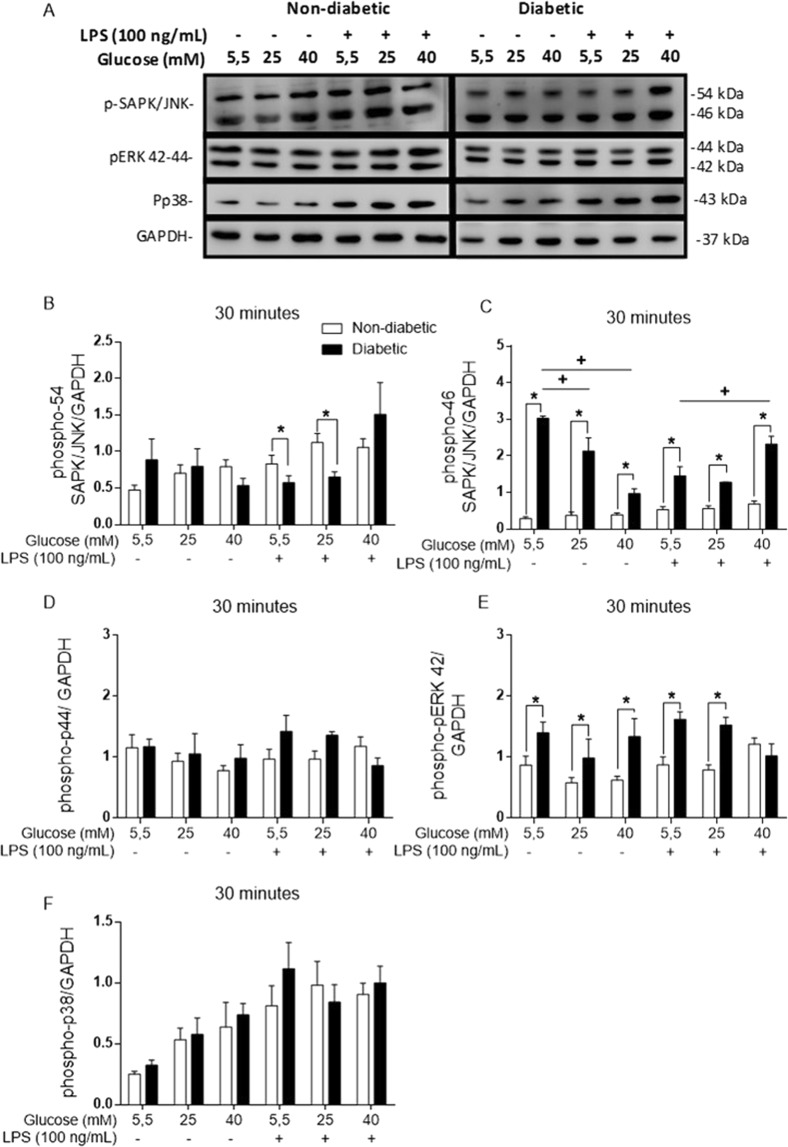
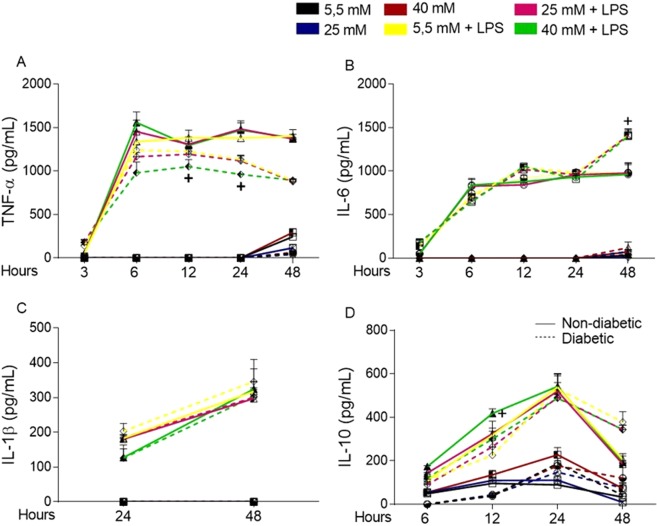
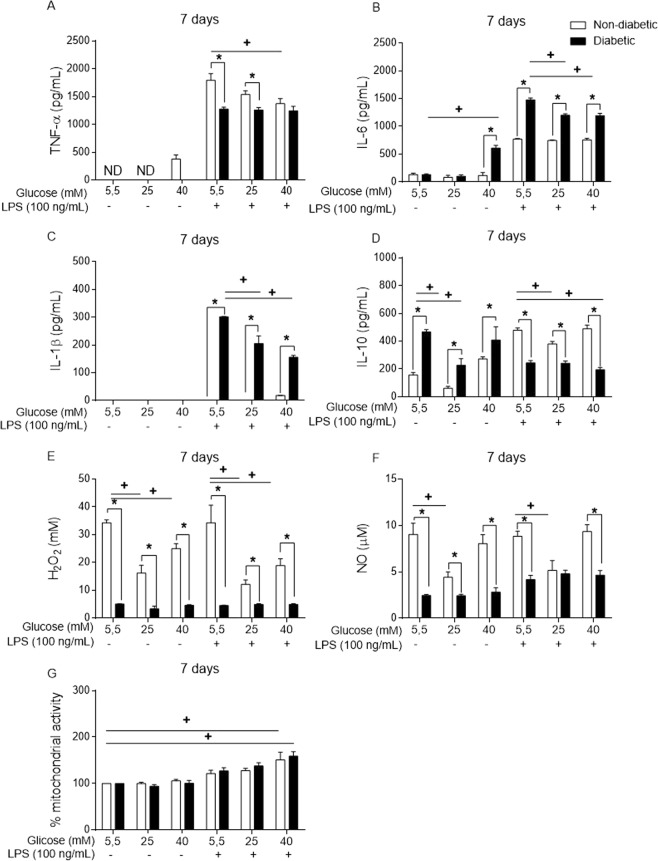
Macrophages may be a crucial aspect of diabetic complications associated with the inflammatory response. In this study, we examined how hyperglycaemia, a common aspect of diabetes, modulates bone marrow-derived macrophages (BMDMs) under an inflammatory stimulus. To perform this study, BMDMs from non-diabetic and diabetic (60 mg/kg alloxan, i.v.) male C57BL/6 mice (CEUA/FCF/USP-488) were cultured under normal (5.5 mM) and high glucose (HG, 25 or 40 mM) conditions and stimulated or not stimulated with lipopolysaccharide (LPS, 100 ng/mL). Compared to the BMDMs from the normoglycaemic mice, the LPS-stimulated BMDMs from the diabetic mice presented reduced TLR4 expression on the cell surface, lower phagocytic capacity, and reduced secretion of NO and lactate but greater oxygen consumption and greater phosphorylation of p46 SAPK/JNK, p42 ERK MAPK, pAKT and pPKC-δ. When the BMDMs from the non-diabetic mice were cultured under high-glucose conditions and stimulated with LPS, TLR4 expression was reduced on the cell surface and NO and H2O2 levels were reduced. In contrast, the diabetic BMDMs cultured under high glucose conditions presented increased levels of lactate and reduced phosphorylation of AKT, PKC-δ and p46 SAPK/JNK but enhanced phosphorylation of the p46 subunit of SAPK/JNK after LPS stimulation. High glucose levels appear to modify macrophage behaviour, affecting different aspects of diabetic and healthy BMDMs under the same LPS stimulus. Thus, hyperglycaemia leaves a glucose legacy, altering the basal steady state of macrophages.


Conflict of interest statement

The authors declare no competing interests.

Figures

Figure 1
Figure 1
BMDM viability is not modified by hyperglycaemia. (A) Gating strategy and F4/80 expression of BMDMs differentiated for 7 days. Viability evaluation by (B) PI staining after 24 hours of incubation and by MTT assay after (C) 24 hours and (D) 48 hours of incubation. *p < 0.05 compared to normoglycaemic BMDMs, +<0.05 compared with control glucose medium. Data are presented as the means ± SEM (N of at least 3).
Figure 2
Figure 2
Hyperglycaemia promotes changes in BMDM phenotypes. (A) Expression of F4/80, CD11b, CD38 and CD206 before 24 hours of treatment and (B) CD38 and (C) CD206 expression, (D) arginase activity, and (E) CD80, (F) CD86 and (G) MHC-II expression after 24 hours of incubation in normal (5.5 mM) or high glucose (25 or 40 mM) with or without LPS. *p < 0.05 compared to normoglycaemic BMDMs, +<0.05 compared with control glucose medium. Data are presented as the means ± SEM (N = at least 3).
Figure 3
Figure 3
Hyperglycaemia alters the energy metabolism of BMDMs. (A) Western blot membranes probed with anti-mouse AMPK, anti-mouse pS6 and anti-mouse β-actin primary antibodies. (B) Phospho-AMPK/β-actin ratio. (C) Phospho-S6/β-actin ratio. (D) Lactate release after 24 hours of incubation. (E) Oxygen consumption during the first hour of incubation. *p < 0.05 compared to normoglycaemic BMDMs, +<0.05 compared with control glucose medium. The images of the gels were cropped, with full-length blots/gels presented in Supplementary Fig. S1. The samples were derived from the same experiment, and the gels/blots were processed in parallel. Data are presented as the means ± SEM (N of at least 3).
Figure 4
Figure 4
Phagocytosis and reactive hydrogen species production is impaired under hyperglycaemia. (A) Phagocytosis of opsonized RBCs. H2O2 levels in the supernatant of BMDMs cultured in normal (5.5 mM) or high glucose (25 or 40 mM) with or without LPS (100 ng/mL) for (B) 24 hours or (C) 48 hours. *p < 0.05 compared to normoglycaemic BMDMs, +<0.05 compared with control glucose medium. Data are presented as the means ± SEM (N = 3).
Figure 5
Figure 5
LPS-TLR4 intracellular signalling is disrupted by hyperglycaemia. TLR4 cell surface expression (A) before and (B) after 24 hours of incubation with different glucose concentrations with or without LPS. (C) Western blot membrane probed with anti-phospho-AKT, anti-phospho-PI3K p85/p55, anti-phospho-PKC-α/βII, anti-phospho-PKC-δ, anti-mouse β-actin, and anti-mouse GAPDH primary antibodies. (D) Phospho-AKT/β-actin ratio. (E,F) Phospho-PI3k p85/p55/β-actin ratios. (G) Phospho-PKC-α/βII/GAPDH ratio. (H) Phospho-PKC-δ/GAPDH ratio. *p < 0.05 compared to normoglycaemic BMDMs, +<0.05 compared with control glucose medium. The images of the gels were cropped, with full-length blots/gels presented in Supplementary Fig. S2. The samples were derived from the same experiment, and the gels/blots were processed in parallel. Data are presented as the means ± SEM (N of at least 3).
Figure 6
Figure 6
MAPKs are phosphorylated at different levels in diabetic BMDMs. (A) Western blot membrane probed with anti-phospho-SAPK/JNK, anti-phospho-42/44, anti-phospho-P38 and anti-GAPDH primary antibodies. (B) Phospho-SAPK/JNK p54/GAPDH ratio. (C) Phospho-SAPK/JNK p46/GAPDH ratio. (D) Phospho-p44/GAPDH ratio. (E) Phospho-p42/GAPDH ratio. (F) Phospho-P38/GAPDH ratio. *p < 0.05 compared to normoglycaemic BMDMs, +<0.05 compared with control glucose medium. The images of the gels were cropped, with full-length blots/gels presented in Supplementary Fig. S3. The samples were derived from the same experiment, and the gels/blots were processed in parallel. Data are presented as the means ± SEM (N = 4).
Figure 7
Figure 7
Short-term exposure to high glucose promotes a slight modification in the cytokine release into the supernatant of BMDMs cultured under normal (5.5 mM) or high glucose (25 or 40 mM) conditions with or without LPS (100 ng/mL). (A) TNF-α, (B) IL-6, (C) IL-1β and (D) IL-10 levels. *p < 0.05 compared to normoglycaemic BMDMs, +<0.05 compared with control glucose medium. Data are presented as the means ± SEM (N = 6).
Figure 8
Figure 8
Long-term exposure to high glucose levels promotes the modification of inflammatory mediator release into the supernatant of BMDMs. (A) TNF-α, (B) IL-6, (C) IL-1β, (D) IL-10, (E) H2O2 and (F) NO levels. (G) Viability measured by MTT assay after 7 days of incubation. *p < 0.05 compared to normoglycaemic BMDMs, +<0.05 compared with control glucose medium. Data are presented as the means ± SEM (N = 6).

References

    1. Mosser DM, Edwards JP. Exploring the full spectrum of macrophage activation. Nat. Rev. Immunol. 2008;8:958–969. doi: 10.1038/nri2448. - DOI - PMC - PubMed
    1. Glass CK, Natoli G. Molecular control of activation and priming in macrophages. Nat. Immunol. 2015;17:26–33. doi: 10.1038/ni.3306. - DOI - PMC - PubMed
    1. Forbes JM, Cooper ME. Mechanisms of diabetics complications. Physiol Rev. 2013;93:137–188. doi: 10.1152/physrev.00045.2011. - DOI - PubMed
    1. Mantovani A. From phagocyte diversity and activation to probiotics: Back to Metchnikoff. Eur. J. Immunol. 2008;38:3269–3273. doi: 10.1002/eji.200838918. - DOI - PubMed
    1. Hagemann T, Lawrence T, Mcneish I. “Re-educating” tumor-associated macrophages by targeting NF-kappa B. J. Exp. Med. 2008;205:1261–1268. doi: 10.1084/jem.20080108. - DOI - PMC - PubMed

Publication types

MeSH terms