. 2019 Aug 7;10(1):3552.
doi: 10.1038/s41467-019-11514-0.

Visualisation of dCas9 target search in vivo using an open-microscopy framework

Affiliations

Visualisation of dCas9 target search in vivo using an open-microscopy framework

Koen J A Martens et al. Nat Commun. .

Abstract

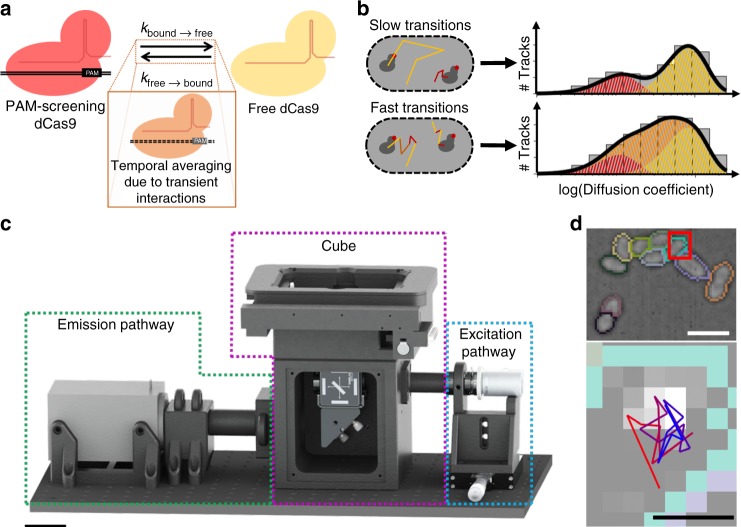
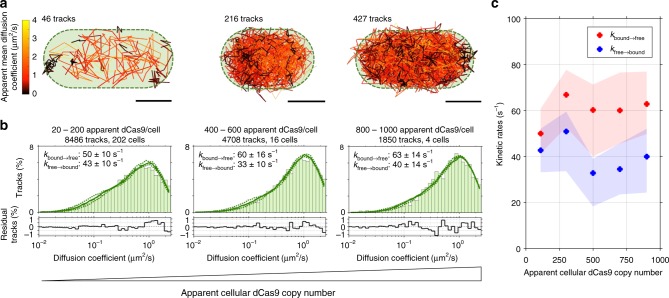
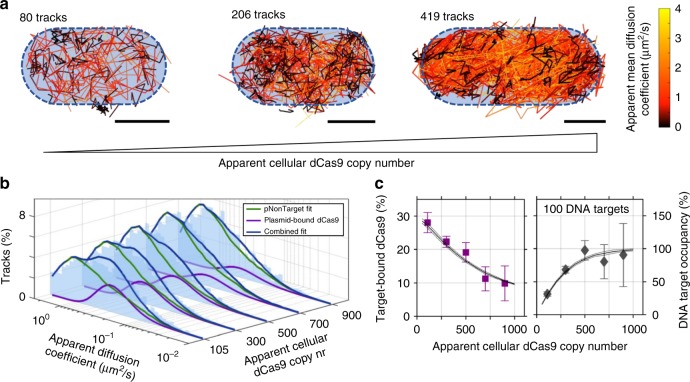
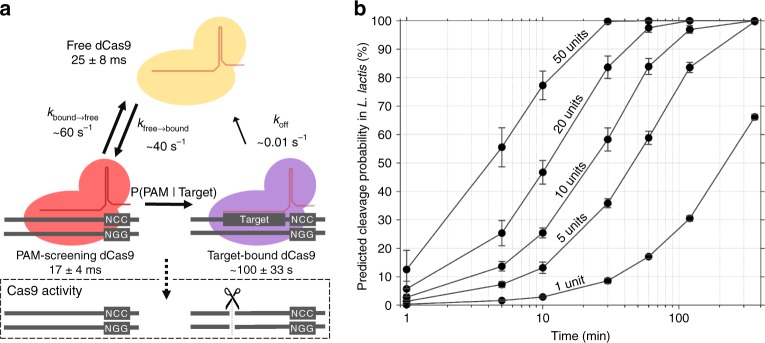
CRISPR-Cas9 is widely used in genomic editing, but the kinetics of target search and its relation to the cellular concentration of Cas9 have remained elusive. Effective target search requires constant screening of the protospacer adjacent motif (PAM) and a 30 ms upper limit for screening was recently found. To further quantify the rapid switching between DNA-bound and freely-diffusing states of dCas9, we developed an open-microscopy framework, the miCube, and introduce Monte-Carlo diffusion distribution analysis (MC-DDA). Our analysis reveals that dCas9 is screening PAMs 40% of the time in Gram-positive Lactoccous lactis, averaging 17 ± 4 ms per binding event. Using heterogeneous dCas9 expression, we determine the number of cellular target-containing plasmids and derive the copy number dependent Cas9 cleavage. Furthermore, we show that dCas9 is not irreversibly bound to target sites but can still interfere with plasmid replication. Taken together, our quantitative data facilitates further optimization of the CRISPR-Cas toolbox.


Conflict of interest statement

The authors declare no competing interests.

Figures

Fig. 1
Fig. 1
Probing cellular dynamics of dCas9 on an open-source microscope using sptPALM. a Simplified expected dynamic behaviour of dCas9 in absence of DNA target sites. The protein can be temporarily bound to DNA (PAM screening), or diffuse freely in cytoplasm, with two kinetic rates governing the dynamics. If the interaction is on a similar timescale as the detection time, a temporal averaging due to transient interactions is expected. b If the dynamic transitions are slow with respect to the camera frame time used in sptPALM, the obtained diffusional data can be fitted with a static model (top), which assumes that every protein is either free (yellow) or DNA-bound (red), but does not interchange. If the dynamic transitions are as fast or faster than the frame time used, Monte-Carlo diffusion distribution analysis (MC-DDA; bottom) can fit the diffusional data. In MC-DDA, dCas9 can interchange between the two states, resulting in a broader distribution. c Render of the open-source miCube super-resolution microscope. The excitation components, main cube, and emission components are indicated in blue, magenta, and green, respectively. Details are provided in the “Methods” section. Scale bar represents 5 cm. d Brightfield images of L. lactis used for computationally obtaining the outline of the cells via watershed (top), and raw single molecule data (bottom; red outline in top is magnified) as obtained on the miCube as part of a typical experiment, overlaid with the determined track where this single molecule belongs to (starting at red, ending at blue). Scale bars represent 2.5 µm (top) or 500 nm (bottom)
Fig. 2
Fig. 2
sptPALM of dCas9-PAmCherry2 in pNonTarget L. lactis with increasing dCas9 concentration. a Identified tracks in single pNonTarget L. lactis cells. Tracks are colour-coded based on their diffusion coefficient. Three separate cells are shown with increasing cellular concentration of dCas9. Green dotted outline is an indication for the cell membrane. Scale bars represent 500 nm. b Diffusion coefficient histograms (light green) belonging to 20–200, 400–600, and 800–1000 dCas9 copy numbers, from left to right. Histograms are fitted (dark green line) with a theoretical description of state-transitioning particles between a mobile and immobile state (dashed line represents 95% confidence interval based on bootstrapping the original data). Five diffusion coefficient histograms (Supplementary Fig. 4) were globally fitted with a single free diffusion coefficient (2.0 ± 0.1 µm2/s; mean ± standard deviation), a single value for the localization error (σ = 38 ± 3 nm = 0.15 ± 0.03 µm2/s), and 5 sets of kbound→free and kfree→bound values (indicated in the figures). Residuals of the fit are indicated below the respective distribution. c kbound→free (red) and kfree→bound (blue) plotted as function of the apparent cellular dCas9 copy number. Solid dots show the fits of the actual data; filled areas indicate the 95% confidence intervals obtained from the bootstrapped iterations of fitted MC-DDAs with 20,000 simulated proteins. Source data are provided as a Source Data file
Fig. 3
Fig. 3
sptPALM of dCas9-PAmCherry2 in pTarget L. lactis shows target-binding behaviour of dCas9. a Identified tracks in individual pTarget L. lactis cells. Tracks are colour-coded based on their diffusion coefficient. Three separate cells are shown with increasing dCas9 concentration. Blue dotted outline is an indication for the cell membrane. Scale bars represent 500 nm. b Diffusion coefficient histograms (light blue) are fitted (dark blue line) with a combination of the respective fit of pNonTarget L. lactis cells (green line), along with a single globally fitted population corresponding to target-bound dCas9 (purple) at 0.38 ± 0.04 µm2/s (mean ± standard deviation). c Left: The population size of the plasmid-bound dCas9 decreases as a function of the cellular dCas9 copy number. The error bar of the measurement is based on the 95% confidence interval determined by bootstrapping; the solid line is a model fit with 20 plasmids, with a 95% confidence interval determined by repeating the model simulation. Right: Occupancy of DNA targets by dCas9 based on 20 target plasmids (100 DNA target sites), based on the same data as presented in the left figure. Source data are provided as a Source Data file
Fig. 4
Fig. 4
Extrapolation of the dCas9 dynamic model to assess single target cleavage by Cas9. a The proposed model surrounding dCas9 interaction with the obtained kinetic rates. Free dCas9 (yellow) in the cytoplasm interact with PAM sequences (5’-NGG-3’) on average every 25 ms. If the PAM is not in front of a target sequence (red), only PAM-screening will occur for on average 17 ms. If the PAM happens to be in front of a target, the dCas9 will be target-bound (purple). We extend this model to predict Cas9 cleavage under conditions where target-bound Cas9 will always cleave the target DNA. b Calculated predicted probability that a single target in the L. lactis genome is cleaved after a certain period of time with a certain cellular Cas9 copy number, based on the model shown in a. Error bars indicate standard deviation calculated from iterations of the model

References

    1. Qi LS, et al. Repurposing CRISPR as an RNA-guided platform for sequence-specific control of gene expression. Cell. 2013;152:1173–1183. doi: 10.1016/j.cell.2013.02.022. - DOI - PMC - PubMed
    1. Komor AC, Badran AH, Liu DR. CRISPR-based technologies for the manipulation of eukaryotic genomes. Cell. 2017;168:20–36. doi: 10.1016/j.cell.2016.10.044. - DOI - PMC - PubMed
    1. Jiang W, Bikard D, Cox D, Zhang F, Marraffini LA. RNA-guided editing of bacterial genomes using CRISPR-Cas systems. Nat. Biotechnol. 2013;31:233–239. doi: 10.1038/nbt.2508. - DOI - PMC - PubMed
    1. Liu J-J, et al. CasX enzymes comprise a distinct family of RNA-guided genome editors. Nature. 2019;566:218–223. doi: 10.1038/s41586-019-0908-x. - DOI - PMC - PubMed
    1. Sapranauskas R, et al. The Streptococcus thermophilus CRISPR/Cas system provides immunity in Escherichia coli. Nucleic Acids Res. 2011;39:9275–9282. doi: 10.1093/nar/gkr606. - DOI - PMC - PubMed

Publication types

MeSH terms

Substances