. 2019 Aug 7;9(1):11433.
doi: 10.1038/s41598-019-47389-w.

Electrical stimulation shifts healing/scarring towards regeneration in a rat limb amputation model

Affiliations

Electrical stimulation shifts healing/scarring towards regeneration in a rat limb amputation model

K M C Oliveira et al. Sci Rep. .

Abstract

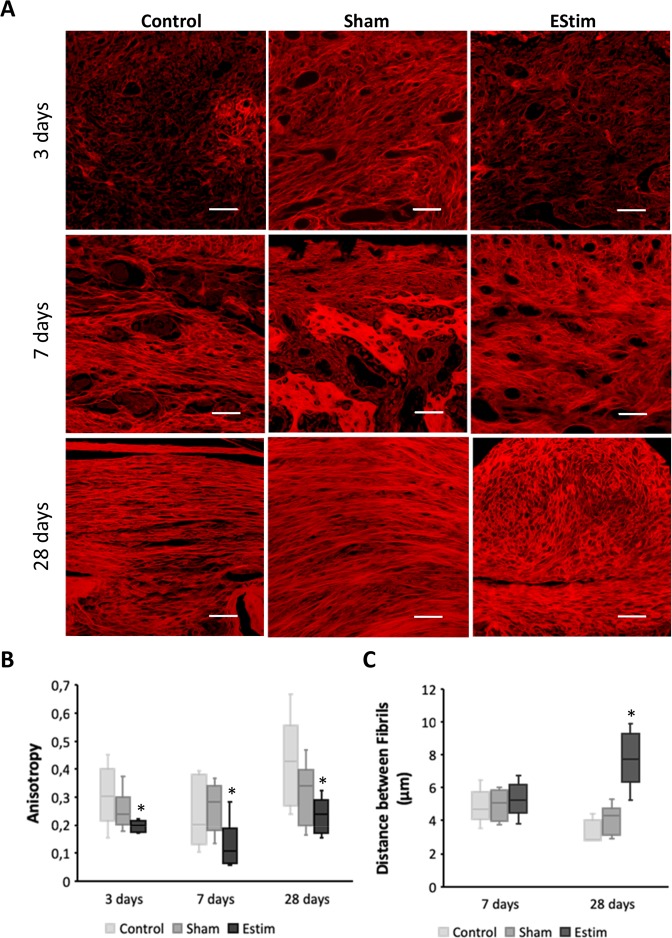
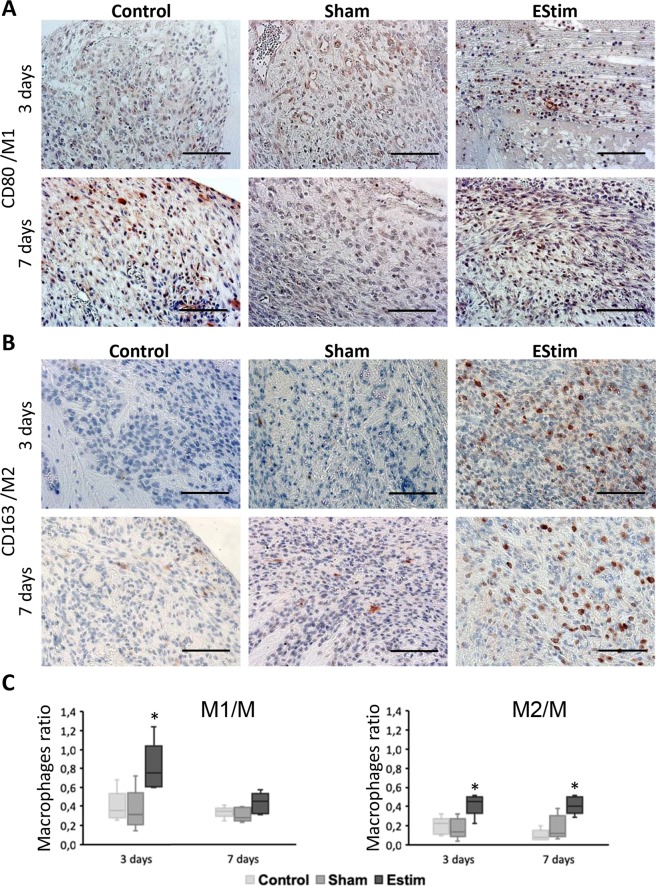
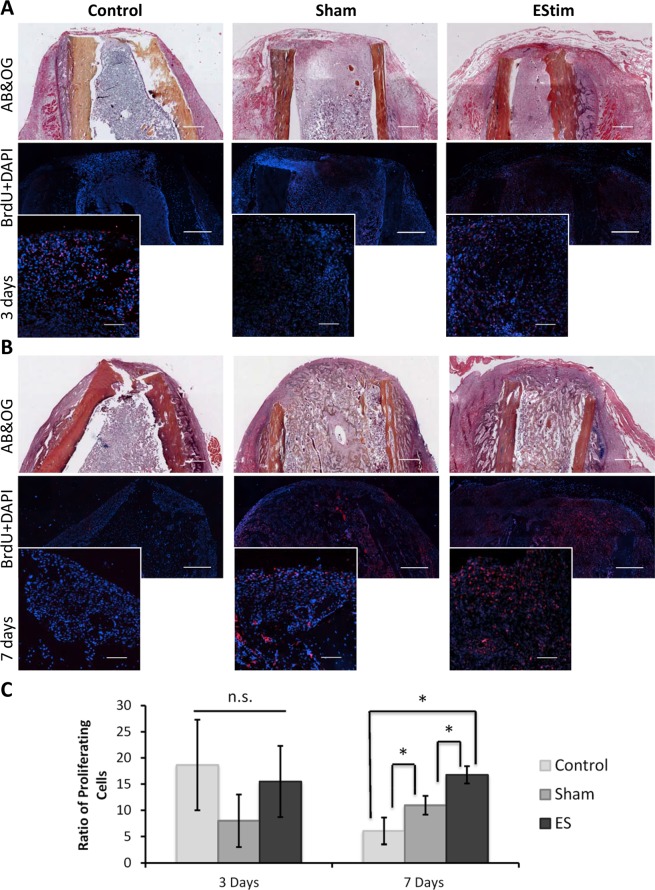
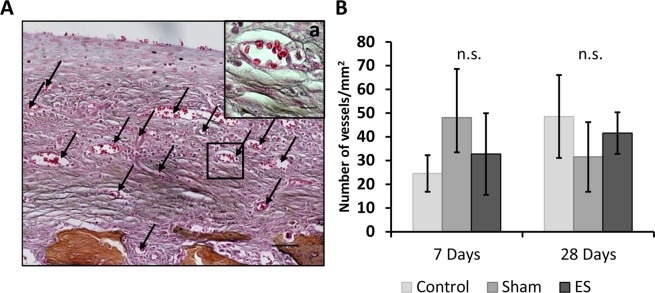
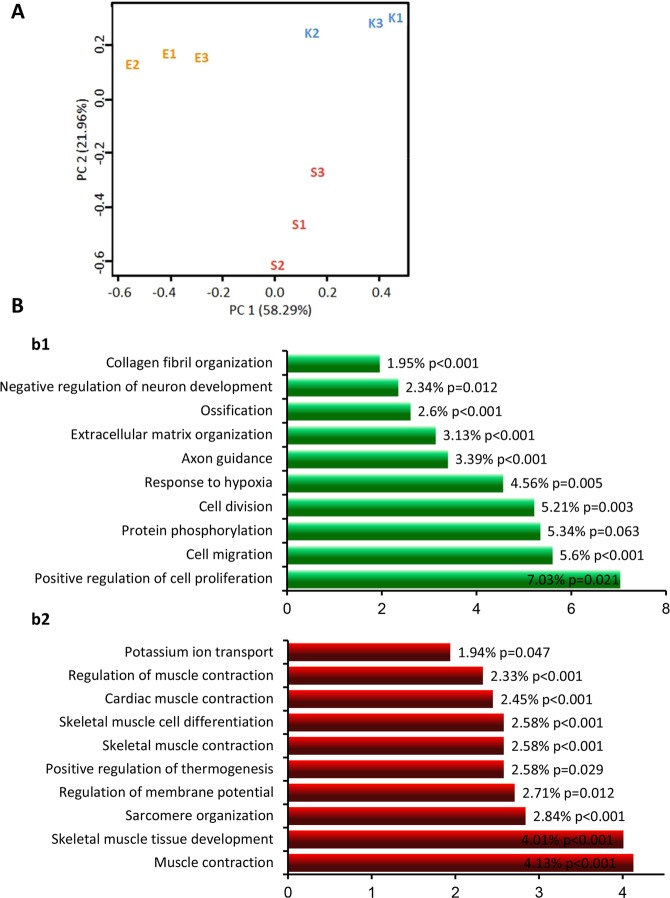
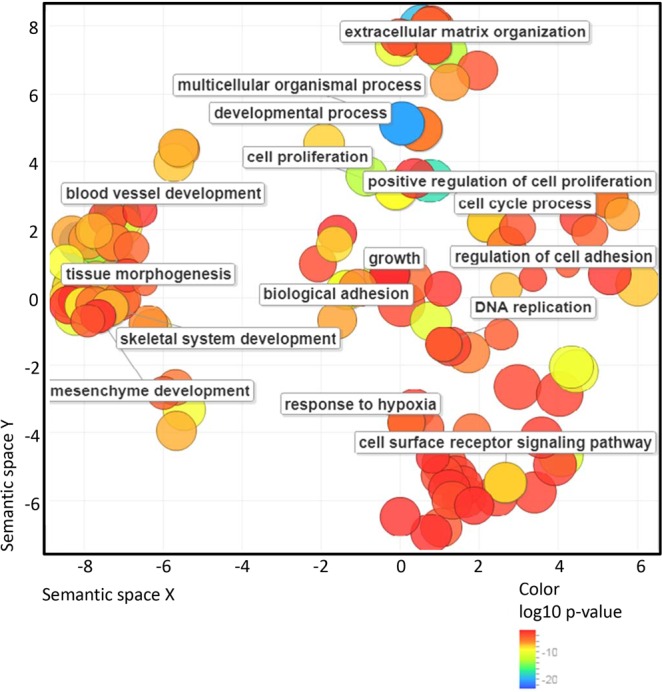
Different species respond differently to severe injury, such as limb loss. In species that regenerate, limb loss is met with complete restoration of the limbs' form and function, whereas in mammals the amputated limb's stump heals and scars. In in vitro studies, electrical stimulation (EStim) has been shown to promote cell migration, and osteo- and chondrogenesis. In in vivo studies, after limb amputation, EStim causes significant new bone, cartilage and vessel growth. Here, in a rat model, the stumps of amputated rat limbs were exposed to EStim, and we measured extracellular matrix (ECM) deposition, macrophage distribution, cell proliferation and gene expression changes at early (3 and 7 days) and later stages (28 days). We found that EStim caused differences in ECM deposition, with less condensed collagen fibrils, and modified macrophage response by changing M1 to M2 macrophage ratio. The number of proliferating cells was increased in EStim treated stumps 7 days after amputation, and transcriptome data strongly supported our histological findings, with activated gene pathways known to play key roles in embryonic development and regeneration. In conclusion, our findings support the hypothesis that EStim shifts injury response from healing/scarring towards regeneration. A better understanding of if and how EStim controls these changes, could lead to strategies that replace scarring with regeneration.


Conflict of interest statement

The authors declare no competing interests.

Figures

Figure 1
Figure 1
Extracellular matrix (ECM) deposition at the distal end of limb stumps for all groups at different time points. (A) Representative images of Picro Sirius Red stained collagen network at the distal end of limb stumps for control, sham and EStim groups at 3, 7, and 28 days post amputation (Scale bar = 100 µm). (B) Graph showing lower anisotropy (parallelism between fibrils) in electrically stimulated stump tissue compared to non-treated stumps, at all the time points evaluated. (C) Graph showing distance between fibrils measured at days 7 and 28 post-amputation. The greatest distance between fibrils was shown in EStim treated tissue at day 28. *p ≤ 0.05.
Figure 2
Figure 2
Immunohistochemistry analysis of CD80 (marker for M1 macrophages) and CD163 (marker for M2 macrophages) in limb stumps at 3 and 7 days post-amputation. (A) Representative images of immunohistochemical staining showing higher incidence of M1 macrophages at day 3 in EStim treated tissues (Scale bar = 100 µm). (B) Representative images showing higher incidence of M2 macrophages at days 3 and 7 in EStim treated tissues (Scale bar = 100 µm). (C) Ratio of M1 and M2 macrophages (normalized to M macrophages) at the distal end of the stump for all groups tested at 3 and 7 days post-amputation; *p < 0.05.
Figure 3
Figure 3
BrdU analysis of cell proliferation in the distal end of the stump in control, sham and EStim treated samples. (A) Top and middle rows represent overview of day 3 post-amputation control, sham and EStim stump sections stained with AB&OG and anti-BrdU antibody (red) counterstained with DAPI (blue) respectively (4×; Scale bar = 500 µm). Bottom row shows high magnification images of BrdU stainings (20×; Scale bar = 50 µm). (B) Representative images of stump sections from control, sham and EStim groups 7 days post-amputation. Top and middle rows show an overview of samples stained with AB&OG and anti-BrdU antibody (red) and counterstained with DAPI (blue) respectively (4×; Scale bar = 500 µm). Bottom row displays high magnification images (20×; Scale bar = 100 µm); (C) Ratio of proliferative cells measured at the distal end of the stump at days 3 and 7 post-amputation. n.s. - non significant (p ≥ 0.05); *p < 0.05.
Figure 4
Figure 4
New vessel growth in the distal area of the EStim rat limb stumps 28 days post amputation. (A) Representative image displaying vascular ingrowth in the distal end of the EStim stump at day 28 post-amputation. (AB&OG staining; Scale bar = 100 µm). a – High magnification (40×; Scale bar = 10 µm) of new vessel. (B) Graph indicating density of new vessels at the distal end of the stumps in all 3 groups 7- and 28- days post amputation. n.s. - non significant (p ≥ 0.05).
Figure 5
Figure 5
mRNA expression profiles in EStim treated limb stumps and non-treated controls (control and sham) are distinct. (A) Principle component analysis of normalized read counts showed strong effect of EStim treatment. Biological replicates for EStim (E1, E2, E3), sham (S1, S2, S3) and control (K1, K2, K3) samples are shown. (B) Top-10 significantly enriched biological processes in EStim and sham transcriptomes (FunReach analysis). Each the EStim and sham transcriptomes were tested against Rattus Norvegicus UniProt database, the top 10 most highly represented biological processes and the percentage of proteins predicted to belong to each category are shown for EStim (b1) and sham (b2) samples. The numbers shown at the right side of each bar indicated the % of genes (proteins) involved in each term and p-Value.
Figure 6
Figure 6
Gene Ontology (GO) analysis of up-regulated in EStim genes using REVIGO. The scatter plot shows the cluster representatives (terms remaining after reducing redundancy) in a two-dimensional space derived by applying multi-dimensional scaling to a matrix of GO terms semantic similarities. Bubble color indicates the p-value (legend in lower right-hand corner).

References

    1. Carlson, B. M. Principles of regenerative biology (Elsevier/Academic, Amsterdam, London, 2007).
    1. Simon A, Tanaka EM. Limb regeneration. Wiley interdisciplinary reviews. Developmental biology. 2013;2:291–300. doi: 10.1002/wdev.73. - DOI - PubMed
    1. Carlson BM. Stimulation of regeneration in mammals: pipe dream or realistic goal? Wound repair and regeneration: official publication of the Wound Healing. Society [and] the European Tissue Repair Society. 1998;6:425–433. - PubMed
    1. Yu L, et al. BMP9 stimulates joint regeneration at digit amputation wounds in mice. Nature communications. 2019;10:424. doi: 10.1038/s41467-018-08278-4. - DOI - PMC - PubMed
    1. Harty M, Neff AW, King MW, Mescher AL. Regeneration or scarring: An immunologic perspective. Dev. Dyn. 2003;226:268–279. doi: 10.1002/dvdy.10239. - DOI - PubMed

Publication types