. 2019 Aug;572(7768):224-229.
doi: 10.1038/s41586-019-1447-1. Epub 2019 Aug 7.

Controlling organization and forces in active matter through optically defined boundaries

Affiliations

Controlling organization and forces in active matter through optically defined boundaries

Tyler D Ross et al. Nature. 2019 Aug.

Abstract

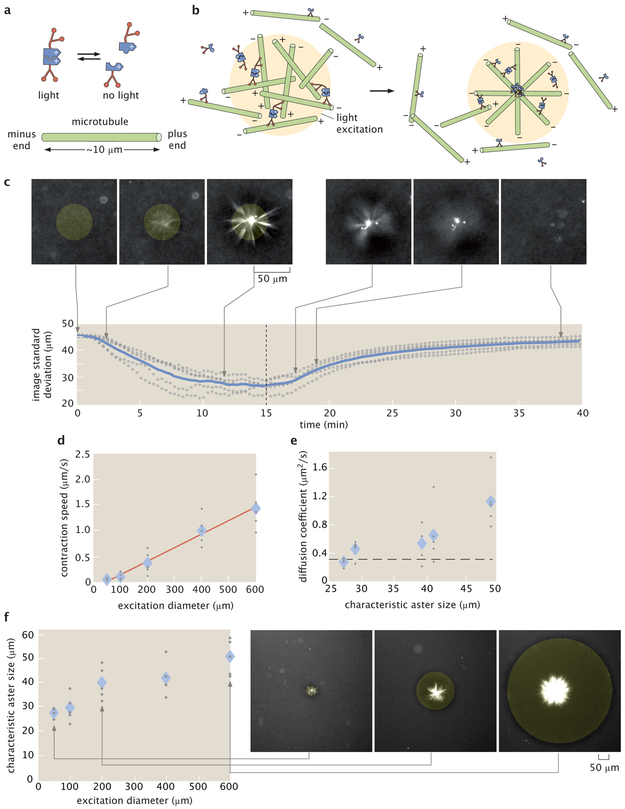
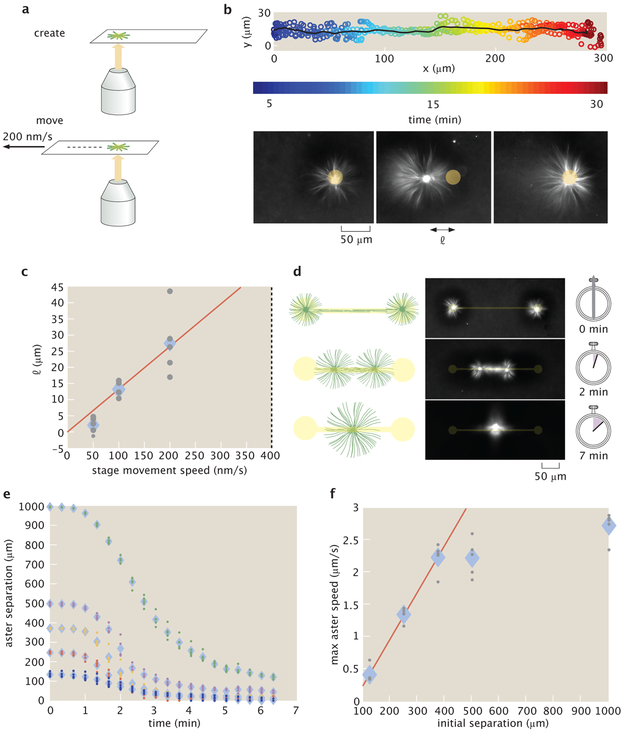
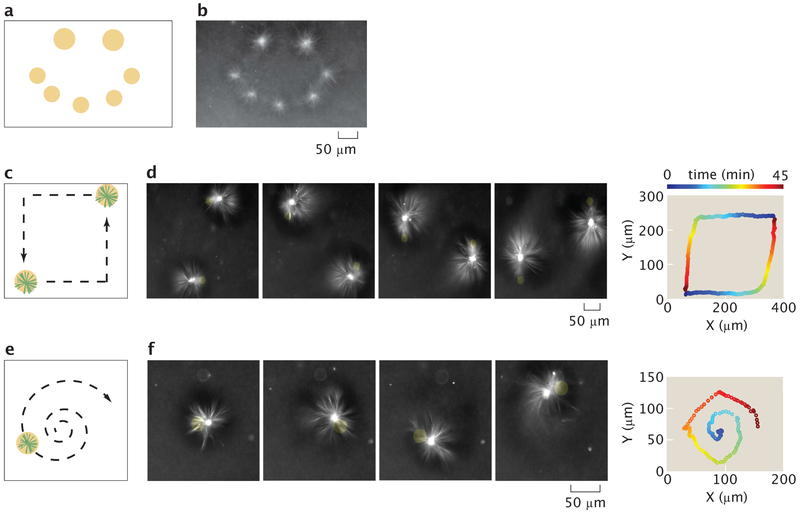
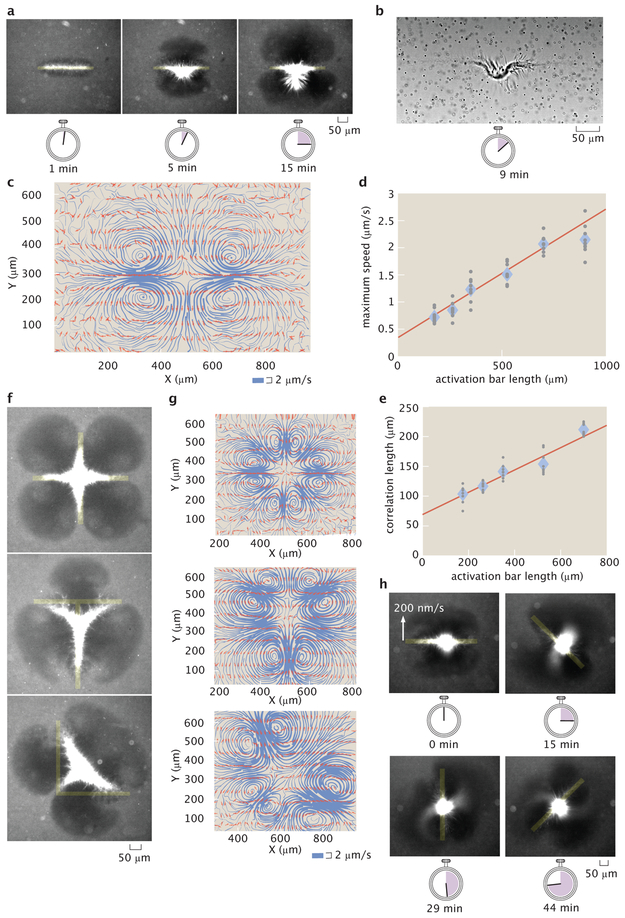
Living systems are capable of locomotion, reconfiguration and replication. To perform these tasks, cells spatiotemporally coordinate the interactions of force-generating, 'active' molecules that create and manipulate non-equilibrium structures and force fields of up to millimetre length scales1-3. Experimental active-matter systems of biological or synthetic molecules are capable of spontaneously organizing into structures4,5 and generating global flows6-9. However, these experimental systems lack the spatiotemporal control found in cells, limiting their utility for studying non-equilibrium phenomena and bioinspired engineering. Here we uncover non-equilibrium phenomena and principles of boundary-mediated control by optically modulating structures and fluid flow in an engineered system of active biomolecules. Our system consists of purified microtubules and light-activatable motor proteins that crosslink and organize the microtubules into distinct structures upon illumination. We develop basic operations-defined as sets of light patterns-to create, move and merge the microtubule structures. By combining these operations, we create microtubule networks that span several hundred micrometres in length and contract at speeds up to an order of magnitude higher than the speed of an individual motor protein. We manipulate these contractile networks to generate and sculpt persistent fluid flows. The principles of boundary-mediated control that we uncover may be used to study emergent cellular structures and forces and to develop programmable active-matter devices.


Figures

Figure 1:
Figure 1:
Light-switchable active matter system enables optical control over aster formation, decay and size. a, Schematic of light-dimerizable motors. b, Schematic of light-controlled reorganization of microtubules into an aster. c, Images of labeled microtubules during aster assembly and decay and corresponding image spatial standard deviation versus time. The blue line is the mean of 5 experiments and the gray dots represent individual experiments. The dashed line is when the activation light is removed, transitioning from creation to decay. d, Max contraction speed versus excitation diameter. The red line is a linear fit. e, Diffusion coefficients versus characteristic aster size. The characteristic size is the image spatial standard deviation at the 15 minute time point shown in (c). The dashed line represents the diffusion coefficient of a 7 μm microtubule (Supplementary Information 2.11). f, Aster characteristic size versus excitation diameter with representative images. In (d, e, f) the diamonds represent the mean of 5 experiments and the gray dots represent individual experiments. In (c, f), the yellow shaded disks represent the light pattern.
Figure 2:
Figure 2:
Moving and merging operations of asters with dynamic light patterns. a, Asters are moved relative to the slide by repositioning the microscope stage. b, Overlay of five individual trajectories of aster movement relative to slide moving at 200 nm/s. The line represents the mean trajectory. Time lapse images show the position of the aster relative to the light pattern. l is the displacement of the aster from center of the light pattern. c, l versus stage speed. The dotted line at 400 nm/s represents the escape velocity. The red line is a linear fit. d, Illustration of the aster merge operation by a connected excitation pattern and the corresponding time series of images. e, Distance between merging asters over time for different initial separations. f, Maximum speeds of asters as measured from (e). The red line is a linear fit to the first three data points. In (c, e, f) the diamonds represent the mean of 5 experiments and the dots represent individual experiments.
Figure 3:
Figure 3:
Operations for creating and moving asters are composed to make different desired patterns and trajectories. a, Sketch for using excitation cylinders to simultaneously pattern asters of different sizes. b, Resultant pattern of asters corresponding to (a). c, Illustration of simultaneous control of two different aster trajectories, as indicated by the dashed arrows. d, Time lapse and the 2D trace of the aster trajectories corresponding to (c). The trajectory trace is color-coded to represent progression in time. e, Dynamically projected spiral to illustrate curvilinear motion. f, time lapse and the 2D trace of the aster trajectory. Time is color coded as in (d).
Figure 4:
Figure 4:
Advective fluid flow is created and controlled with patterned light. a, Microtubule organization created by an activation bar that is a 350 μm × 20 μm rectangular light pattern. Time series demonstrate continuous contraction of microtubules towards the pattern center along the major axis. b, Brightfield image of (a) shows a contracting microtubule network and tracer particles used to measure fluid flow. c, Streamline plots of background buffer flow from (a). The streamline thickness represents the flow speed. The arrows indicate the flow direction. d, Averaged maximum flow speed versus activation bar length. e, Averaged correlation length (size) of flow field versus activation bar length. f, Superposition of activation bars generate different patterns of contractile microtubules. g, Corresponding streamline plots. h, Time lapse of a light pattern rotating with an edge speed of 200 nm/s. In (d, e) the diamonds represents the mean of 9 experiments and the gray dots represent individual experiments. The red line is a linear fit to the data.

References

    1. Marchetti MC et al. Hydrodynamics of soft active matter. Rev. Mod. Phys 85, 1143–1189 (2013).
    1. Dumont S & Prakash M Emergent mechanics of biological structures. Molecular Biology of the Cell 25, 3461–3465. issn: 1059–1524, 1939–4586 (2014). - PMC - PubMed
    1. Needleman D & Dogic Z Active matter at the interface between materials science and cell biology. Nature Reviews Materials 2, 17048 issn: 2058–8437 (2017).
    1. Nédélec FJ, Surrey T, Maggs AC & Leibler S Self-organization of microtubules and motors. Nature 389, 305 issn: 1476–4687 (1997). - PubMed
    1. Surrey T, Nédélec F, Leibler S & Karsenti E Physical Properties Determining SelfOrganization of Motors and Microtubules. Science 292, 1167–1171. issn: 0036–8075, 1095–9203 (2001). - PubMed

Publication types