. 2019 Aug;572(7770):481-487.
doi: 10.1038/s41586-019-1467-x. Epub 2019 Aug 7.

Opposing T cell responses in experimental autoimmune encephalomyelitis

Affiliations

Opposing T cell responses in experimental autoimmune encephalomyelitis

Naresha Saligrama et al. Nature. 2019 Aug.

Abstract

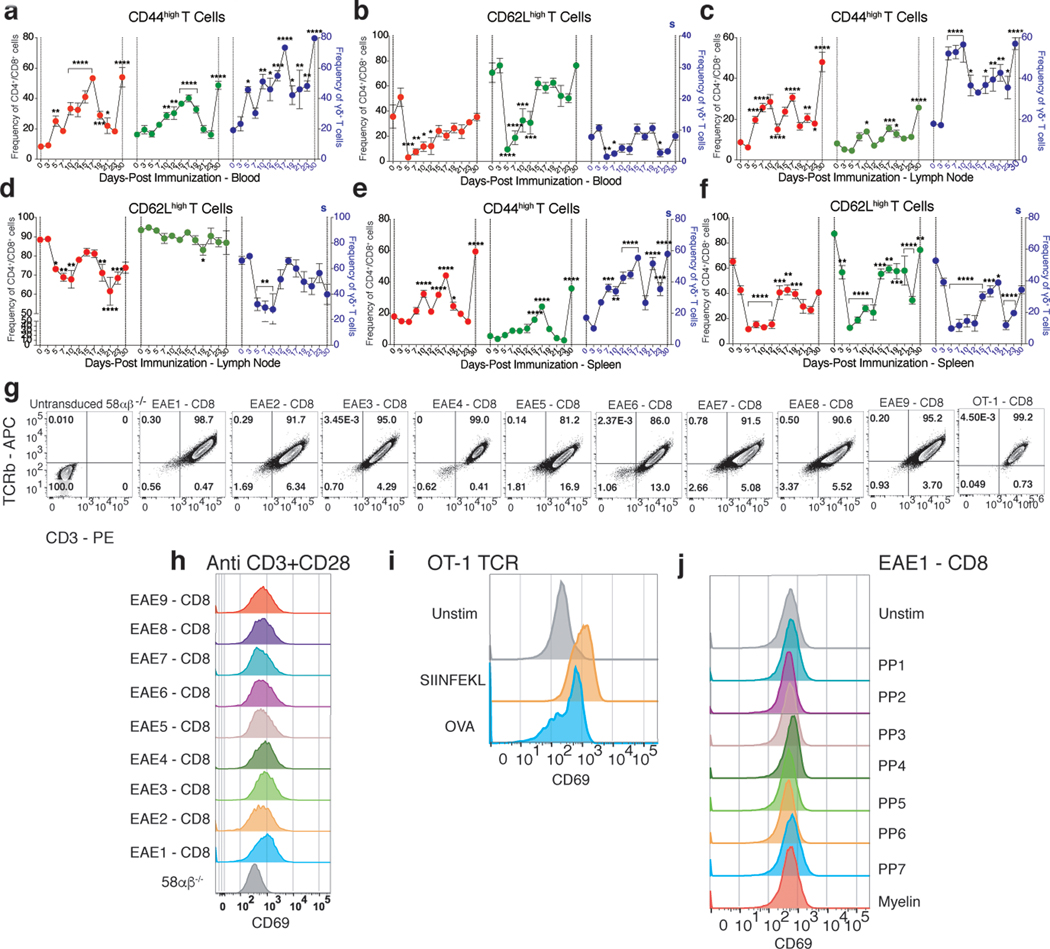
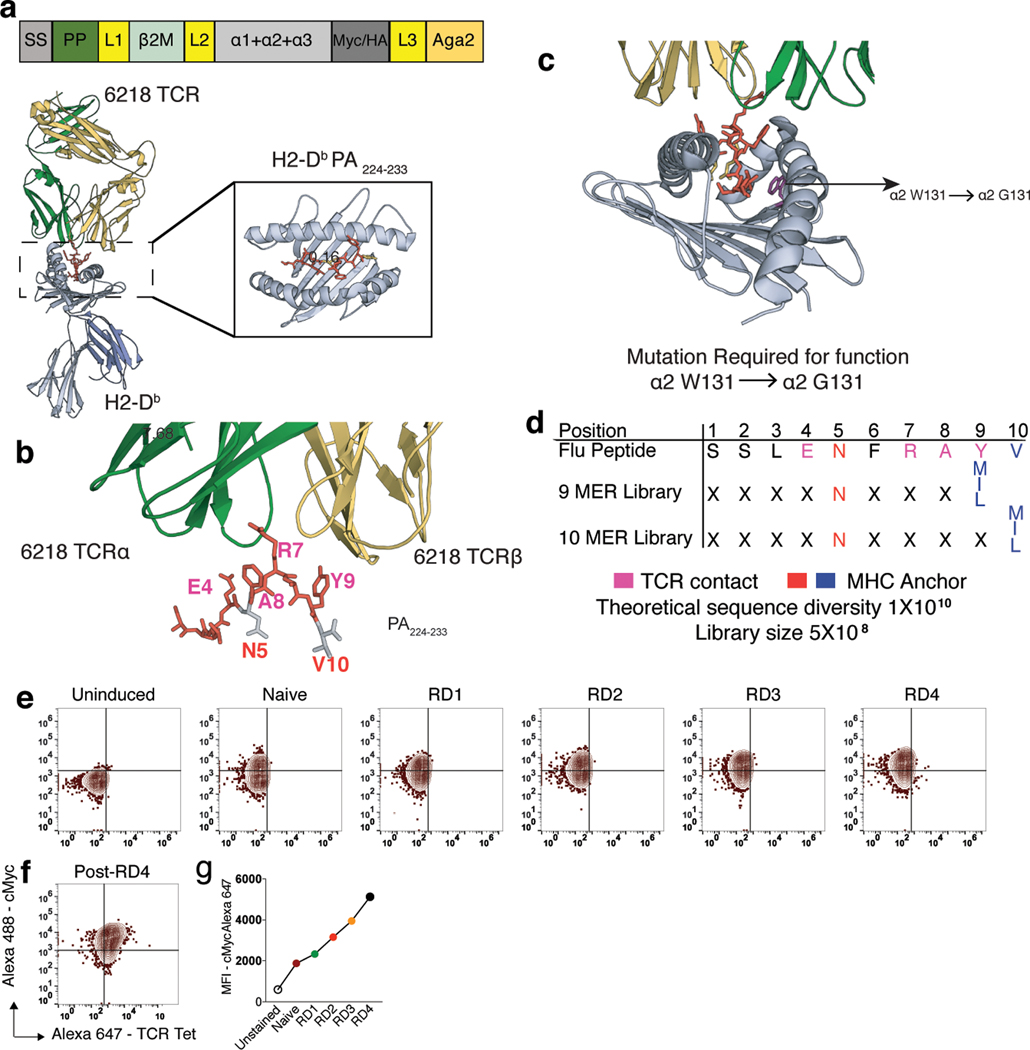
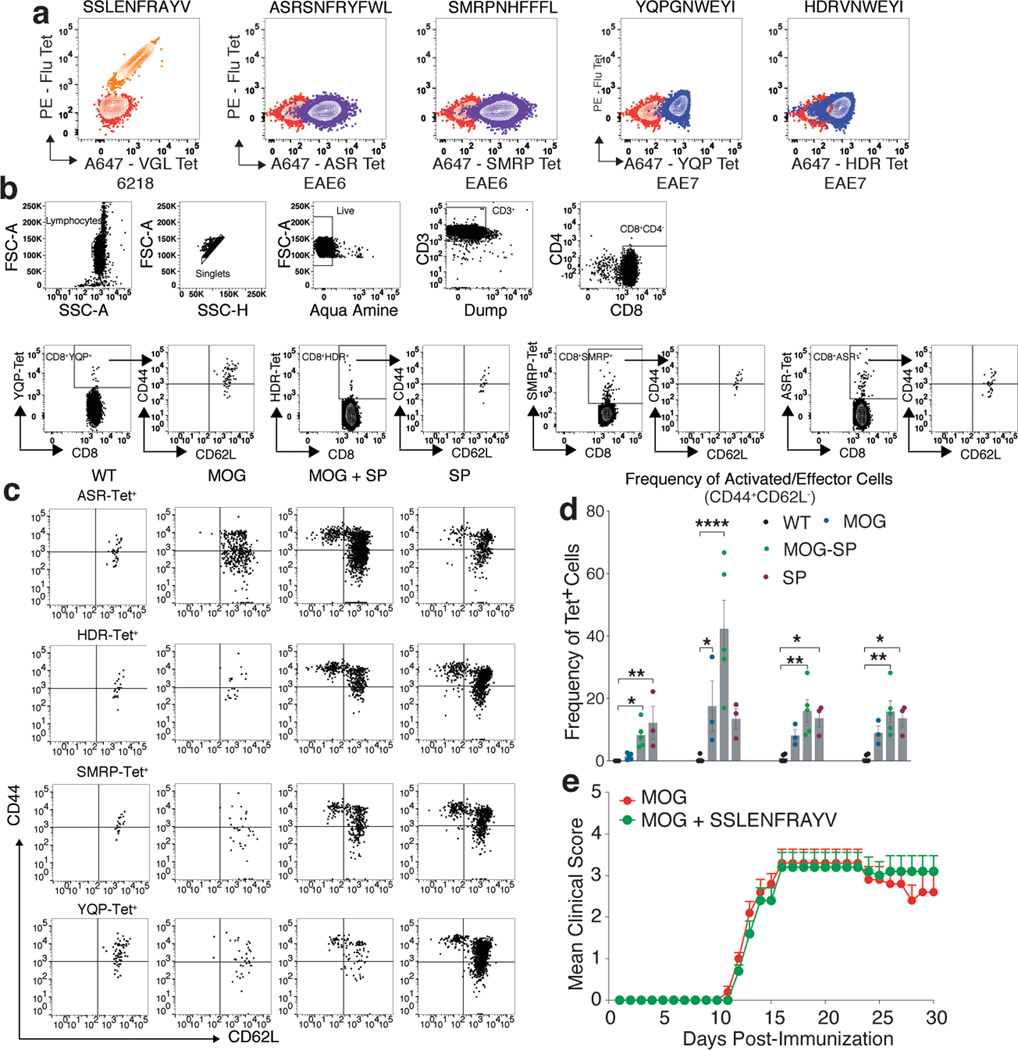
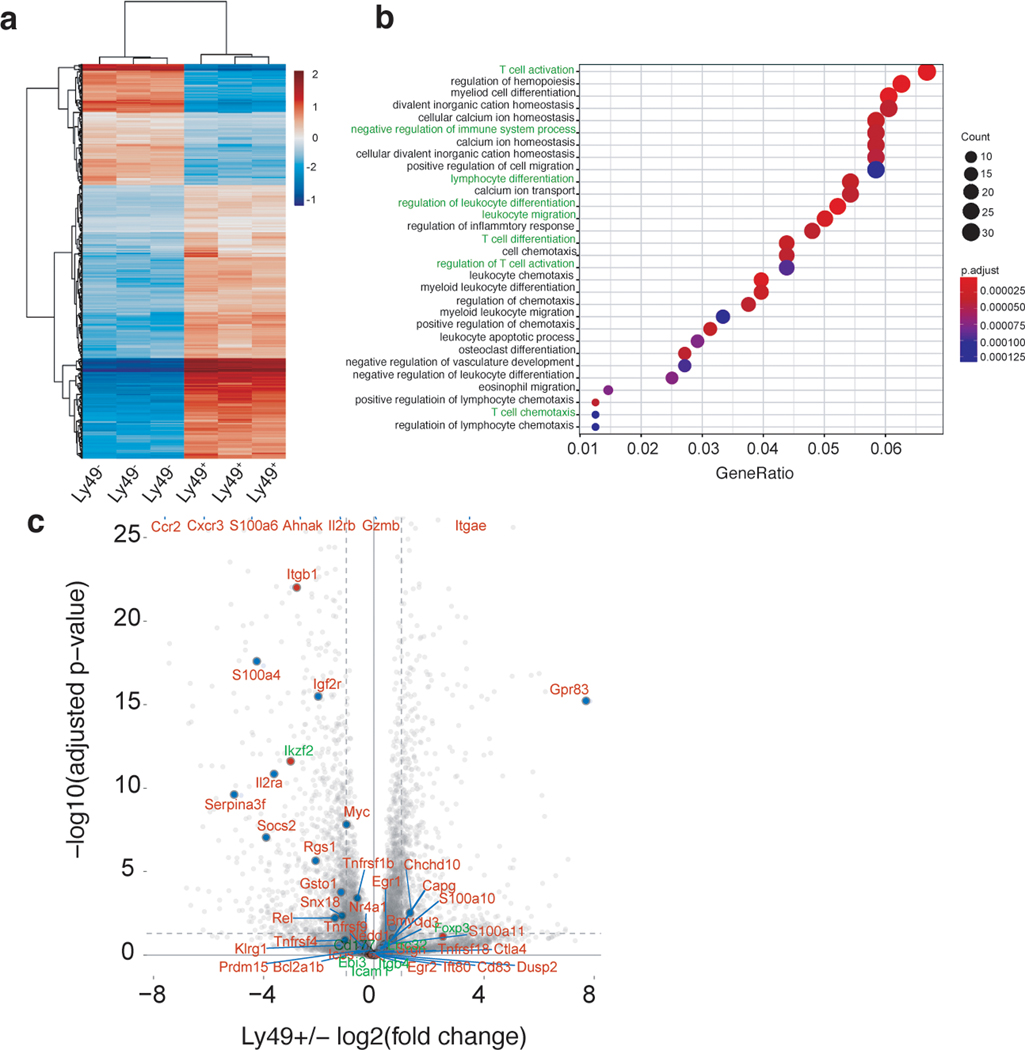
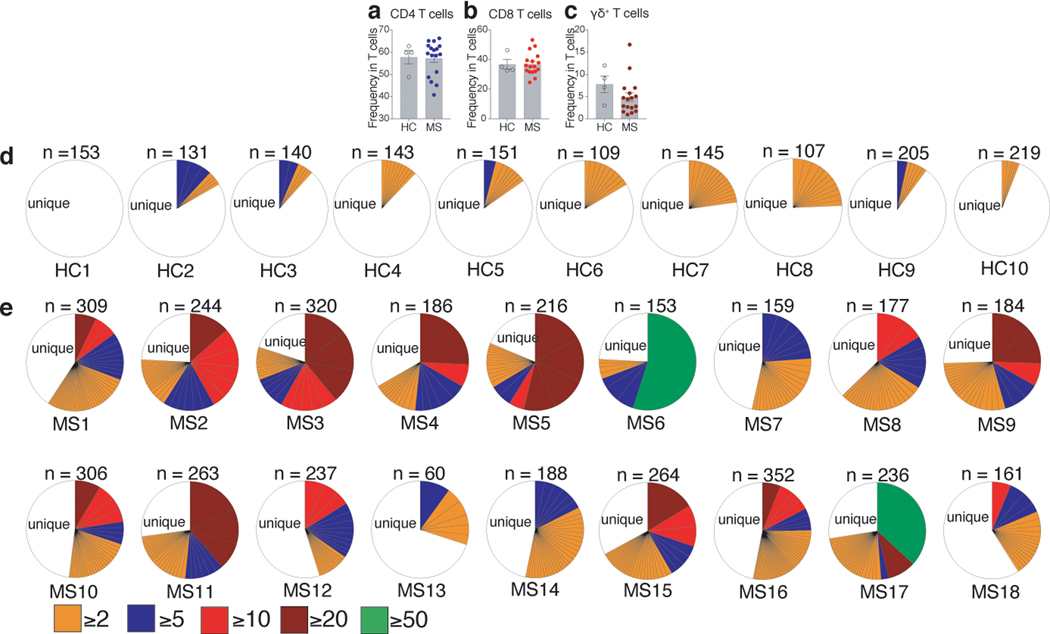
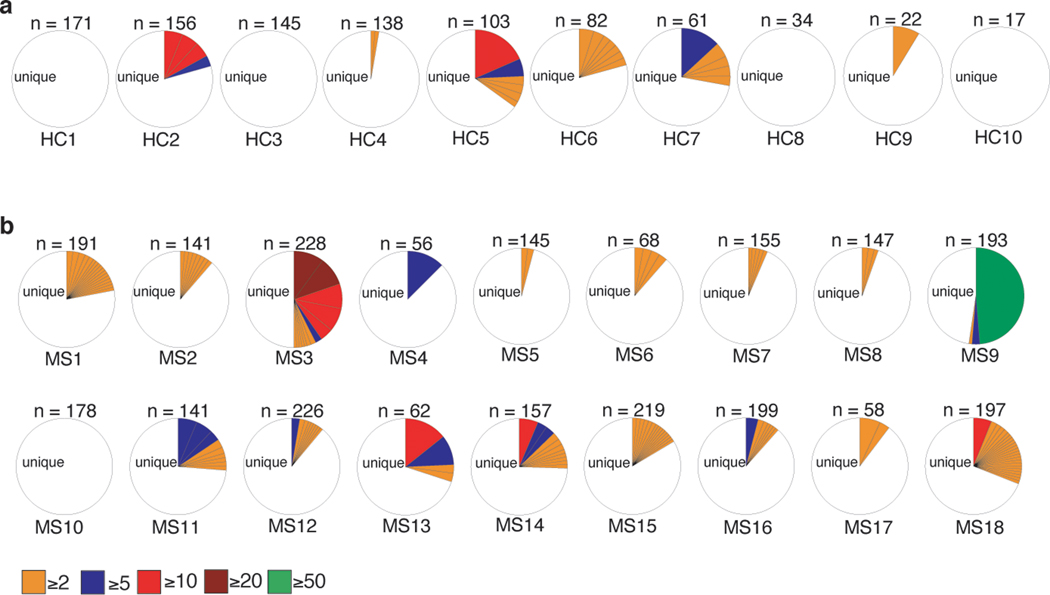
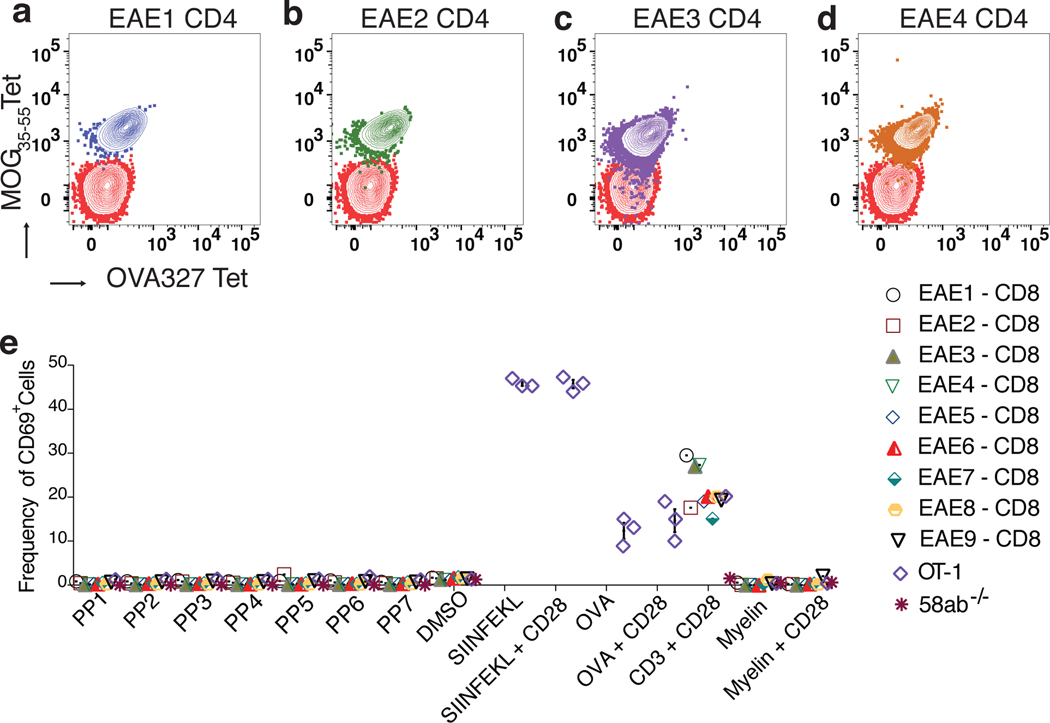
Experimental autoimmune encephalomyelitis is a model for multiple sclerosis. Here we show that induction generates successive waves of clonally expanded CD4+, CD8+ and γδ+ T cells in the blood and central nervous system, similar to gluten-challenge studies of patients with coeliac disease. We also find major expansions of CD8+ T cells in patients with multiple sclerosis. In autoimmune encephalomyelitis, we find that most expanded CD4+ T cells are specific for the inducing myelin peptide MOG35-55. By contrast, surrogate peptides derived from a yeast peptide major histocompatibility complex library of some of the clonally expanded CD8+ T cells inhibit disease by suppressing the proliferation of MOG-specific CD4+ T cells. These results suggest that the induction of autoreactive CD4+ T cells triggers an opposing mobilization of regulatory CD8+ T cells.


Conflict of interest statement

All authors declare no competing interests.

Figures

Extended Data Fig. 1
Extended Data Fig. 1. Massive clonal expansion of all T cells following EAE immunization.
C57BL/6J mice were immunized for EAE induction and on different days post-immunization (PI) [D0 (Unimmunized), D3, D5, D7, D10, D12, D15, D17, D19, D21, D23, and D30], blood, draining lymph nodes (LN), spleen, and CNS infiltrating cells were harvested and stained with a cocktail of cell surface antibodies. (a) Stained cells were analyzed for total frequency of different T cell types and their activation status was determined with the gating strategy as shown in the figure. C57BL/6J mice were immunized for EAE induction and on different days post-immunization (PI) [D0 (unimmunized), D7, D10, D15, and D19], blood and CNS infiltrating CD4+, CD8+, and γδ+ T cells were single cell sorted. The cells underwent single-cell paired TCR sequencing. (n = 3 mice per group/time point). In total, we sequenced 1302 (CD4+), 1660 (CD8+), and 1451 (γδ+) paired TCR sequences. (b, c, and d) Average percent clonal expansion of CD4+, CD8+, and γδ+ T cells among unimmunized and immunized mice in all days and tissues combined together. Data are shown as mean ± SEM. (e) Percent of identical CD4+, CD8+, and γδ+ TCR sequences shared between blood and the CNS within each day PI. (f) Frequency of major groups (Group 1–4) of natural γδ+ T17 (nTγδ17) cells in blood and CNS different days and tissue PI. (g) Corresponding paired TCRγ and TCRδ sequences which define each major group (Group 1–4) of nTγδ17 cells.
Extended Data Fig. 2
Extended Data Fig. 2. Concomitant activation of all T cells following EAE immunization and clonally expanded CD8 TCRs are not specific to myelin peptides or proteins.
(a, c, and e) C57BL/6J mice were immunized for EAE induction and on different days PI [D0 (Unimmunized) (n = 5), D3 (n = 4), D5 (n = 4), D7 (n = 4), D10 (n = 4), D12 (n = 4), D15 (n = 5), D17 (n = 5), D19 (n = 5), D21 (n = 5), D23 (n = 5), and D30 (n = 3)], blood, draining LN, and spleen cells were harvested and analyzed for total frequency of activated (CD44high) and (b, d, and f) naïve (CD62Lhigh) CD4+, CD8+, and γδ+ T cells in the blood, draining LN, and spleen. Significance of differences observed in changes in frequency of naïve and activated T cells between days was determined using one-way ANOVA followed by Dunnets post hoc multiple comparison test. Data are shown as mean ± SEM. Representative data from two independent experiments. *p = 0.046; **p = 0.0023; ***p = 0.0002; ****p < 0.0001. 9 clonally expanded CD8 TCRs (EAE1-CD8 to EAE9-CD8) were retrovirally transduced to express on 58αβ−/− cells. (g) Un-transduced and transduced cell lines were stained with fluorochrome labelled anti-TCRβ and anti-CD3 to determine the surface expression of TCRs. (h) Un-transduced and transduced EAE-CD8 TCR cell lines were stimulated with plate bound anti-CD3 and soluble anti-CD28 for 12–16 hr and surface stained with activation marker CD69. (i) Un-transduced 58αβ−/− or OT-1 TCR transduced cell lines were stimulated with BMDCs pulsed with SIINFEKL peptide or whole Ovalbumin (OVA) protein for 12–16 hr, washed, and stained with activation marker CD69. (j) Unstimulated 58αβ−/− or EAE-CD8 TCR transduced cell lines were stimulated with pool of peptides (PP1–7) from MOG, MBP, PLP, MAG and SIINFEKL peptide and examined for activation marker CD69 (CD69 expression shown in figure for EAE1-CD8 TCR). Peptides are of variable lengths (8–12MERs). Each peptide pool contained 50 peptides. Representative data from three independent experiments.
Extended Data Fig. 3
Extended Data Fig. 3. Generation and functional validation of a H2-Db yeast peptide-MHC library.
(a) Schematic of the murine Class I MHC H2-Db displayed on yeast as β2m, α1, α2, and α3 with peptide covalently linked to the MHC N-terminus. (b) Design of the peptide library displayed by H2-Db. Design is based on the structure of the 6218 TCR bound to H2-Db-restricted acid polymerase peptide 224–233 (SSLENFRAYV, DbPA224) (Day E B et al., 2011, PDB, 3PQY). (c) Mutation required for proper folding of the H2-Db displayed on yeast (α2-W131 to α2-G131). Mutations were derived from error prone mutagenesis. (d) Design for two different lengths of H2-Db libraries. For nine amino acid (9 MER) library, residues from P1 to P9 were randomized, with limited diversity at MHC anchor positions P5 (Asparagine, N) and P9 (Methionine, Isoleucine, and Leucine, M/I/L). For ten amino acid (10 MER) library, residues from P1 to P10 were randomized, with limited diversity at MHC anchor positions P5 (Asparagine, N) and P10 (Methionine, Isoleucine, and Leucine, M/I/L). TCR contact residues are colored pink and MHC anchor residues are colored red or blue. (e and g) Selection of PA224-H2-Db error prone library with 6218 soluble TCR. Increased cMyc expression among induced yeast peptide-H2-Db error prone library at different rounds (RD1-RD4) of selection and (f) 6218 soluble TCR tetramer staining on the post-RD4 error prone H2-Db library. Each TCR was screened on the yeast library once.
Extended Data Fig. 4
Extended Data Fig. 4. In vitro and In vivo characterization of CD8+ T cells specific for surrogate peptides following EAE.
(a) EAE-CD8 TCR transduced Jurkat αβ−/− T cells were pMHC tetramer stained with 6218, EAE6, and EAE7-CD8 TCR specific SP (SSLENFRAYV, ASRSNRYFWL, SMRPNHFFFL YQPGNWEYI, and HDRVNWEYI), respectively. (b) From unimmunized (n = 4), MOG (n = 5), MOG + SP (n = 5), or SP immunized mice (n = 5), spleen and LN cells were harvested, and enriched for SP specific CD8+ T cells with pMHC tetramers. Representative flow cytometry gating strategy is shown for different cell surface markers and tetramer specific cells. (c) Representative flow cytometry data is shown for activation status (defined as CD44+CD62L) on CD8+ T cells specific for SP (ASR, HDR, SMRP, and YQP-tet+) from WT and different immunization groups (MOG, MOG + SP, and SP). (d) Activated/effector phenotype of CD8+ T cells specific for SP (ASR, HDR, SMRP, and YQP-tet+) from WT (n = 5) and different immunization groups [MOG (n = 3), MOG + SP (n = 4), and SP (n = 3)] is quantified and shown as a bar graph (n = 5 mice per group). The significance of differences among the frequency of activated/effector cells between different immunization group was determined using one-way ANOVA followed by Tukey’s post hoc multiple comparison test. *p = 0.0169; **p = 0.0020; ****p < 0.0001. Data are shown as mean ± SEM. (e) C57BL/6J mice were immunized for EAE with an emulsion containing MOG35–55 + CFA + PTX (n =10) and Flu peptide (SSLENFRAYV) + MOG35–55 + CFA + PTX (n =10). The clinical scores following immunization were recorded. Data are shown as mean ± SEM. Representative data from two independent experiments.
Extended Data Fig. 5
Extended Data Fig. 5. CD8+ T cell specific surrogate peptide immunization suppresses MOG35–55 specific CD4+ T cells and induces CD8+ T cells with a regulatory phenotype.
C57BL/6J mice were immunized with an emulsion containing MOG35–55 + CFA + PTX (n = 5), or with MOG35–55 + SP + CFA + PTX (n = 5). From (a) unimmunized and (b and c) D10 PI mice, spleen and LN cells were isolated, stained, and enriched for MOG35–55 I-Ab pMHC specific CD4+ T cells and an irrelevant tetramer. Representative FACS plots for different groups are shown. (d-g) From unimmunized (n = 5) and D10 PI MOG (n = 5), MOG + SP (n = 5), and SP (n = 4) immunized mice, spleen and LN cells were harvested stained, and enriched for SP specific CD8+ T cells using pMHC tetramer. Representative FACS dot-plots for CD8+ T cell with a regulatory phenotype (CD44+CD122+Ly49+) from each group is shown. (h) Each tetramer+ (ASR, HDR, SMRP, and YQP-tet+) CD8+ T cells were sub-gated for CD122, CD44, and Ly49 and the frequency of CD122+CD44+Ly49+ cells among each SP specific cells are shown among different immunization groups. The significance of differences among the frequency of CD122+CD44+Ly49+ cells between different immunization group was determined using one-way ANOVA followed by Tukey’s post hoc multiple comparison test. ***p = 0.0002. Data are shown as mean ± SEM. Representative data from two independent experiments.
Extended Data Fig. 6
Extended Data Fig. 6. CD8+ T cells elicited upon MOG + SP immunization are specific, their suppression is mediated by Perforin, adoptive transfer of CD122+CD44+Ly49+ abrogates EAE, and SP triggers a more severe, inflammatory retinal uveitis than IRBP peptide alone.
C57BL/6J mice were immunized with an emulsion containing MOG35–55 + CFA + PTX, MOG35–55 + SP + CFA + PTX, or MOG35–55 + Flu peptide + CFA + PTX. Spleen and LN cells were harvested from D10 PI mice, enriched for either CD4+, CD8+ T cells, or antigen presenting cells (APC) using Miltenyi cell enrichment kits followed by FACS. CellTraceTM Violet (CTV) Dye labelled CD4+ T cells from MOG immunized mice were co-cultured with APC from MOG immunized mice either in the (a) absence of CD8+ T cells or in the presence of CD8+ T cells from (b) MOG + SP, (b) WT, (d) CFA + PTX, (e) MOG + flu, or (f) CD8+ T cells from Perforin knockout mice immunized with MOG + SP. (g) CTV labelled CD4+ T cells from MOG35–55 + CFA + PTX immunized mice were co-cultured with CD8+ T cells from MOG35–55 + SP + CFA + PTX in the presence of anti-Qa-1b antibody (10 ug/ml). In addition (h) CTV labelled CD4+ T cells from OVA329–337 CFA + PTX were co-cultured with CD8+ T cells from MOG35–55 + SP + CFA + PTX immunized mice. 7 days post co-culture, cells were washed and stained with surface markers and analyzed for CD4+ T cell proliferation (CTV Dye dilution). Representative data from two independent experiments. C57BL/6J mice were immunized with an emulsion containing MOG35–55 + SP + CFA + PTX (n = 10) and 10 days post-immunization spleen and lymph node cells were isolated, stained, enriched for CD8+ T cells with Miltenyi cell enrichment kit followed by FACS to CD44+CD122+Ly49+ (Ly49+) and CD44+CD122+Ly49 (Ly49) cells. Sorted Ly49+ and Ly49 cells were adoptively transferred (8 million cells/animal) to C57BL/6J mice (n = 5 mice/group) at the time of MOG35–55 + CFA + PTX immunization. (i) The clinical scores following adoptive transfer of Ly49+ and Ly49 cells and MOG35–55 + SP + CFA + PTX immunization were recorded, and the significance of differences between clinical courses was calculated by regression analysis with the two-way ANOVA followed by Bonferroni post hoc multiple comparison test. **** p < 0.0001. Data are shown as mean ± SEM. Representative data from two independent experiments. (j) In the wild-type, untreated mouse eye, the retina shows a normal laminar pattern and there are no leukocytes in the vitreous. (k) After subcutaneous injection of IRBP (interphotoreceptor binding protein) peptide antigen, there was only a mild inflammatory response in 40% of eyes with activated leukocyte invasion of the vitreous (red arrow) and mild disruption of the and retina outer nuclear layer photoreceptors (black arrow). (l) Following subcutaneous injection of both IRBP + SP there was a severe inflammatory response in 80% of eyes with activated leukocyte invasion of the vitreous (red arrows) and severe disruption of the retina photoreceptors (black arrows). (RGC, retinal ganglion cell layer; IPL, inner plexiform layer; INL, inner nuclear layer; OPL, outer plexiform layer; ONL, outer nuclear layer; RPE, retinal plexiform layer). Five C57BL/6J mice were examined for each condition. EAU was induced in mice and mice were euthanized on day 21 post-immunization. Mouse eyes were enucleated, fixed, and pupil-optic nerve sections were examined by histology. C57BL/6J mice were immunized with an emulsion containing IRBP + CFA + PTX or IRBP + SP + CFA + PTX. Spleen and LN cells were harvested from Day 10 post-immunized mice, enriched for either CD4+, CD8+ T cells, or antigen presenting cells (APC) using Miltenyi cell enrichment kits followed by FACS. CellTraceTM Violet (CTV) Dye labelled CD4+ T cells from IRBP immunized mice were co-cultured with APC from IRBP immunized mice with purified (n) CD8+CD44+CD122+Ly49+[Ly49+], (o) CD8+CD44+CD122+Ly49[Ly49] or (m) without CD8+ T cells from IRBP + SP immunized mice 7 days post co-culture, cells were washed and stained with surface markers and analyzed for CD4+ T cell proliferation (CTV Dye dilution).
Extended Data Fig. 7
Extended Data Fig. 7. Transcriptional profiling of Ly49+ Vs Ly49 cells.
C57BL/6J mice were immunized with an emulsion containing SP + CFA + PTX (n = 3). (a) Spleen and LN cells were harvested from D10 mice, enriched for either CD8+ T cells using a Miltenyi CD8+ T cell enrichment kit followed by sorting for CD122+CD44+Ly49 [Ly49] and CD122+CD44+Ly49+ [Ly49+] cells and then performed bulk RNA-seq on these cells. (a) A heatmap of differentially expressed genes (log2(fold change) > 2 and the adjusted p value < 0.005) in Ly49+/Ly49 RNA-seq samples. Columns show samples. Rows and columns are ordered based on hierarchical clustering. Normalized gene expression values are centered for each gene by subtracting the average value of all samples from each sample value (2–3 mice/group). (b) Gene Ontology enrichment analysis of genes differentially expressed (log2(fold change) > 2 and the two-tailed Benjamini Hochberg adjusted p value < 0.005 from DESeq2) between Ly49+/Ly49 RNA-seq samples. The y-axis represents the top 30 enriched Gene Ontologies (genes from gene ontologies highlighted in green are in Supplementary Data Table. 6). The x-axis value is the fraction of genes in that ontology that are differentially expressed. The color of the dot represents that significance of the Gene Ontology enrichment (one-tailed Fisher’s exact test), and the size of the dot represents the number of genes differentially expressed. The plot was made with the R package “clusterProfiler.” (c) Volcano plot representing gene expression differences between the Ly49+ vs Ly49 samples (3 mice/group). Each point is a gene. List of genes specifically expressed in CD4+ Tregs (Zemmour D et al., 2018) are colored red if they are expressed in both MOG + SP RNA seq samples, and green if not. The horizontal dotted line is made at −log10(0.05), and the two vertical dotted lines represent a fold change of log2(2). Genes with a negative fold change are highly expressed in Ly49+ cells.
Extended Data Fig. 8
Extended Data Fig. 8. Major clonal expansion of CD8+ T cells in recent onset MS patients.
PBMCs from healthy controls (HC) (n = 4) and MS (n = 18) patients were stained and analyzed by flow cytometry to determine the frequency of T cells. Frequency of (a) CD4+, (b) CD8+, and (c) γδ+ T cells in T cells is shown, data are shown as mean ± SEM. Brain homing and activated (CD49d+CD29+HLA-DR+CD38+) CD8+ T cells were single cell sorted from PBMCs of (d) healthy controls (HCs) and (e) newly diagnosed MS patients. The cells underwent single-cell paired TCR sequencing. Pie charts depicting clonal expansion of CD8+ T cells among HC (n = 10) and MS (n =18) patients. The number of cells with β chain successfully identified is shown above its pie chart. For each TCR clone expressed by two or more cells (clonally expanded), the absolute number of cells expressing that clone (≥2, ≥5, ≥10, ≥20, and ≥50) is shown with a distinct colored section.
Extended Data Fig. 9
Extended Data Fig. 9. TCR repertoire of brain homing activated CD4+ T cells in recent onset MS patients.
Brain homing and activated (CD49d+CD29+HLA-DR+CD38+) CD4+ T cells were single cell sorted from PBMCs of (a) healthy controls (HCs) and (b) recent onset MS patients. The cells underwent single-cell paired TCR sequencing. Pie charts depicting clonal expansion of CD4+ T cells among HC (n = 10) and MS (n = 18) patients. The number of cells with β chain successfully identified is shown above its pie chart. For each TCR clone expressed by two or more cells (clonally expanded), the absolute number of cells expressing that clone (≥2, ≥5, ≥10, ≥20, and ≥50) is shown with a distinct colored section.
Extended Data Fig. 10
Extended Data Fig. 10. TCR repertoire of brain homing activated γδ+ T cells in recent onset MS patients.
Brain homing and activated (CD49d+CD29+HLA-DR+CD38+) γδ+ T cells were single cell sorted from PBMCs of (a) healthy controls (HCs) and (b) recent onset MS patients. The cells underwent single-cell paired TCR sequencing. Pie charts depicting clonal expansion of γδ+ T cells among HC and MS patients. The number of cells with δ chain successfully identified is shown above its pie chart. For each TCR clone expressed by two or more cells (clonally expanded), the absolute number of cells expressing that clone (≥2, ≥5, ≥10, ≥20, and ≥50) is shown with a distinct colored section. From the single cell sorted γδ+ T cells, RAR-related orphan receptor (ROR) transcripts were amplified using gene specific primers and sequenced simultaneously with γ and δ chains. (c) The number of γδ+ T cells positive for the RORC transcript is shown among HC (n = 10) and MS (n =18) patients. Significance of differences observed in the number of positive cells for RORC transcript was determined using paired t test. *p = 0.0301. Data are shown as mean ± SEM.
Fig. 1
Fig. 1. Concomitant activation of all T cells following EAE immunization.
(a) C57BL/6J mice were immunized for EAE induction and at different days post-immunization (PI) blood, CNS, spleen, and draining lymph nodes (LN) cells were harvested and analyzed for total frequency of T cells. (b, c, d, and e) Total frequency of CD4+, CD8+, and γδ+ T cells in the blood, CNS, spleen, and in the LN different days PI [(D0 (Unimmunized) (n = 5), D3 (n = 4), D5 (n = 4), D7 (n = 4), D10 (n = 4), D12 (n = 4), D15 (n = 5), D17 (n = 5), D19 (n = 5), D21 (n = 5), D23 (n = 5), and D30 (n = 3))]. Significance of differences observed in changes in frequency of T cells between days was determined using one-way ANOVA followed by Dunnets post hoc multiple comparison test. Data are shown as mean ± SEM. Representative data from two independent experiments. *p = 0.05; **p = 0.0097; ***p = 0.0008; ****p < 0.0001.
Fig. 2
Fig. 2. CD4+, CD8+, and γδ+ T cells are clonally expanded following EAE.
(a) C57BL/6J mice were immunized for EAE induction and on different days PI [(D0 (unimmunized), D7, D10, D15, and D19)] blood and CNS infiltrating CD4+, CD8+, and γδ+ T cells were single cell sorted based on (b) activation markers (CD44hiCD62Llow) and their TCRs sequenced. Pie chart depicting clonal expansion of CD4+, CD8+, and γδ+ T cells different days PI in (c) blood and (d) CNS. Each pie chart is an aggregate of the number of TCR sequences from 3 individual mice pooled together per time point per tissue. The number of cells with β or both γ and δ chains successfully identified is shown above its pie chart. For each TCR clone expressed by two or more cells (clonally expanded), the absolute number of cells expressing that clone is shown with a distinct colored section. Sequencing data is from one experiment constituting 3 individual animal per time point.
Fig. 3
Fig. 3. Clonally expanded CD8 TCRs are not responsive to myelin.
(a-d) 4 clonally expanded CD4 TCRs (EAE1-CD4 to EAE4-CD4) were expressed on SKWαβ−/− cells and stained with MOG35–55 and OVA327 I-Ab pMHC tetramer. 9 clonally expanded CD8 TCRs (EAE1-CD8 to EAE9-CD8) were expressed on 58αβ−/− cells. (e) Cells were stimulated with pools of myelin peptides from myelin oligodendrocyte glycoprotein (MOG), myelin basic protein (MBP), proteolipid protein (PLP), myelin associated glycoprotein (MAG), SIINFEKL, myelin or ovalbumin (OVA) protein, and anti-CD3 + anti-CD28 for 12–16 hr, and examined for activation marker CD69. Each peptide pool (PP)1 – PP7 comprised of variable length peptides (8–12MERs), and each PP contained 50 peptides. (e) 58αβ−/− cells expressing OT-1 TCR were stimulated with either SIINFEKL peptide or OVA protein. Representative data from three independent experiments.
Fig. 4
Fig. 4. Clonally expanded EAE CD8 TCRs bind to novel peptides.
Tetramer staining of 9 MER and 10 MER H2-Db yeast-pMHC library with (a) 6218 TCR, (b) EAE6-CD8 TCR, and (c) EAE7-CD8 TCR at the end of 3rd round (RD) of selection. Heatmaps of amino acid preference by position for (d) 6218 (left) (e) EAE6-CD8 (center) and (f) EAE7-CD8 (right) TCRs after three RDs of selection. Sequences of top 7 peptides post RD3 selection for each TCRs shown below with its amino acid preference. MHC anchor residues are colored in red (P5, N) or blue (P9/10, M/I/L). Each TCR was screened on the yeast library once.
Fig. 5
Fig. 5. CD8+ T cell specific surrogate peptides immunization abrogates EAE.
From unimmunized and D10 PI mice, spleen and LN cells were harvested and enriched for (a) CD4+ T cells specific for I-Ab MOG35–55 or (b) CD8+ T cells specific for SP (ASRSNRYFWL, SMRPNHFFFL YQPGNWEYI, and HDRVNWEYI). Representative dot-plots are shown for unimmunized and immunized mice. Representative data from two independent experiments. (c) Frequency of CD4+ T cells specific for MOG35–55 among WT (n = 4) and immunized mice (n = 5) are shown as a bar graph. Data are shown as mean ± SEM. (d) Frequency of SP specific CD8+ T cells among WT (n = 4) and different immunization groups are shown as a bar graph (n = 5 mice per group). Data are shown as mean ± SEM. (e) EAE clinical scores among C57BL/6J mice immunized with an emulsion containing MOG35–55 + CFA + PTX (n =10), or with MOG35–55 + SP + CFA + PTX (n = 10), or SP + CFA + PTX (n =10). (f) C57BL/6J mice were immunized for EAE with an emulsion containing MOG35–55 + CFA + PTX (n =10) and seven days post-MOG35–55 immunization, mice were challenged with SP + ICFA + PTX (n = 10). (g) C57BL/6J mice were immunized for EAE with an emulsion containing SP + CFA + PTX and seven days post primary immunization, mice were challenged with MOG35–55 + ICFA + PTX (n =10). (e-g) The clinical scores following immunization were recorded, and the significance of differences between clinical courses was calculated by regression analysis with the two-way ANOVA followed by Bonferroni post hoc multiple comparison test. Data are shown as mean ± SEM. Representative data from two independent experiments. ** p = 0.0040, **** p < 0.0001.
Fig. 6
Fig. 6. CD8+ T cell specific surrogate peptides immunization suppresses MOG35–55 specific CD4+ T cells.
C57BL/6J mice were immunized with an emulsion containing MOG35–55 + CFA + PTX (n = 5), or MOG35–55 + SP + CFA + PTX (n = 4). From (a) unimmunized (n = 4) and D10 PI mice (n = 5 mice/group), LN and spleen cells were harvested and enriched for MOG35–55 I-Ab pMHC specific CD4+ T cells. FACS dot-plots from representative animal from different groups are shown (see extended data Fig. 8a-c for data from additional mice per group). (b) Frequency of MOG35–55 specific CD4+ T cells from each group are shown as a bar graph. Representative data from two independent experiments. Data are shown as mean ± SEM. C57BL/6J mice were immunized with MOG35–55 + CFA + PTX (n = 2 mice), or with MOG35–55 + SP + CFA + PTX (n = 2 mice), or SP + CFA + PTX (n = 2 mice). From unimmunized (n = 2) and D10 PI mice, LN and spleen cells were harvested, enriched for either CD4+, CD8+ T cells, or antigen presenting cells (APC) using Miltenyi cell enrichment kits followed by FACS. Dye labelled CD4+ T cells from MOG immunized mice were co-cultured with APC from MOG immunized mice either in the (c) absence or (d) presence of CD8+ T cells from MOG and MOG + SP or SP immunized mice. 7 days post co-culture, cells were analyzed for proliferation. Representative data from two independent experiments. (e) Frequency of CD8+ T cells with a regulatory phenotype (CD44+CD122+Ly49+) are shown among WT (n = 4) and different immunization groups (n = 5 mice/group). The significance of differences among the frequency of CD122+CD44+Ly49+ cells between different immunization group was determined using one-way ANOVA followed by Tukey’s post hoc multiple comparison test. Representative data from two independent experiments. Data are shown as mean ± SEM. *p = 0.0382; ***p = 0.001. CD4+ T cells from MOG immunized were co-cultured either (f) without or with (g) total CD8+ T cells or (h) purified CD8+CD44+CD122+Ly49+[Ly49+] or (i) CD8+CD44+CD122+Ly49[Ly49] T cells from MOG + SP immunized mice (n = 2 mice/group). Representative data from two independent experiments. (j) A heatmap of gene expression in RNA-seq samples. Genes were selected on the basis that they are differentially expressed (log2 (fold change) > 0.75 and the adjusted p value < 0.005) and the two-tailed Benjamini Hochberg adjusted p value < 0.005) as defined by DESeq2 in both Ly49+/Ly49 and MOG/MOG + SP comparisons. Columns show samples. Rows and columns are ordered based on hierarchical clustering. Normalized gene expression values are centered for each gene by subtracting the average value of all samples from each sample value. Representative data from two independent experiments.

Comment in

References

    1. International Multiple Sclerosis Genetics Consortium et al. Genetic risk and a primary role for cell-mediated immune mechanisms in multiple sclerosis. Nature 476, 214–219 (2011). - PMC - PubMed
    1. Fallang L-E et al. Differences in the risk of celiac disease associated with HLA-DQ2.5 or HLA-DQ2.2 are related to sustained gluten antigen presentation. Nat. Immunol. 10, 1096–1101 (2009). - PubMed
    1. Sollid LM, Qiao S-W, Anderson RP, Gianfrani C & Koning F Nomenclature and listing of celiac disease relevant gluten T-cell epitopes restricted by HLA-DQ molecules. Immunogenetics 64, 455–460 (2012). - PMC - PubMed
    1. Zamvil S et al. T-cell clones specific for myelin basic protein induce chronic relapsing paralysis and demyelination. Nature 317, 355–358 (1985). - PubMed
    1. Blankenhorn EP et al. Genetics of experimental allergic encephalomyelitis supports the role of T helper cells in multiple sclerosis pathogenesis. Ann. Neurol. 70, 887–896 (2011). - PMC - PubMed

Publication types

MeSH terms

Substances