. 2019 Sep;573(7774):364-369.
doi: 10.1038/s41586-019-1466-y. Epub 2019 Aug 7.

A national experiment reveals where a growth mindset improves achievement

Affiliations

A national experiment reveals where a growth mindset improves achievement

David S Yeager et al. Nature. 2019 Sep.

Abstract

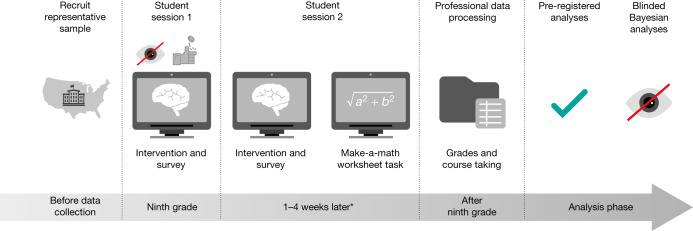
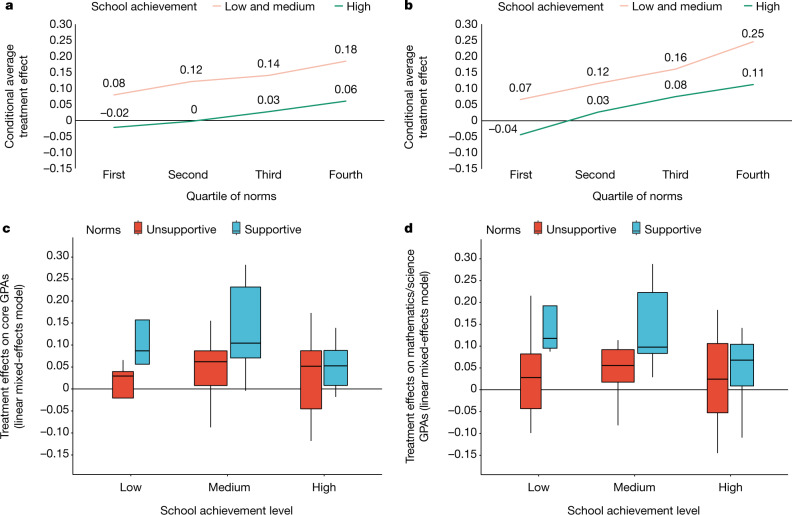
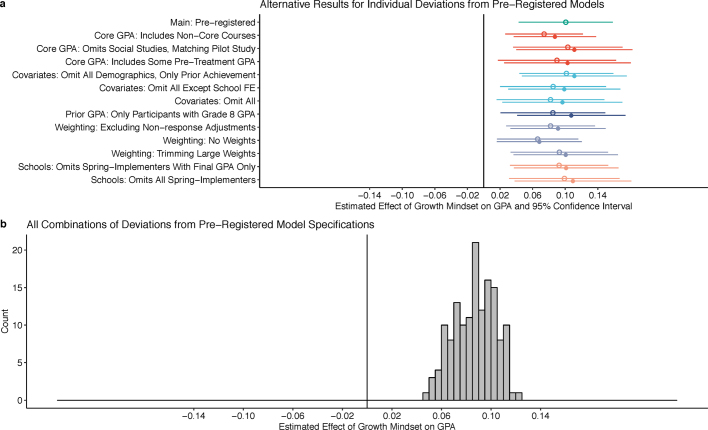
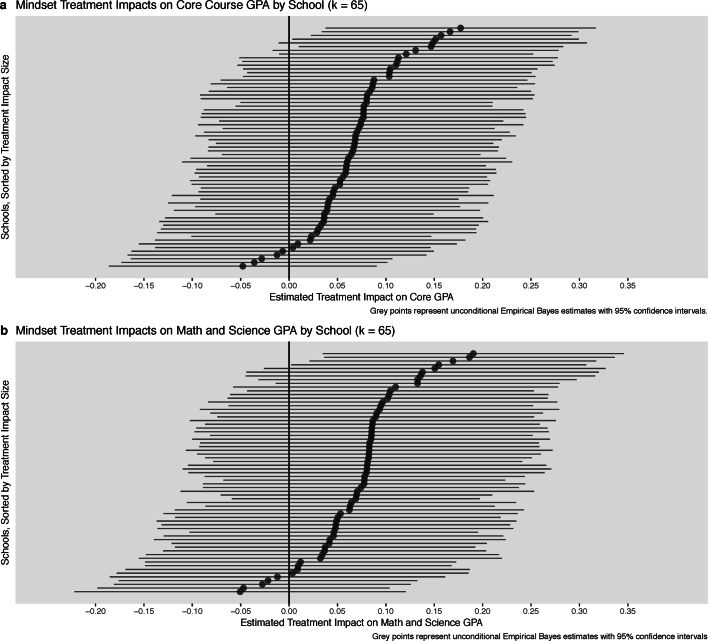
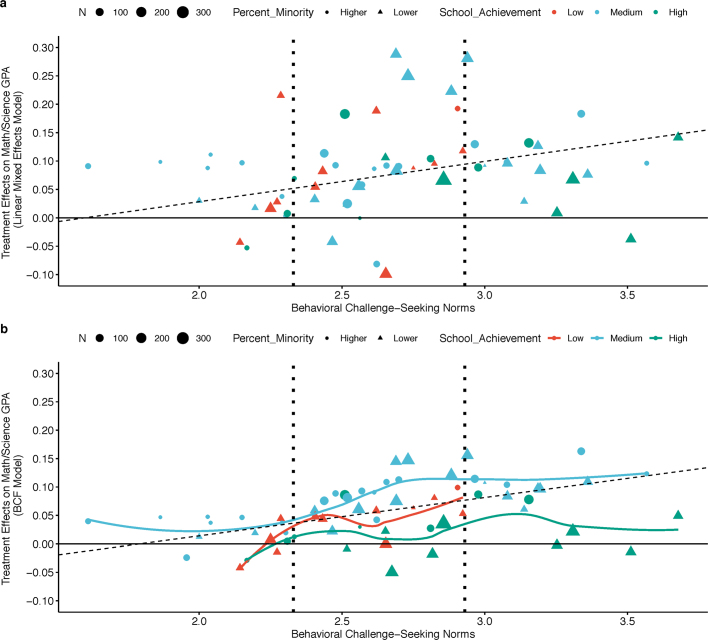
A global priority for the behavioural sciences is to develop cost-effective, scalable interventions that could improve the academic outcomes of adolescents at a population level, but no such interventions have so far been evaluated in a population-generalizable sample. Here we show that a short (less than one hour), online growth mindset intervention-which teaches that intellectual abilities can be developed-improved grades among lower-achieving students and increased overall enrolment to advanced mathematics courses in a nationally representative sample of students in secondary education in the United States. Notably, the study identified school contexts that sustained the effects of the growth mindset intervention: the intervention changed grades when peer norms aligned with the messages of the intervention. Confidence in the conclusions of this study comes from independent data collection and processing, pre-registration of analyses, and corroboration of results by a blinded Bayesian analysis.


Conflict of interest statement

The authors declare no competing interests for this study. Several authors have disseminated growth mindset research to public audiences and have complied with their institutional financial interest disclosure requirements; currently no financial conflicts of interest have been identified. Specifically, D.P. is the co-founder and executive director at PERTS, an institute at Stanford University that offers free growth mindset interventions and measures to schools, and authors D.S.Y, C.S.D., G.W., A.L.D., D.P., and C.H. have disseminated findings from research to K-12 schools, universities, non-profit entities, or private entities via paid or unpaid speaking appearances or consulting. None of the authors has a financial relationship with any entity that sells growth mindset products or services.

Figures

Fig. 1
Fig. 1. Design of the National Study of Learning Mindsets.
Between August and November 2015, 82% of schools delivered the intervention; the remaining 18% delivered the intervention in January or February of 2016. Asterisk indicates that the median number of days between sessions 1 and 2 among schools implementing the intervention in the autumn was 21 days; for spring-implementing schools it was 27 days. The coin-tossing symbol indicates that random assignment was made during session 1. The tick symbol indicates that a comprehensive analysis plan was pre-registered at https://osf.io/tn6g4. The blind-eye symbol indicates that, first, teachers and researchers were kept blinded to students’ random assignment to condition, and, second, the Bayesian, machine-learning robustness tests were conducted by analysts who at the time were blinded to study hypotheses and to the identities of the variables.
Fig. 2
Fig. 2. The growth mindset intervention effects on grade point averages were larger in schools with peer norms that were supportive of the treatment message.
a, c, Treatment effects on core course grade point averages (GPAs). b, d, Treatment effects on GPAs of only mathematics and science. a, b, The CATEs represent the estimated subgroup treatment effects from the pre-registered linear mixed-effects model, with survey weights, when fixing the racial/ethnic composition of the schools to the population median to remove any potential confounding effect of that variable on moderation hypothesis tests. Achievement levels: low, 25th percentile or lower; middle, 25th–75th percentile; high, 75th percentile or higher, which follows the categories set in the sampling plan and in the pre-registration. Norms indicate the behavioural challenge-seeking norms, as measured by the responses of the control group to the make-a-math-worksheet task after session 2. c, d, Box plots represent unconditional treatment effects (one for each school) estimated in the pre-registered linear mixed-effects regression model with no school-level moderators, as specified for research question 3 in the pre-analysis plan and described in the Supplementary Information section 7.4. The distribution of the school-level treatment effects was re-scaled to the cross-site standard deviation, in accordance with standard practice. Dark lines correspond to the median school in a subgroup and the boxes correspond to the middle 75% of the distribution (the interquartile range). Supportive schools are defined as above the population median (third and fourth quartiles); unsupportive schools are defined as those below the population median (first and second quartiles). n = 6,320 students in k = 65 schools. Source data
Extended Data Fig. 1
Extended Data Fig. 1. The finding that the growth mindset effect on GPA is positive among lower-achieving students is robust to deviations from the pre-registered statistical model.
a, b, Each estimate represents an unstandardized treatment effect on GPA (on a 0 to 4.3 scale) estimated in separate fixed-effects regression models with school as a fixed effect. Most of the alternative specifications were known to produce less-valid tests of the hypothesis, but some of them required fewer subjective judgments and so it was informative to show that the main conclusion of a positive treatment effect was supported even with a suboptimal model specification. Examples include revising the core GPA outcome to include non-core classes such as speech, debate or electives (because this does not involve coding of core classes; see ‘Includes Non-Core Courses’), or revising the post-treatment marking period to include pre-treatment data in cases in which schools implemented the intervention in the Spring (because this does not involve coding pre- and post-treatment making periods; see ‘Includes Some Pre-Treatment GPA’). a, The effects of changing just one or two model specifications at a time while leaving the rest of the pre-registered model specifications the same. Open circles represent the pre-registered definition of lower-achieving students (below the school-specific median), and filled dots represent the alternative definition of lower-achieving students (below the school-specific median and below a 3.0 GPA out of 4.3). b, A histogram of all possible combinations of the alternative model specifications that shows that effects are uniformly positive. Note that the treatment effect estimates on the far left of b are from clearly less-valid models; for example, they insufficiently control for prior achievement, they drop participants with missing data, they do not use survey weights (so results are not representative and therefore do not answer our research questions). Panels a and b both show that even exercising all of these degrees of freedom in a way that could obscure true treatment effects still yields positive point estimates. Further explanations of why the alternatives were not selected for the pre-registration are included in Supplementary Information section 7.3. Source data
Extended Data Fig. 2
Extended Data Fig. 2. The growth mindset intervention effect in a given school is almost always positive, although there is significant heterogeneity across schools.
a, b, Mindset treatment effects on for core course GPAs (a) and mathematics/science GPAs (b). Estimates were generated using the pre-registered linear mixed-effects model (see Supplementary Information section 7, RQ3). Note that the treatment effect at any individual school is likely to have a very wide confidence interval even when there is a true positive effect, owing to small sample sizes for each school on its own. Therefore, as with any multi-site trial, effects of individual schools are not expected to be significantly different from zero even though the average treatment effect is significantly different from zero. The plotted treatment effects were estimated in an unconditional model with no cross-level interactions (that is, without consideration of the potential moderators) and so the points are shrunken towards the sample mean. Thus, these plotted estimates do not correspond to the estimated CATEs reported in the paper or in Extended Data Table 3. Source data
Extended Data Fig. 3
Extended Data Fig. 3. A BCF analysis reproduces the same pattern of moderation by norms as the pre-registered linear mixed-effects model
The BCF analysis uses a nonparametric Bayesian model designed to shrink effect sizes to see if any effect can update a relatively strong prior centered on null effects and biased toward low degrees of treatment effect moderation. a, b, Data points correspond to school-level treatment effects estimated by the pre-registered linear mixed-effects model (a) or the BCF model (b). Treatment effects refers to the difference between the treatment and control groups in terms of mathematics/science GPAs at the end of ninth grade in a school, adjusting for pre-random-assignment covariates and including survey weights. The models included three school-level moderators of the student-level randomized treatment: the achievement level (categorical, dummies for low and high, medium group as the reference category in the linear model), the behavioural growth mindset norms (continuous) and the percentage of racial or ethnic minority students (continuous) of the schools. School-level treatment effects include the fitted values plus the model-estimated, school-specific random effect. Challenge-seeking behavioural norm refers to the average number of challenging mathematics problems (out of 8) chosen by students in the control group in a given school. N, the number of lower-achieving students in a school. Percent minority, the percentage of students who identify as black, African-American, Hispanic, Latino or indigenous American, split at the school-level population median (26% of the student body of the school). The dashed lines represent the estimated intercept and slope for the linear trend of the estimated treatment effects in norms. b, The coloured lines represent LOESS smoothing curves for the trend in  norms of the estimated treatment effects, fitted to the estimated school-level treatment effects within achievement groups and weighted by school sample size. The area between thevertical lines is the interquartile range (IQR) of norms, where neither model is extrapolating. The two models agree broadly about average effects, particularly within the IQR of norms, while BCF estimated somewhat lower degrees of heterogeneity and extrapolates in a fundamentally different fashion at the extremes of norms (since it is a nonlinear model).Recall BCF is designed to shrink toward an overall effect size of zero, and to shrink CATEs of similar schools towards one another, in order to avoid over-fitting the data. Unlike the preregistered linear models, BCF was specified with no prior hypotheses about the functional form of moderation (nonlinearities and/or interactions between multiple moderators and treatment) so this shrinkage is necessary to obtain stable estimates of treatment effects. However, it does lead to smaller estimates of effect sizes and a lower estimated degree of moderation relative to the preregistered linear mixed effects model. Source data

Comment in

References

    1. McFarland, J., Stark, P. & Cui, J. Trends in High School Dropout and Completion Rates in the United States: 2013 (US Department of Education, 2016).
    1. Autor DH. Skills, education, and the rise of earnings inequality among the “other 99 percent”. Science. 2014;344:843–851. doi: 10.1126/science.1251868. - DOI - PubMed
    1. Fischer, C. S. & Hout, M. Century of Difference (Russell Sage Foundation, 2006).
    1. Rose H, Betts JR. The effect of high school courses on earnings. Rev. Econ. Stat. 2004;86:497–513. doi: 10.1162/003465304323031076. - DOI
    1. Patton GC, et al. Our future: a Lancet commission on adolescent health and wellbeing. Lancet. 2016;387:2423–2478. doi: 10.1016/S0140-6736(16)00579-1. - DOI - PMC - PubMed

Publication types