. 2019 Aug;572(7770):543-548.
doi: 10.1038/s41586-019-1464-0. Epub 2019 Aug 7.

Pol II phosphorylation regulates a switch between transcriptional and splicing condensates

Affiliations

Pol II phosphorylation regulates a switch between transcriptional and splicing condensates

Yang Eric Guo et al. Nature. 2019 Aug.

Abstract

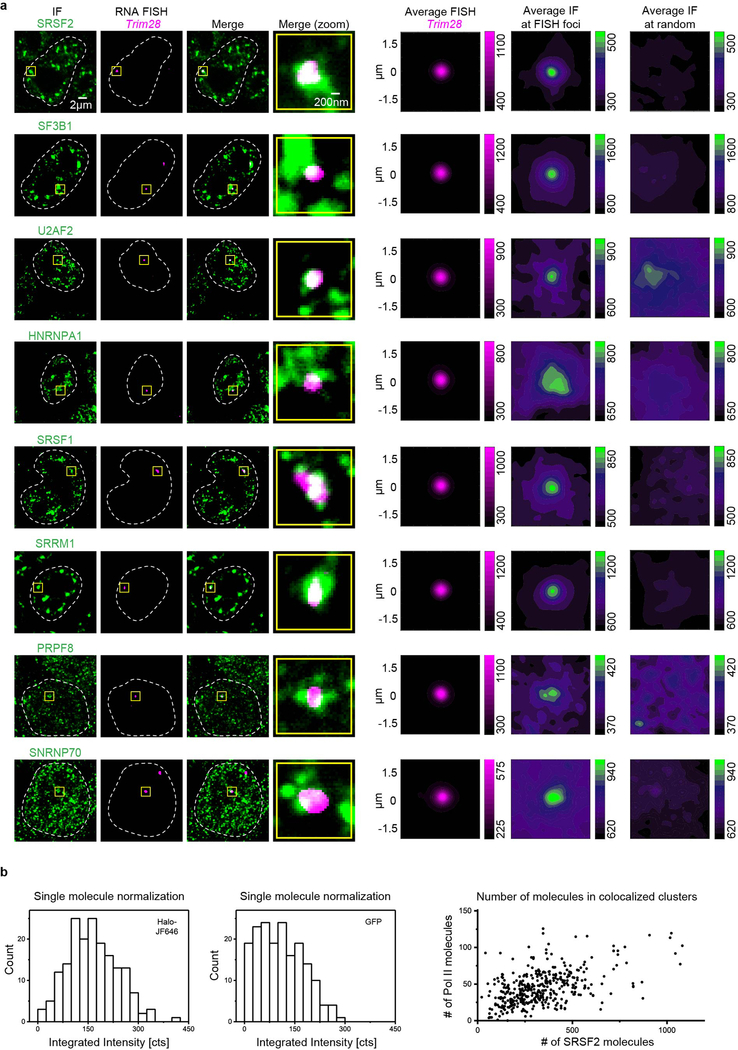
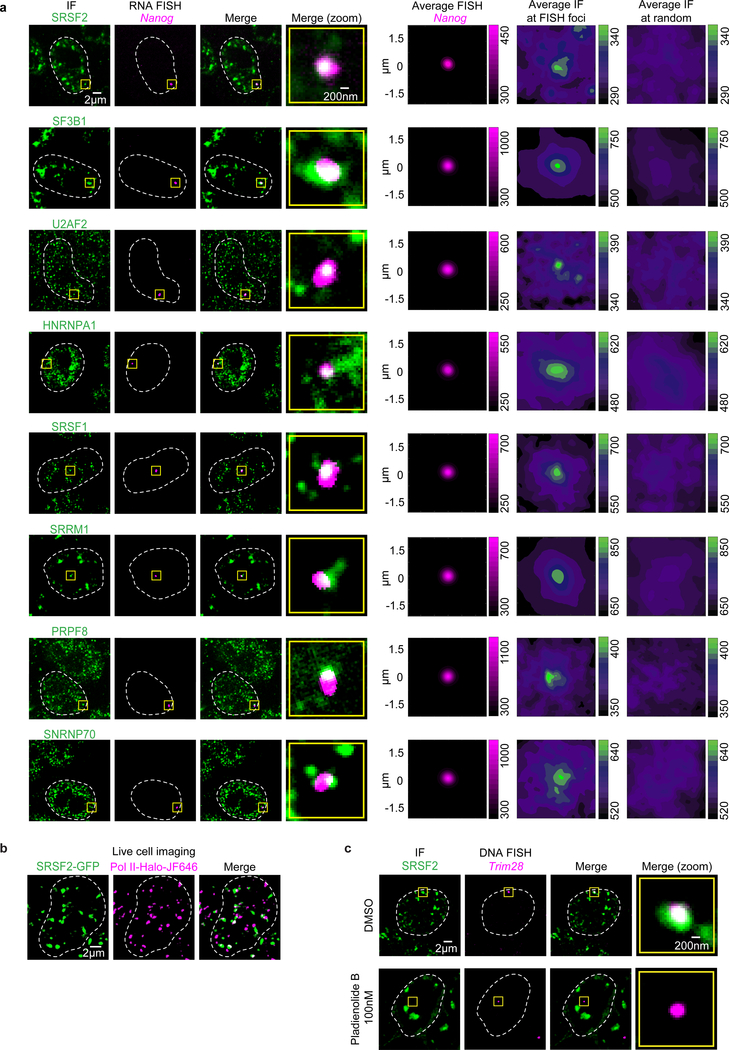
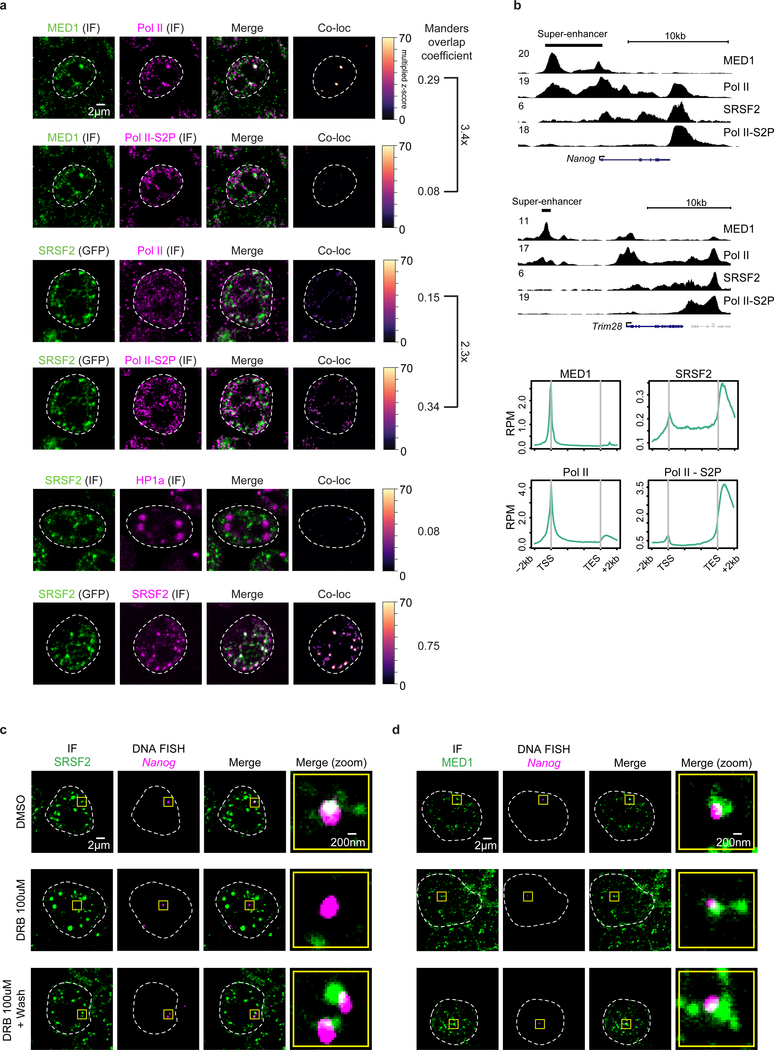
The synthesis of pre-mRNA by RNA polymerase II (Pol II) involves the formation of a transcription initiation complex, and a transition to an elongation complex1-4. The large subunit of Pol II contains an intrinsically disordered C-terminal domain that is phosphorylated by cyclin-dependent kinases during the transition from initiation to elongation, thus influencing the interaction of the C-terminal domain with different components of the initiation or the RNA-splicing apparatus5,6. Recent observations suggest that this model provides only a partial picture of the effects of phosphorylation of the C-terminal domain7-12. Both the transcription-initiation machinery and the splicing machinery can form phase-separated condensates that contain large numbers of component molecules: hundreds of molecules of Pol II and mediator are concentrated in condensates at super-enhancers7,8, and large numbers of splicing factors are concentrated in nuclear speckles, some of which occur at highly active transcription sites9-12. Here we investigate whether the phosphorylation of the Pol II C-terminal domain regulates the incorporation of Pol II into phase-separated condensates that are associated with transcription initiation and splicing. We find that the hypophosphorylated C-terminal domain of Pol II is incorporated into mediator condensates and that phosphorylation by regulatory cyclin-dependent kinases reduces this incorporation. We also find that the hyperphosphorylated C-terminal domain is preferentially incorporated into condensates that are formed by splicing factors. These results suggest that phosphorylation of the Pol II C-terminal domain drives an exchange from condensates that are involved in transcription initiation to those that are involved in RNA processing, and implicates phosphorylation as a mechanism that regulates condensate preference.


Figures

Extended Data Figure 1.
Extended Data Figure 1.. CTD partitioning in Mediator condensates
a. Average IF signal for MED1 and Pol II centered on randomly selected nuclear positions. b. Images of a fusion event between two full-length CTD/MED1-IDR droplets. GFP-CTD52 at 10 μM was mixed with 10 μM mCherry-MED1-IDR in droplet formation buffer with 125 mM NaCl and 16% Ficoll-400. c. Top: representative images of FRAP of heterotypic droplets of mCherry-MED1-IDR and GFP-CTD52. Droplet formation conditions are the same as in b. Bottom: Quantification of the fraction of fluorescence recovery following photobleaching of mCherry-MED1-IDR and GFP-CTD52. Data represent mean +/− SD (n = 3).
Extended Data Figure 2.
Extended Data Figure 2.. Splicing factors at Trim28, SRSF2/Pol II molecule quantification.
a. Representative images exhibiting overlap between IF of splicing factors SRSF2, SF3B1, U2AF2, HNRNPA1, SRSF1, SRRM1, PRPF8, or SNRNP70 with nascent RNA FISH of Trim28 in fixed mESCs. b. Left: Histogram of the integrated intensity of single Halo-JF646 (n=178) and single GFP emitters (n=177). Mean values of 164.8 +/− 5.6 cts (mean +/− s.e.m.) and 108.6 +/− 5.1 (mean +/− s.e.m.) were used to normalize the integrated intensity of Pol II-Halo-JF646 and SRSF2-GFP, respectively. Right: Scatter plot depicting estimated numbers of Pol II and SRSF2 molecules in colocalizing Pol II and SRSF2 puncta (see methods).
Extended Data Figure 3.
Extended Data Figure 3.. Splicing inhibition and splicing factor condensates
a. Left: diagram depicting the splicing reporter used to measure splicing inhibition following treatment with Pladienolide B. Right: relative levels of splicing in cells treated with DMSO vs. cells treated with Pladienolide B for 4 hrs. The mean of 3 biological replicates (each replicate shown as dot) with standard deviations is plotted. See methods for details. b. Representative images exhibiting overlap or absence of overlap between IF of SF3B1 or Pol II and DNA FISH of Trim28 in mESCs treated with either DMSO or splicing inhibitor Pladienolide B for 4 hours. c. Fraction of overlap of FISH foci with IF puncta in cells treated with Pladienolide B relative to cells treated with DMSO. A star above the drug treated bar indicates a p-value of <0.05 from a two-tailed Chi-squared test comparing the number of overlapping and non-overlapping FISH spots in the DMSO vs. drug condition. See methods for details.
Extended Data Figure 4.
Extended Data Figure 4.. Liquid-like properties of SRSF2 condensates
a. Live cell imaging of GFP-SRSF2 mESCs. Ten independent fields from one plate of cells were imaged. b. Representative images of fluorescence recovery after photobleaching (FRAP) experiments performed on the GFP-SRSF2 mESC cell line. c. Quantification of experiment depicted in b. Data represent means +/− SD (n = 9). d. Representative images of live cells before and after treatment with 10% 1,6-hexanediol for ~17 minutes. Five independent fields from one plate of cells were imaged before and after treatment. e. Examples of fusion events occurring between SRSF2 puncta in the GFP-SRSF2 cell line. Two fields from two independent plates of cells were imaged over a two hour time course, and each showed at least one fusion event.
Extended Data Figure 5.
Extended Data Figure 5.. DRB treatment effects on splicing factor and transcriptional condensates
a. Representative images exhibiting overlap or lack of overlap between IF of SRSF2 and DNA FISH of Trim28 in mESCs treated with DMSO for 2 hrs, DRB for 2 hrs, or DRB for 2 hrs followed by a 2 hr DRB washout. b. Representative images exhibiting overlap between IF of MED1 and DNA FISH of Trim28 in mESCs treated with DMSO for 2 hrs, DRB for 2 hrs, or DRB for 2 hrs followed by a 2 hr DRB washout. c. Representative images exhibiting overlap between IF of Pol II and DNA FISH of Nanog or Trim28 in mESCs treated with DMSO for 2 hrs, DRB for 2 hrs, or DRB for 2 hrs followed by a 2 hr DRB washout. d. Fraction of overlap of FISH foci with IF puncta in cells treated with DRB or DRB followed by washout relative to cells treated with DMSO. A star above the DRB treated bar indicates a p-value of <0.05 from a two-tailed Chi-squared test comparing the number of overlapping and non-overlapping FISH spots in the DMSO vs. DRB condition. A star over the washout bar indicates a p-value of <0.05 from a two-tailed Chi-squared test comparing the DRB vs. washout condition. Splicing factors tested showed significantly decreased or trended towards decreased overlap with FISH spots in the DRB condition compared to DMSO, while MED1 and Pol II exhibited limited changes. See methods for details.
Extended Data Figure 6.
Extended Data Figure 6.. CTD in vitro phosphorylation and partitioning in MED1-IDR droplets
a. Western blot showing phosphorylation of CTD by CDK7. Equal amounts of unphosphorylated and phosphorylated GFP-CTD52 (see methods) were run on a 3–8% SDS PAGE gel and analyzed by western blot using anti-GFP antibodies. Similar results were obtained in two biological replicates. For gel source data, see Supplementary Figure 1. b. Western blot showing phosphorylation of CTD by CDK9. Similar results were obtained in two biological replicates. For gel source data, see Supplementary Figure 1. c. Representative images of droplet experiments measuring CTD incorporation into MED1-IDR droplets. Purified human MED1-IDR fused to mCherry (mCherry-MED1-IDR) at 10 μM was mixed with 3.3 μM GFP, GFP-CTD52, GFP-CTD52 phosphorylated with CDK7 or CDK9 in droplet formation buffers with 125 mM NaCl and 16% Ficoll-400 or 10% PEG-8000. d. Partition ratios of GFP and GFP-CTD in MED1-IDR droplets, and partition ratios of mCherry-MED1-IDR from experiments depicted in c.
Extended Data Figure 7.
Extended Data Figure 7.. Splicing factors form droplets in vitro
a. Representative images of droplet formation by mCherry-SRSF2, SRSF1, U2AF2 and hnRNPA1 with increasing protein concentrations. All assays were performed in the presence of 120 mM NaCl and 10% PEG-8000. b. Quantification of the partition ratios from the experiments depicted in a. c. Representative images of heterotypic droplets formed between SRSF2 and other splicing factors, including SRSF1, U2AF2 and hnRNPA1. Purified human SRSF2 fused to GFP (GFP-SRSF2) at 2.5 μM was mixed with 2.5 μM purified mCherry-fused to human SRSF2, SRSF1, U2AF2 or hnRNPA1 in droplet formation buffers with 120mM NaCl and 10% PEG-8000.
Extended Data Figure 8.
Extended Data Figure 8.. CTD partitioning in SR-protein droplets
a. Quantification of the partition ratios of SRSF2 from experiments depicted in Fig. 4b. b. Quantification of the partition ratios of SRSF1 from experiments depicted in Fig. 4c. c. Representative images of droplet experiments measuring CTD incorporation into SRSF2 droplets. Same reagents and conditions were used as in Fig. 4b except that 16% Ficoll-400 was used as a crowding agent. d. Representative images and quantification of partition ratios of droplet experiments measuring phosphorylated full length or truncated CTD incorporation into SRSF2 droplets. Droplet formation conditions are the same as described in Fig. 4b.
Figure 1.
Figure 1.. The CTD of Pol II is integrated and concentrated in Mediator condensates
a. A model depicting the transition from transcription initiation to elongation and the role of Pol II CTD phosphorylation in this transition. During initiation, Pol II with a hypophosphorylated CTD interacts with Mediator. CDK7 phosphorylation of the CTD leads to formation of a paused Pol II approximately 50–100 bp downstream of the initiation site, and subsequent CDK9 phosphorylation leads to pause release and elongation. For simplicity, we show CDK7 and CDK9 phosphorylating the CTD, leading to elongation. During elongation, Pol II with hyperphosphorylated CTD interacts with various RNA splicing factors,. The colored compartments surrounding the initiating and elongating polymerases represent initiation and splicing factor condensates, respectively. b. Representative images exhibiting overlap between immunofluorescence (IF) of MED1 and Pol II with nascent RNA FISH of Nanog and Trim28 in fixed mouse embryonic stem cells (mESCs). The three columns on the right show average RNA FISH signal and average MED1 or Pol II IF signal centered on RNA FISH foci (see methods). c. Representative images and quantification of partition ratios of droplet experiments measuring full length or truncated CTD incorporation into human Mediator complex droplets. Purified human Mediator complex (~200 nM; see methods) was mixed with 10 μM GFP, GFP-CTD52, or truncated forms of GFP-CTD in droplet formation buffers with 140 mM monovalent salt and 16% Ficoll-400 and visualized on a fluorescence microscope with the indicated filters. d. Representative images and quantification of partition ratios of droplet experiments measuring full length or truncated CTD incorporation into MED1-IDR droplets. Purified human MED1-IDR fused to mCherry (mCherry-MED1-IDR) at 10 μM was mixed with 3.3 μM GFP, GFP-CTD52, or truncated forms of GFP-CTD in droplet formation buffers with 125 mM NaCl and 16% Ficoll-400.
Figure 2.
Figure 2.. Splicing factor condensates occur at active super-enhancer-driven genes
a. Representative images exhibiting overlap between IF of splicing factors SRSF2, SF3B1, U2AF2, HNRNPA1, SRSF1, SRRM1, PRPF8, or SNRNP70 with nascent RNA FISH of Nanog in fixed mESCs. The rightmost column shows average IF signal for splicing factors centered on randomly selected nuclear positions (see methods). b. Representative lattice light sheet images of live mESCs engineered to express GFP tagged SRSF2 and Halo-JF646 tagged Pol II. Maximum intensity projection after background subtraction. c. Representative images exhibiting overlap or absence of overlap between IF of SRSF2 and DNA FISH of Trim28 in mESCs treated with DMSO or splicing inhibitor Pladienolide B for 4 hrs.
Figure 3.
Figure 3.. Pol II partitioning in transcriptional and splicing factor condensates
a. First four rows: IF imaging using antibodies for the hypophosphorylated and serine 2 phosphorylated (S2P) Pol II CTD, coupled with IF for MED1 or direct visualization of SRSF2 in the GFP-SRSF2 mESCs. Last two rows: IF for SRSF2 coupled to IF for HP1a or direct visualization of SRSF2 in the GFP-SRSF2 mESCs. The “Co-loc” column highlights overlapped pixels for each factor in an example z-slice, and the Manders’ overlap coefficient gives a relative score for the degree of overlap from multiple cells and images (see methods). For each experimental comparison, one coverslip of cells was stained for the indicated factors and 5 independent fields were imaged and analyzed. b. Top: Representative ChIP-seq tracks of MED1, SRSF2 and the hypophosphorylated or serine 2 phosphorylated forms of Pol II in mESCs. Y-axis in reads per million (RPM). Bottom: Metagene plots of average ChIP-seq RPM for the same factors across gene bodies (see methods). ChIP-seq was performed once for each factor with approximately 100 million cells. c. Representative images exhibiting overlap or lack of overlap between IF of SRSF2 and DNA FISH of Nanog in mESCs treated with DMSO for 2 hrs, DRB for 2 hrs, or DRB for 2 hrs followed by a 2 hr washout. d. Representative images exhibiting overlap between IF of MED1 and DNA FISH of Nanog in mESCs treated as in panel c.
Figure 4.
Figure 4.. CTD phosphorylation promotes a condensate preference switch between Mediator and splicing factor condensates
a. Representative images and quantification of partition ratios of droplet experiments measuring CTD incorporation into Mediator droplets. Purified human Mediator complex (~200 nM; see methods) was mixed with 10 μM GFP, GFP-CTD52 or GFP-CTD52 phosphorylated with CDK7 or CDK9 in droplet formation buffers with 140 mM monovalent salt and 16% Ficoll-400. b. Representative images and quantification of partition ratios of droplet experiments measuring CTD incorporation into SRSF2 droplets. Purified human SRSF2 fused to mCherry (mCherry-SRSF2) at 2.5 μM was mixed with 3.3 μM GFP, GFP-CTD52 or GFP-CTD52 phosphorylated with CDK7 or CDK9 in droplet formation buffers with 120 mM NaCl and 10% PEG-8000. c. Representative images and quantification of partition ratios of droplet experiments measuring CTD incorporation into SRSF1 droplets. Same conditions as in panel b.

Comment in

References

    1. Adelman K & Lis JT Promoter-proximal pausing of RNA polymerase II: emerging roles in metazoans. Nat Rev Genet 13, 720–731, doi: 10.1038/nrg3293 (2012). - DOI - PMC - PubMed
    1. Harlen KM & Churchman LS The code and beyond: transcription regulation by the RNA polymerase II carboxy-terminal domain. Nat Rev Mol Cell Biol 18, 263–273, doi: 10.1038/nrm.2017.10 (2017). - DOI - PubMed
    1. Levine M, Cattoglio C & Tjian R Looping back to leap forward: transcription enters a new era. Cell 157, 13–25, doi: 10.1016/j.cell.2014.02.009 (2014). - DOI - PMC - PubMed
    1. Sainsbury S, Bernecky C & Cramer P Structural basis of transcription initiation by RNA polymerase II. Nat Rev Mol Cell Biol 16, 129–143, doi: 10.1038/nrm3952 (2015). - DOI - PubMed
    1. Eick D & Geyer M The RNA polymerase II carboxy-terminal domain (CTD) code. Chem Rev 113, 8456–8490, doi: 10.1021/cr400071f (2013). - DOI - PubMed

Methods references

    1. Bolte S & Cordelieres FP A guided tour into subcellular colocalization analysis in light microscopy. J Microsc 224, 213–232, doi: 10.1111/j.1365-2818.2006.01706.x (2006). - DOI - PubMed
    1. Meyer KD et al. Cooperative activity of cdk8 and GCN5L within Mediator directs tandem phosphoacetylation of histone H3. EMBO J 27, 1447–1457, doi: 10.1038/emboj.2008.78 (2008). - DOI - PMC - PubMed
    1. Shen L, Shao N, Liu X & Nestler E ngs.plot: Quick mining and visualization of next-generation sequencing data by integrating genomic databases. BMC Genomics 15, 284, doi: 10.1186/1471-2164-15-284 (2014). - DOI - PMC - PubMed
    1. Grimm JB et al. A general method to improve fluorophores for live-cell and single-molecule microscopy. Nat Methods 12, 244–250, 243 p following 250, doi: 10.1038/nmeth.3256 (2015). - DOI - PMC - PubMed
    1. tlambert03/LLSpy: v0.3.8. (Zenodo, 2018).

Publication types