. 2019 Aug 5;5(2):vez028.
doi: 10.1093/ve/vez028. eCollection 2019 Jul.

DISSEQT-DIStribution-based modeling of SEQuence space Time dynamics

Affiliations

DISSEQT-DIStribution-based modeling of SEQuence space Time dynamics

R Henningsson et al. Virus Evol. .

Erratum in

Abstract

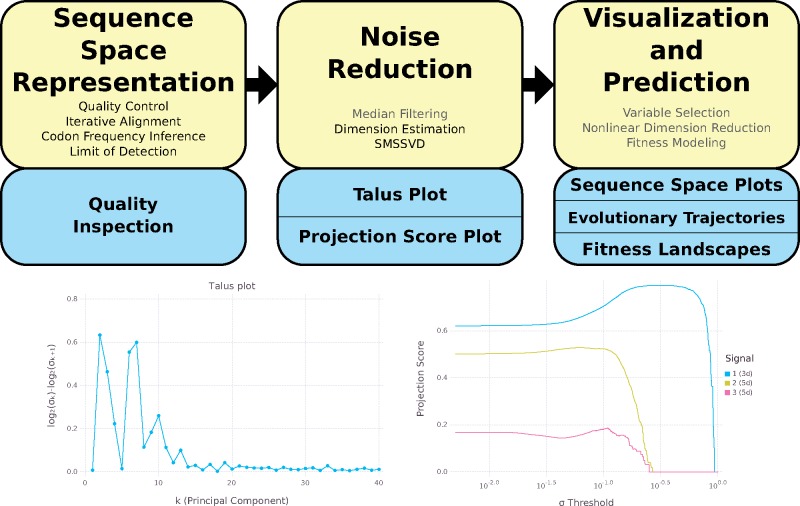
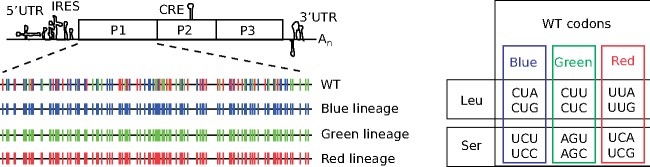
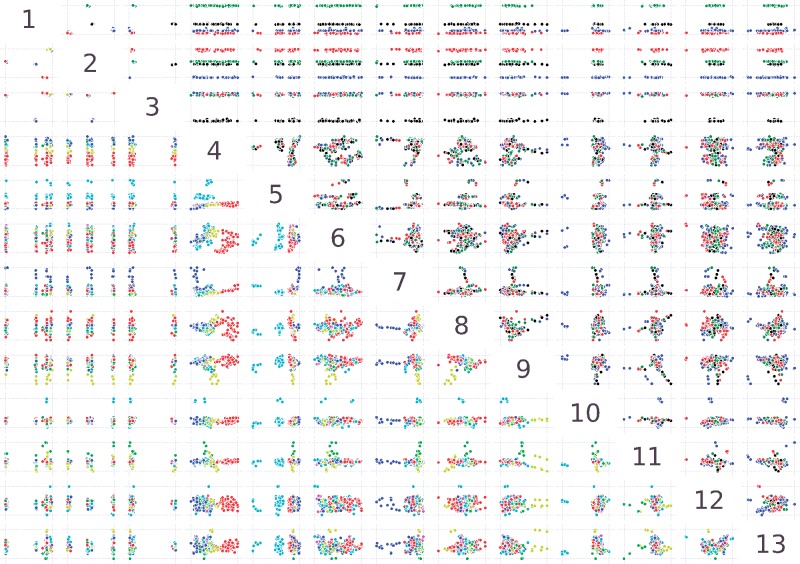
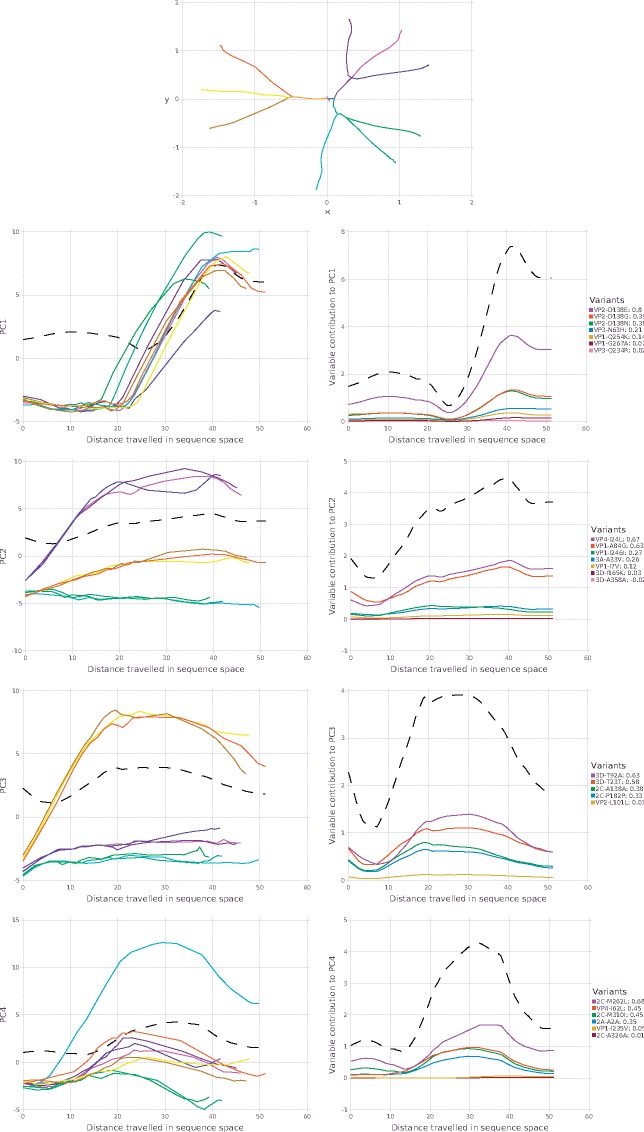
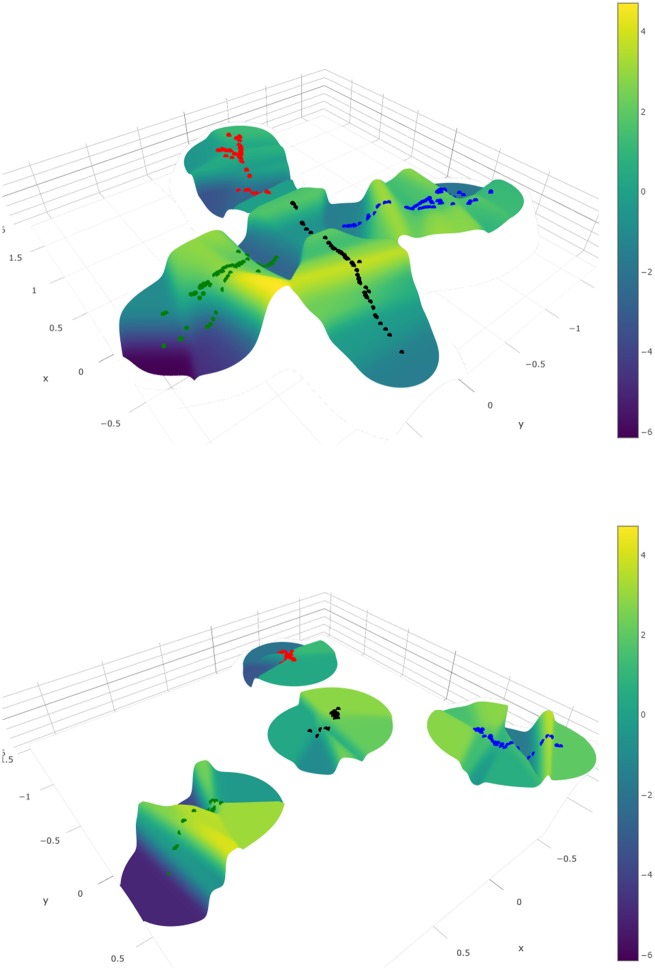
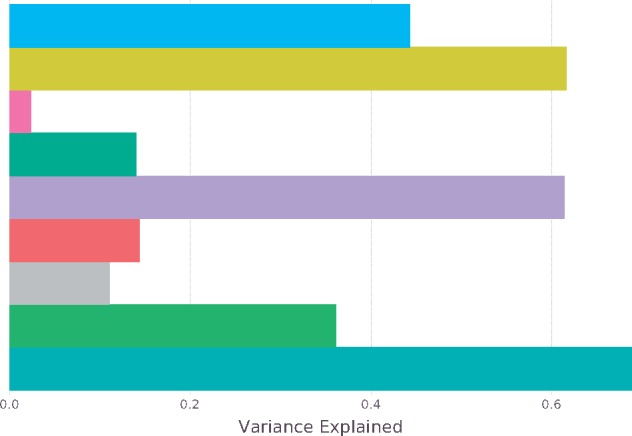
Rapidly evolving microbes are a challenge to model because of the volatile, complex, and dynamic nature of their populations. We developed the DISSEQT pipeline (DIStribution-based SEQuence space Time dynamics) for analyzing, visualizing, and predicting the evolution of heterogeneous biological populations in multidimensional genetic space, suited for population-based modeling of deep sequencing and high-throughput data. The pipeline is openly available on GitHub (https://github.com/rasmushenningsson/DISSEQT.jl, accessed 23 June 2019) and Synapse (https://www.synapse.org/#!Synapse: syn11425758, accessed 23 June 2019), covering the entire workflow from read alignment to visualization of results. Our pipeline is centered around robust dimension and model reduction algorithms for analysis of genotypic data with additional capabilities for including phenotypic features to explore dynamic genotype-phenotype maps. We illustrate its utility and capacity with examples from evolving RNA virus populations, which present one of the highest degrees of genetic heterogeneity within a given population found in nature. Using our pipeline, we empirically reconstruct the evolutionary trajectories of evolving populations in sequence space and genotype-phenotype fitness landscapes. We show that while sequence space is vastly multidimensional, the relevant genetic space of evolving microbial populations is of intrinsically low dimension. In addition, evolutionary trajectories of these populations can be faithfully monitored to identify the key minority genotypes contributing most to evolution. Finally, we show that empirical fitness landscapes, when reconstructed to include minority variants, can predict phenotype from genotype with high accuracy.

Keywords: NGS; applied mathematics; multidimensional scaling; quasispecies.


Figures

Figure 1.
Figure 1.
Top: The DISSEQT pipeline. The yellow boxes represent algorithms and data management. The blue boxes represent plots and other output. The analysis history of all results and plots can be traced back all the way to the raw input data. Steps that are only used in some analyses are displayed in gray text. Sequence Space Representation: Per sample raw sequencing data is passed through automatic quality control and aligned to a reference genome. Codon frequencies are inferred using quality scores in the aligned data and the limit of detection is estimated for each codon at each site. These are combined to form the sequence space representation. Consensus change reports and read coverage plots aid manual quality inspection. Noise Reduction: Median filtering along the time axis is used for time series data. Talus plots are used for dimension estimation and SMSSVD reduces the dimension robustly. Visualization and Prediction: Variable selection can be used for finding a small subset of explanatory variables. Nonlinear dimension reduction captures important features for low dimensional visualization of sequence space. Evolutionary trajectories are described in both sample and variable space. Fitness landscape models are used for visualization and prediction. Bottom left: Talus plot for the SynSyn data set. After thirteen dimensions, the Talus plot shows small variations around a low mean. Bottom right: Projection Score Plot for the SynSyn data set. SMSSVD finds three signals of Dimensions 3, 5, and 5 with different optima for variance filtering. Each curve displays the projection score of a signal as a function of the variance filtering threshold.
Figure 2.
Figure 2.
Right: Clusters of Leu/Ser codons according to different viral lineages. Color coding corresponds to synonymous codons used to genetic engineered each viral lineage ‘Blue Lineage’ (blue), ‘Green Lineage’ (green), or ‘Red Lineage’ (red). Left: Schematic of the Coxsackie virus genome indicating RNA structures required for replication (5′UTR, IRES, CRE, and 3′UTR) and the single open reading frame encoding capsid structural proteins (P1 region) and non-structural proteins (P2, P3 regions). The P1 region, in expanded view, shows 117 Ser/Leu codons for the wildtype (WT), blue, green, and red viral lineages.
Figure 3.
Figure 3.
Pairwise scatter plots showing the first thirteen principal components in the analysis of the SynSyn data set plotted against each other. Plots above and below the diagonal are mirror images of each other. Each dot represents one viral population. Above the diagonal, samples are colored by lineage (black: 1, blue: 2, green: 3, red: 4) and below the diagonal, samples are colored by mutagen (red: 5-fluorouracil, light green: amiloride, blue: 5-azacytidine, yellow: Mn2+, cyan: ribavirin, Magenta: mock). All axes are rescaled to fill the plot area.
Figure 4.
Figure 4.
Top: Overview of the evolutionary trajectories of the nine replicates in the adaptability data set (Bordería et al. 2015), shown after nonlinear dimension reduction. Wild type (WT) replicates are shown in magenta–purple colors, replicates from the high fidelity lineage in green–cyan colors and replicates from the low fidelity lineage in yellow–orange colors. The starting point in sequence space is very close for all replicates. The splits indicate when the evolutionary trajectories bifurcate, i.e. when the replicates start to deviate from each other. Left column: Principal components for replicates as a function of arc length. Right column: Variable contributions as a function of arc length. Both columns: The dotted black line shows the total contribution to σk at s.
Figure 5.
Figure 5.
Top: Fitness landscape visualization of the SynSyn data set. Bottom: The same fitness landscape, constructed from consensus data only. Samples are colored by lineage (black: 1, blue: 2, green: 3, red: 4).
Figure 6.
Figure 6.
Comparison between different fitness predictors. Gaussian Kernel Smoother Predictors: Isomap 2d (blue), SMSSVD 13d (yellow), Consensus Isomap 2d (pink), and Consensus 13d (green). Nearest Neighbor Predictors: SMSSVD 13d (purple) and Consensus (red). Group Predictors: Lineage/Mutagen (gray), Lineage/Dose (light green), Lineage/Mutagen/Dose (turquoise).

References

    1. Acevedo A., Brodsky L., Andino R. (2014) ‘Mutational and Fitness Landscapes of an RNA Virus Revealed through Population Sequencing’, Nature, 505: 686–90. - PMC - PubMed
    1. Aronesty E. (2011) ‘ea-utils: Command-Line Tools for Processing Biological Sequencing Data’ <https://github.com/ExpressionAnalysis/ea-utils> accessed 23 June 2019.
    1. Bacher R., Kendziorski C. (2016) ‘Design and Computational Analysis of Single-Cell RNA-Sequencing Experiments’, Genome Biology, 17: 63. - PMC - PubMed
    1. Beaucourt S. et al. (2011) ‘Isolation of Fidelity Variants of RNA Viruses and Characterization of Virus Mutation Frequency’, Journal of Visualized Experiments, 16. DOI: 10.3791/2953. - PMC - PubMed
    1. Beerenwinkel N. et al. (2012) ‘Challenges and Opportunities in Estimating Viral Genetic Diversity from Next-Generation Sequencing Data’, Frontiers in Microbiology, 3: 329. - PMC - PubMed