

Diagnostic imaging trends in the emergency department: an extensive single-center experience
- PMID: 31392034
- PMCID: PMC6669846
- DOI: 10.1177/2058460119860404
Diagnostic imaging trends in the emergency department: an extensive single-center experience
Abstract
Background: Emergency Department imaging volume has increased significantly in North America and Asia.
Purpose: To assess Emergency Department imaging trends in a European center.
Material and methods: The institutional radiological information system was queried for all computed tomography (CT), ultrasound (US), and magnetic resonance (MR) studies performed for the Emergency Department during 2002-2017. Descriptive statistics and linear regression analyses were used to assess overall study rates and temporal trends in overall and after-hours imaging after adjusting for patient visitations.
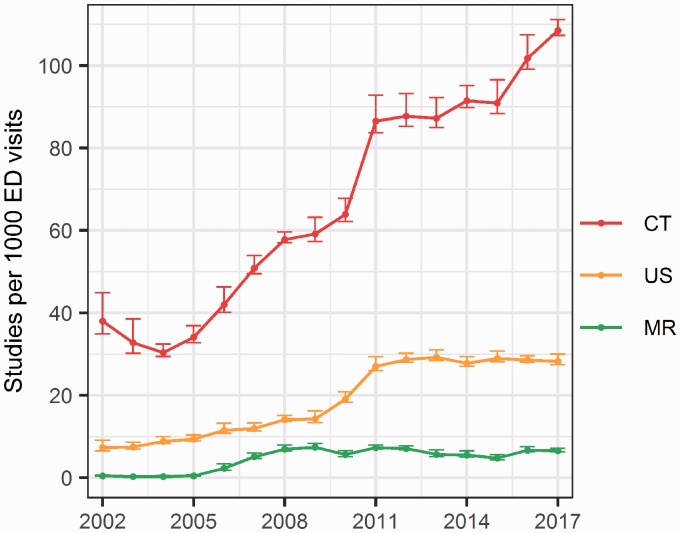
Results: CT use increased significantly from 38/1000 visits to 108/1000 at the end of the observation by 5.5 new exams per 1000 visits/year (P < 0.0001). US use increased gradually at a rate of 1.2/1000 per year during 2002-2008 with an accelerated annual increase of 6.4/1000 in 2009-2011 (P < 0.0001) raising US rates from 7/1000 to 28/1000 visits per year with stable rates from 2012 onwards. After on-site MR became available in 2004, its use increased from 0.3/1000 to 7/1000 at a rate of 1.9/1000 visits per year in 2005-2009 (P < 0.0001) and remained stable from 2010. While there was a significant increase in after-hours imaging, growth remained proportional to the overall trend in the use of CT, MR, and night-time CT with the exception of a slight decrease in after-hour US in favor of standard working hours (P < 0.0001).
Conclusion: All modalities increased significantly in volume adjusted usage. US and MR rates have been stable since 2012 and 2010, respectively, after periods of increase while CT use continues to increase. Demand for after-hours imaging was mostly proportional to the overall trend.
Keywords: Emergency medicine; emergency radiology; health resources; imaging utilization; imaging volume.
Figures

Similar articles
-
Trends in case-mix-adjusted use of radiology resources at an urban level 1 trauma center.AJR Am J Roentgenol. 2001 Apr;176(4):851-4. doi: 10.2214/ajr.176.4.1760851. AJR Am J Roentgenol. 2001. PMID: 11264063
-
Identifying Acuity Level-Based Adult Emergency Department Use Time Trends Across Demographic Characteristics.Cureus. 2021 Feb 8;13(2):e13225. doi: 10.7759/cureus.13225. Cureus. 2021. PMID: 33728175 Free PMC article.
-
MRI usage in a pediatric emergency department: an analysis of usage and usage trends over 5 years.Pediatr Radiol. 2017 Mar;47(3):327-332. doi: 10.1007/s00247-016-3764-y. Epub 2017 Jan 12. Pediatr Radiol. 2017. PMID: 28083700
-
Overnight subspecialty radiology coverage: review of a practice model and analysis of its impact on CT utilization rates in academic and community emergency departments.AJR Am J Roentgenol. 2012 Sep;199(3):623-6. doi: 10.2214/AJR.11.8377. AJR Am J Roentgenol. 2012. PMID: 22915403
-
Temporal Trends and Predictors of Thirty-Day Readmissions and Emergency Department Visits Following Total Knee Arthroplasty in Ontario Between 2003 and 2016.J Arthroplasty. 2020 Feb;35(2):364-370. doi: 10.1016/j.arth.2019.09.015. Epub 2019 Sep 14. J Arthroplasty. 2020. PMID: 31732370 Review.
Cited by
-
Gallstones Detection on Dual-Energy Computerized Tomography-Is It Ready for Real-World Use? A Retrospective Observational Study.J Comput Assist Tomogr. 2024 Jan-Feb 01;48(1):35-41. doi: 10.1097/RCT.0000000000001535. Epub 2023 Aug 3. J Comput Assist Tomogr. 2024. PMID: 37531641 Free PMC article.
-
Temporal trends in ultrasound utilisation in the radiology department of a tertiary hospital.SA J Radiol. 2022 Aug 29;26(1):2449. doi: 10.4102/sajr.v26i1.2449. eCollection 2022. SA J Radiol. 2022. PMID: 36093213 Free PMC article.
-
Increasing use of CT requested by emergency department physicians in tertiary hospitals in Western Australia 2003-2015: an analysis of linked administrative data.BMJ Open. 2021 Mar 4;11(3):e043315. doi: 10.1136/bmjopen-2020-043315. BMJ Open. 2021. PMID: 33664075 Free PMC article.
-
Outcomes of abdominal pain among children presenting to the Emergency Department of a tertiary hospital in the Republic of Ireland before and during the COVID-19 pandemic.Ir J Med Sci. 2024 Apr;193(2):1033-1041. doi: 10.1007/s11845-023-03547-8. Epub 2023 Oct 18. Ir J Med Sci. 2024. PMID: 37851331
-
Letter to the editor: "Utilization of CT and MRI scanning in Taiwan, 2000-2017".Insights Imaging. 2023 May 15;14(1):83. doi: 10.1186/s13244-023-01420-x. Insights Imaging. 2023. PMID: 37184567 Free PMC article. No abstract available.
References
-
- Levin DC, Rao VM, Parker L, et al. Continued growth in emergency department imaging is bucking the overall trends. J Am Coll Radiol 2014; 11:1044–1047. - PubMed
-
- Rosenkrantz AB, Hanna TN, Babb JS, et al. Changes in emergency department imaging: perspectives from national patient surveys over two decades. J Am Coll Radiol 2017; 14:1282–1290. - PubMed
-
- Broder J, Fordham LA, Warshauer DM. Increasing utilization of computed tomography in the pediatric emergency department, 2000–2006. Emerg Radiol 2007; 14:227–232. - PubMed
LinkOut - more resources
Full Text Sources
