. 2019 Oct 10;47(18):9524-9541.
doi: 10.1093/nar/gkz660.

The mRNA degradation factor Xrn1 regulates transcription elongation in parallel to Ccr4

Affiliations

The mRNA degradation factor Xrn1 regulates transcription elongation in parallel to Ccr4

Victoria Begley et al. Nucleic Acids Res. .

Abstract

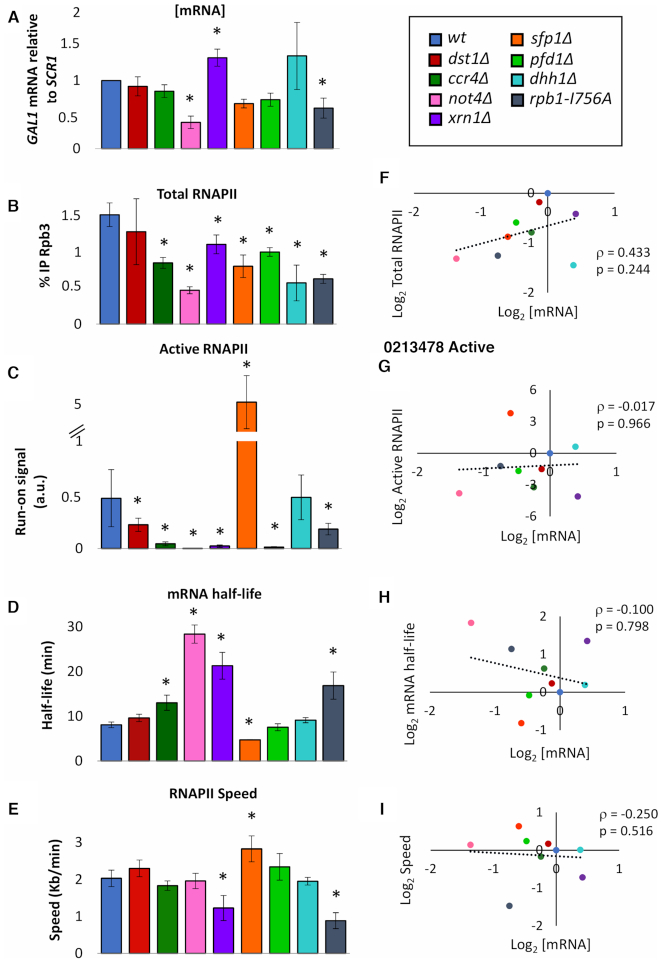
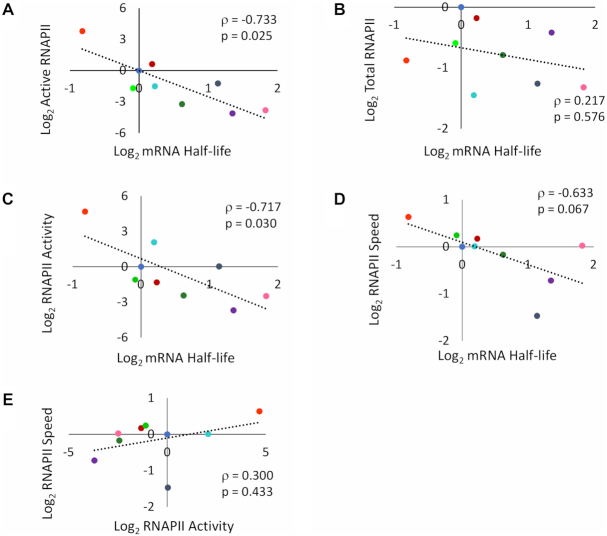
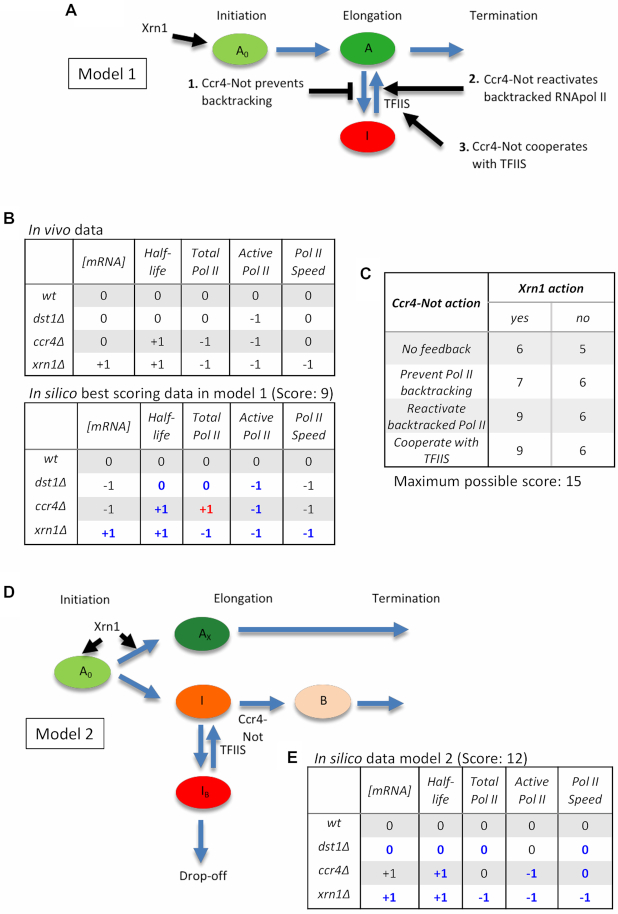
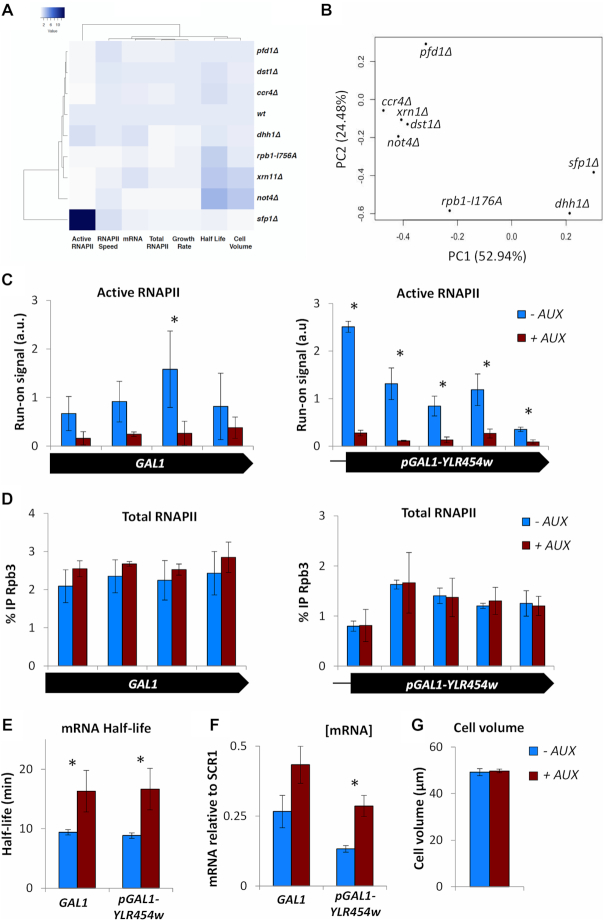
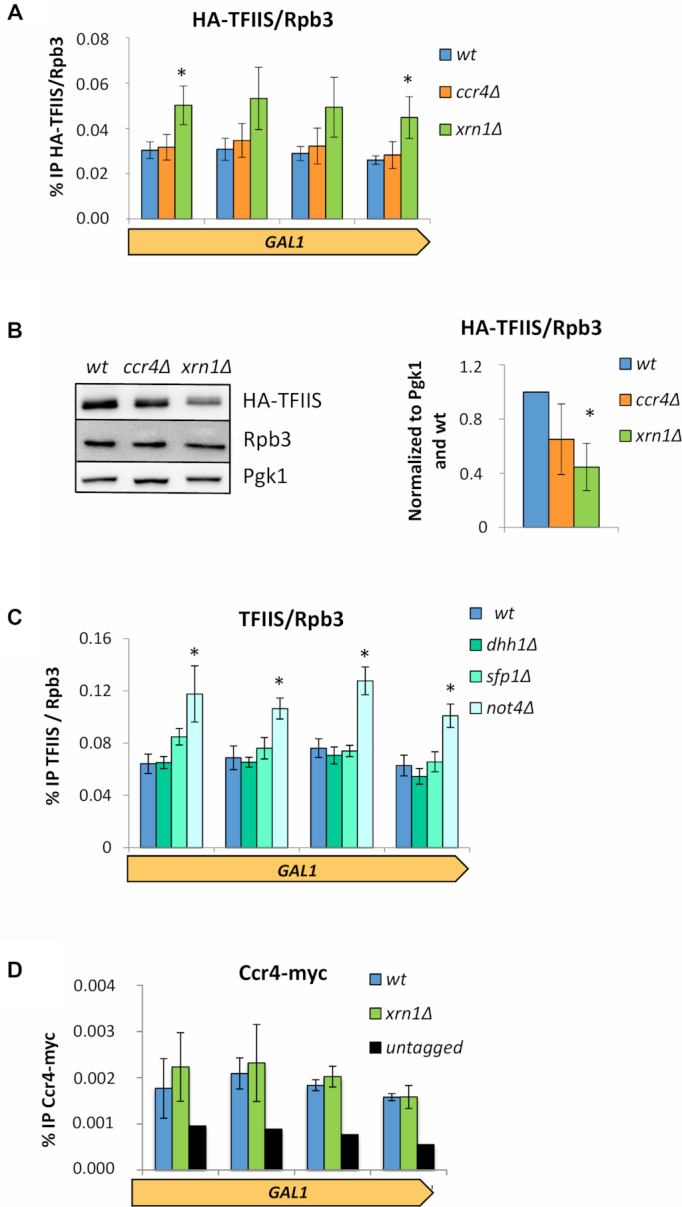
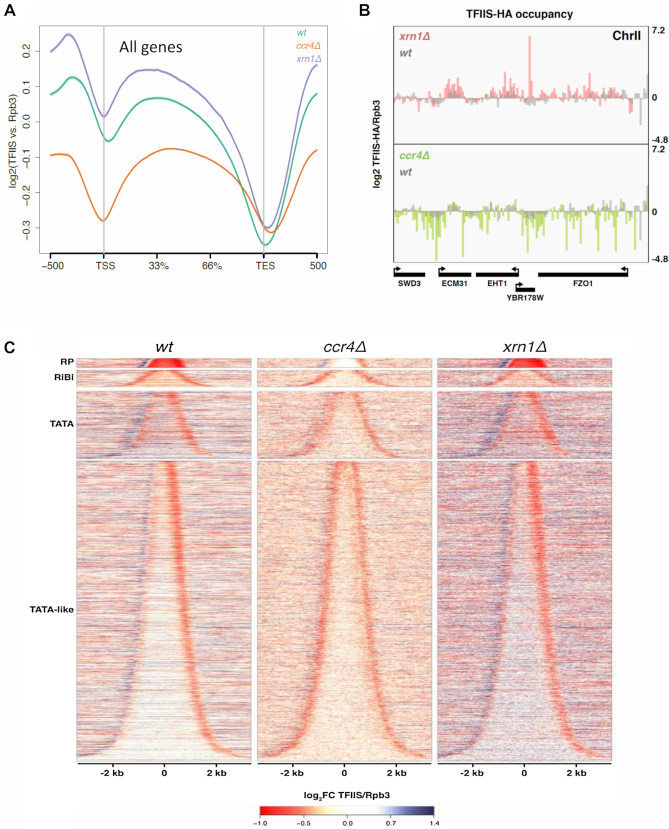
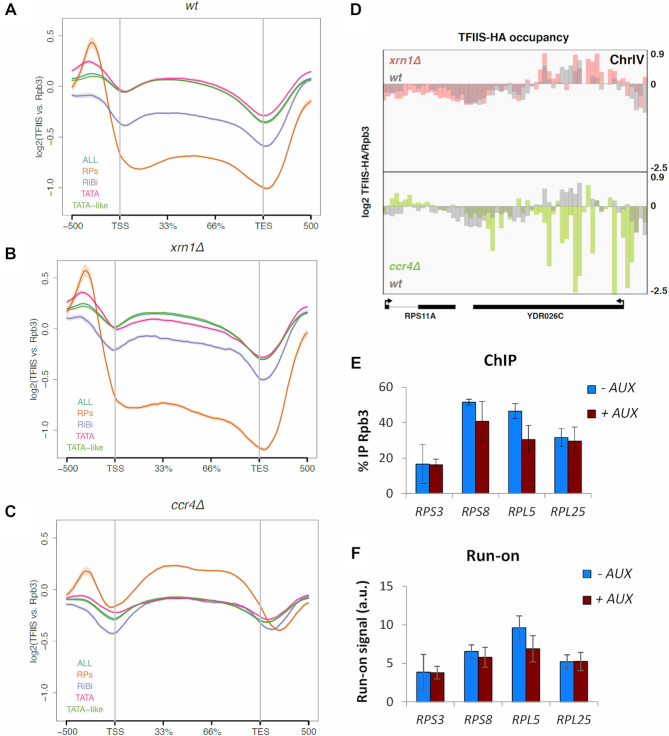
Co-transcriptional imprinting of mRNA by Rpb4 and Rpb7 subunits of RNA polymerase II (RNAPII) and by the Ccr4-Not complex conditions its post-transcriptional fate. In turn, mRNA degradation factors like Xrn1 are able to influence RNAPII-dependent transcription, making a feedback loop that contributes to mRNA homeostasis. In this work, we have used repressible yeast GAL genes to perform accurate measurements of transcription and mRNA degradation in a set of mutants. This genetic analysis uncovered a link from mRNA decay to transcription elongation. We combined this experimental approach with computational multi-agent modelling and tested different possibilities of Xrn1 and Ccr4 action in gene transcription. This double strategy brought us to conclude that both Xrn1-decaysome and Ccr4-Not regulate RNAPII elongation, and that they do it in parallel. We validated this conclusion measuring TFIIS genome-wide recruitment to elongating RNAPII. We found that xrn1Δ and ccr4Δ exhibited very different patterns of TFIIS versus RNAPII occupancy, which confirmed their distinct role in controlling transcription elongation. We also found that the relative influence of Xrn1 and Ccr4 is different in the genes encoding ribosomal proteins as compared to the rest of the genome.


Figures

Figure 1.
Figure 1.
GAL1 mRNA levels resists most perturbations of synthesis and decay. (A) GAL1 mRNA levels in exponential cultures of the indicated mutant strains. Apparent [mRNA] was calculated relative to SCR1 by RT-qPCR. (B) Total RNAPII occupancy as measured by anti-Rpb3 ChIP. Each bar represents the average value of four amplicons across the GAL1 gene. (C) Active RNAPII as measured by the incorporation of radioactive 32UTP (transcriptional run-on). The bars represent the average value of four probes across the GAL1 gene. (D) GAL1 mRNA as measured by RT-qPCR before and after shutting off transcription by glucose. Half-lives were determined by calculating the time it takes for half of the initial mRNA to be degraded. (E) RNAPII speed as measured by anti-Rpb3 ChIP in the long GAL1p-YLR454w gene before shutting off transcription, and three times afterwards. Values were normalized to time 0, and RNAPII speed was calculated. All bars represent mean and standard deviation of three biological replicates (* if p < 0.05 in a Student’s t-test). (FI) To the right of each of the previous graphs, we have represented the corresponding variable with respect to apparent [mRNA]. We never found any significant correlation using a Spearman’s test (ρ represents the Spearman coefficient and the p, the p-value).
Figure 2.
Figure 2.
Speed and activity of elongating RNAPII correlates with mRNA half-life. Scatter plots comparing normalized values of the mutants mentioned in Figure 1 for active RNAPII versus mRNA half-life (A), total RNAPII occupancy versus mRNA half-life (B), RNAPII specific activity (active/total ratio) versus mRNA half-life (C), RNAPII speed versus mRNA half-life (D) and RNAPII speed versus RNAPII specific activity (E). Plots (A), (C) and (D) all showed negative correlations, whilst (B) and (E) presented no significant correlation. In all graphs, the ρ represents the Spearman coefficient. P-values are also shown. Colour code like in Figure 1.
Figure 3.
Figure 3.
Multi-agent modelling predicts an additional connection from mRNA decay to transcription elongation. (A) Scheme showing the possible interactions of the degradation machinery with the transcription machinery conforming the different model variants. An arrow indicates that Xrn1 can stimulate RNAPII initiation. Other arrows indicate Ccr4–Not action where it can either (i) prevent backtracking, (ii) reactivate backtracked RNAPII or (iii) cooperate with TFIIS in reactivating backtracked RNAPII. TFIIS has also been included in this model. It reactivates backtracked RNAPII. (B) Matrices showing the in vivo data and the in silico data for one of the best scoring model variants (Ccr4–Not reactivates backtracked RNAPII and Xrn1 presents feedback to the promoter of genes). We compared total mRNA, mRNA half-life, Total RNAPII, Active RNAPII and RNAPII speed in the dst1Δ, ccr4Δ and xrn1Δ mutants. If any value was not significantly different from the wild-type, then a 0 was assigned to that variable and mutant. If it was significantly different, then a −1 or +1 was assigned depending on if the number was significantly larger or smaller than that of the corresponding wild-type value. A Student’s t-test was carried out to compare values and were considered significant if p< 0.05. The hits with respect to the in vivo data add 1 point to the overall score. Those values that vary with respect to the in vivo data do not change the score, unless it is a −1/+1 difference where 1 point is taken away from the overall score. (C) Table showing the scores obtained in the first mathematical model when we compare the model variants to the in vivo data. The columns indicate whether Xrn1 presents feedback to the gene promoter (yes) or not (no). The rows indicate the Ccr4–Not action undertaken. The models were scored as indicated in (B), with a maximum possible score of 15. In all cases, there was Ccr4–Not imprinting. (D) Scheme illustrating how the second model was programmed. A0 represents the active RNAPII. Xrn1 can act upon this active RNAPII, turning it into Ax, an RNAPII that does not backtrack and in consequence transcribes faster. If Xrn1 does not act, then the RNAPII can become inactive (I). If TFIIS or Ccr4–Not does not act, then the RNAPII turns into a backtracked polymerase (Ib) and eventually drops-off the gene. If TFIIS is present, it can reactivate the polymerase before it drops-off. If Ccr4–Not is present, it can interact with RNAPII and allows it to stay in active transcription. (E) Matrix showing the in silico data obtained in the second model. Values were assigned as in (B). There were 12 hits with respect to the in vivo data, with a total score of 12 over 15.
Figure 4.
Figure 4.
Lack of Xrn1 phenotypically associates with lack of TFIIS and provokes fast inactivation of elongating RNAPII. (A) Spearman hierarchical clustering of all the data summarized in Supplementary Figure S2B. xrn1Δ primarily associates with rpb1-I746A. (B) A principal component analysis of the same data associates mRNA decay mutants with dst1Δ. The first component (PC1) explains 52.94% of the variables and the second component (PC2) the 24.48%. (C) Active RNAPII along the GAL1 and GAL1p-YLR454w gene is decreased in an Xrn1-AID strain, where Xrn1 is rapidly depleted from the cell upon the addition of auxin. Here, we compare the control (-AUX) to Xrn1-depleted cells (+AUX). (D) Total RNAPII is unaffected along the GAL1 and GAL1p-YLR454w genes when comparing control to Xrn1 depleted cells. (E) The mRNA half-life of GAL1 and GAL1p-YLR454w is significantly increased upon Xrn1 depletion. (F) Apparent [mRNA] of both genes is also increased upon Xrn1 depletion. (G) Cell volume is unaffected after depleting Xrn1 for 1 h. All bars represent mean and standard deviation of three biological replicates (* if p< 0.05 in a Student’s t-test).
Figure 5.
Figure 5.
xrn1Δ and ccr4Δ cause different effects on TFIIS recruitment to elongating RNAPII. (A) The amount of TFIIS/Rpb3 found on the GAL1 gene is significantly increased in an xrn1Δ mutant. This was not the case for ccr4Δ, as the values were similar to that of the wild-type. ChIPs were performed for HA-TFIIS and Rpb3 using the same cell extract in parallel. We were then able to directly compare the amounts of TFIIS and Rpb3 in each strain. The bars represent the mean and standard deviation of three biological replicates (* if p< 0.05 in a Student’s t-test). (B) The total protein levels of TFIIS/Rpb3 is reduced in ccr4Δ and xrn1Δ mutants compared to the wild-type. We performed a western blot of total extract proteins and used an antibody against a HA tagged TFIIS, Rpb3 and Pgk1 (loading control). The bars represent the mean and standard deviation of three biological replicates (* if p< 0.05 in a Student’s t-test). (C) The TFIIS/Rpb3 ratio found on the GAL1 gene is significantly increased in a not4Δ mutant. No changes compared to the wt were observed for other mutants tested: dhh1Δ and sfp1Δ. Results obtained as in (A). (D) Ccr4 occupancy of GAL1 was not altered by lack of Xrn1. ChIPs were performed using anti-C-Myc antibodies. The bars represent the mean and standard deviation of three biological replicates. Values were small but consistent and were in all cases higher than the untagged control.
Figure 6.
Figure 6.
The mRNA decay mutants ccr4Δ and xrn1Δ show distinct alterations of TFIIS/Rpb3 along genes in a genome wide analysis. (A) Whole genome metagene analysis shows that ccr4Δ and xrn1Δ present different TFIIS/Rpb3 profiles. Lines represent the mean profile of TFIIS/Rpb3 along all yeast genes in wild-type, ccr4Δ and xrn1Δ strains. TSS is the transcription start site of genes and TES the transcript exit site. The profile is represented as the log2 of the fold change between the TFIIS ChIP and the Rpb3 ChIP. (B) The mapping of TFIIS/Rpb3 in five different genes shows an opposite effect for xrn1Δ and ccr4Δ. There is an increased signal for xrn1Δ than for the wild type in this region of the genome. However, when we turn our attention to ccr4Δ, we can observe the opposite in the same positions. (C) A genome wide study (ChIP-seq) of TFIIS/Rpb3 on genes shows a different profile for ccr4Δ, xrn1Δ and the wild type. We have represented all yeast genes ordered by gene length, which leads to a bell shape, and separated out four different groups of genes depending on their promotor type (TATA or TATA-like genes, and within the latter, we seperated out ribosomal protein (RP) genes and ribosome biogenesis (RiBi) genes). In the wt we can observe a downregulation of TFIIS/Rpb3 mostly at the 3' end of genes, and an upregulation in the 5' ends. We obtained a similiar profile for xrn1Δ, although with a stronger effect at 5' ends. However, in ccr4Δ downregulation of TFIIS/Rpb3 occurs at both 5' and 3' ends of genes. ChIPs of HA-TFIIS and Rpb3 were performed using the same cell extract and in parallel. We represent the mean of two biological replicates.
Figure 7.
Figure 7.
Transcription elongation in RP genes is differentially influenced by Xrn1 and Ccr4, as compared with other gene categories. (A) Whole genome metagene analysis of the wild-type shows changes in the TFIIS/Rpb3 profile depending on the gene category. We have represented with a line the mean profile of TFIIS/Rpb3 along all yeast genes. We then divided up the genes into different categories depending on their type of promoter: TATA or TATA-like genes, excluding ribosomal protein genes (RP) or ribosomal biogenesis genes (RiBi). The RP and RiBi genes seem to behave differently from the rest of the genes, with lower overall amounts of TFIIS throughout the entire metagene. TSS is the transcription start site of genes and TES the transcript exit site. The profile is represented as the log2 of the fold change between the TFIIS ChIP and the Rpb3 ChIP. ChIPs of HA-TFIIS and Rpb3 were performed using the same cell extract and in parallel. We represent the mean of two biological replicates. (B) Whole genome metagene analysis of the TFIIS/Rpb3 ChIP in xrn1Δ. We have represented the same analysis as in (A) but for the xrn1Δ mutant. (C) Whole genome metagene analysis of the TFIIS/Rpb3 ChIP in ccr4Δ. We have represented the same analysis as in (A) but for the ccr4Δ mutant. In this case, RP genes show higher TFIIS/Rpb3 ratios than the rest of genes, and RiBi genes behave the same as all genes. (D) The mapping of TFIIS/Rpb3 on the RPS11A and YDR026C genes show a distinct effect for xrn1Δ and ccr4Δ. In the top part of the panel, we can observe the occupancy of TFIIS/Rpb3 in the wild-type and xrn1Δ. For the most part, there is similar occupancy in xrn1Δ and the wild-type. However, there is clearly decreased signal for ccr4Δ (at the bottom of the panel) at the exact same positions. (E and F) Xrn1 rapid depletion by auxin did not perturb Rpb3 occupancy (E) or activity (F) in RP genes. We performed ChIP against Rpb3 and transcriptional run-on in the AID Xrn1-degron strain without (-AUX) or with (+AUX) auxin addition for 1 h. No significant differences between samples were detected. These Rpb3 ChIP and transcription run-on experiments are directly comparable as the same yeast culture was used for both experiments. We represent the mean of three biological replicates.

References

    1. Timmers H.T.M., Tora L.. Transcript buffering: a balancing act between mRNA synthesis and mRNA degradation. Mol. Cell. 2018; 72:10–17. - PubMed
    1. Das S., Sarkar D., Das B.. The interplay between transcription and mRNA degradation in Saccharomyces cerevisiae. Microb. Cell. 2017; 4:212–228. - PMC - PubMed
    1. Braun K.A., Young E.T.. Coupling mRNA synthesis and decay. Mol. Cell Biol. 2014; 34:4078–4087. - PMC - PubMed
    1. Haimovich G., Choder M., Singer R.H., Trcek T.. The fate of the messenger is pre-determined: a new model for regulation of gene expression. Biochim. Biophys. Acta Gene Regul. Mech. 2013; 1829:643–653. - PMC - PubMed
    1. Choder M. mRNA imprinting: additional level in the regulation of gene expression. Cell Logist. 2011; 1:37–40. - PMC - PubMed

Publication types

MeSH terms