. 2020 Jan;30(1):195-205.
doi: 10.1007/s00330-019-06381-8. Epub 2019 Aug 7.

Radiomic feature reproducibility in contrast-enhanced CT of the pancreas is affected by variabilities in scan parameters and manual segmentation

Affiliations

Radiomic feature reproducibility in contrast-enhanced CT of the pancreas is affected by variabilities in scan parameters and manual segmentation

Rikiya Yamashita et al. Eur Radiol. 2020 Jan.

Abstract

Objectives: This study aims to measure the reproducibility of radiomic features in pancreatic parenchyma and ductal adenocarcinomas (PDAC) in patients who underwent consecutive contrast-enhanced computed tomography (CECT) scans.

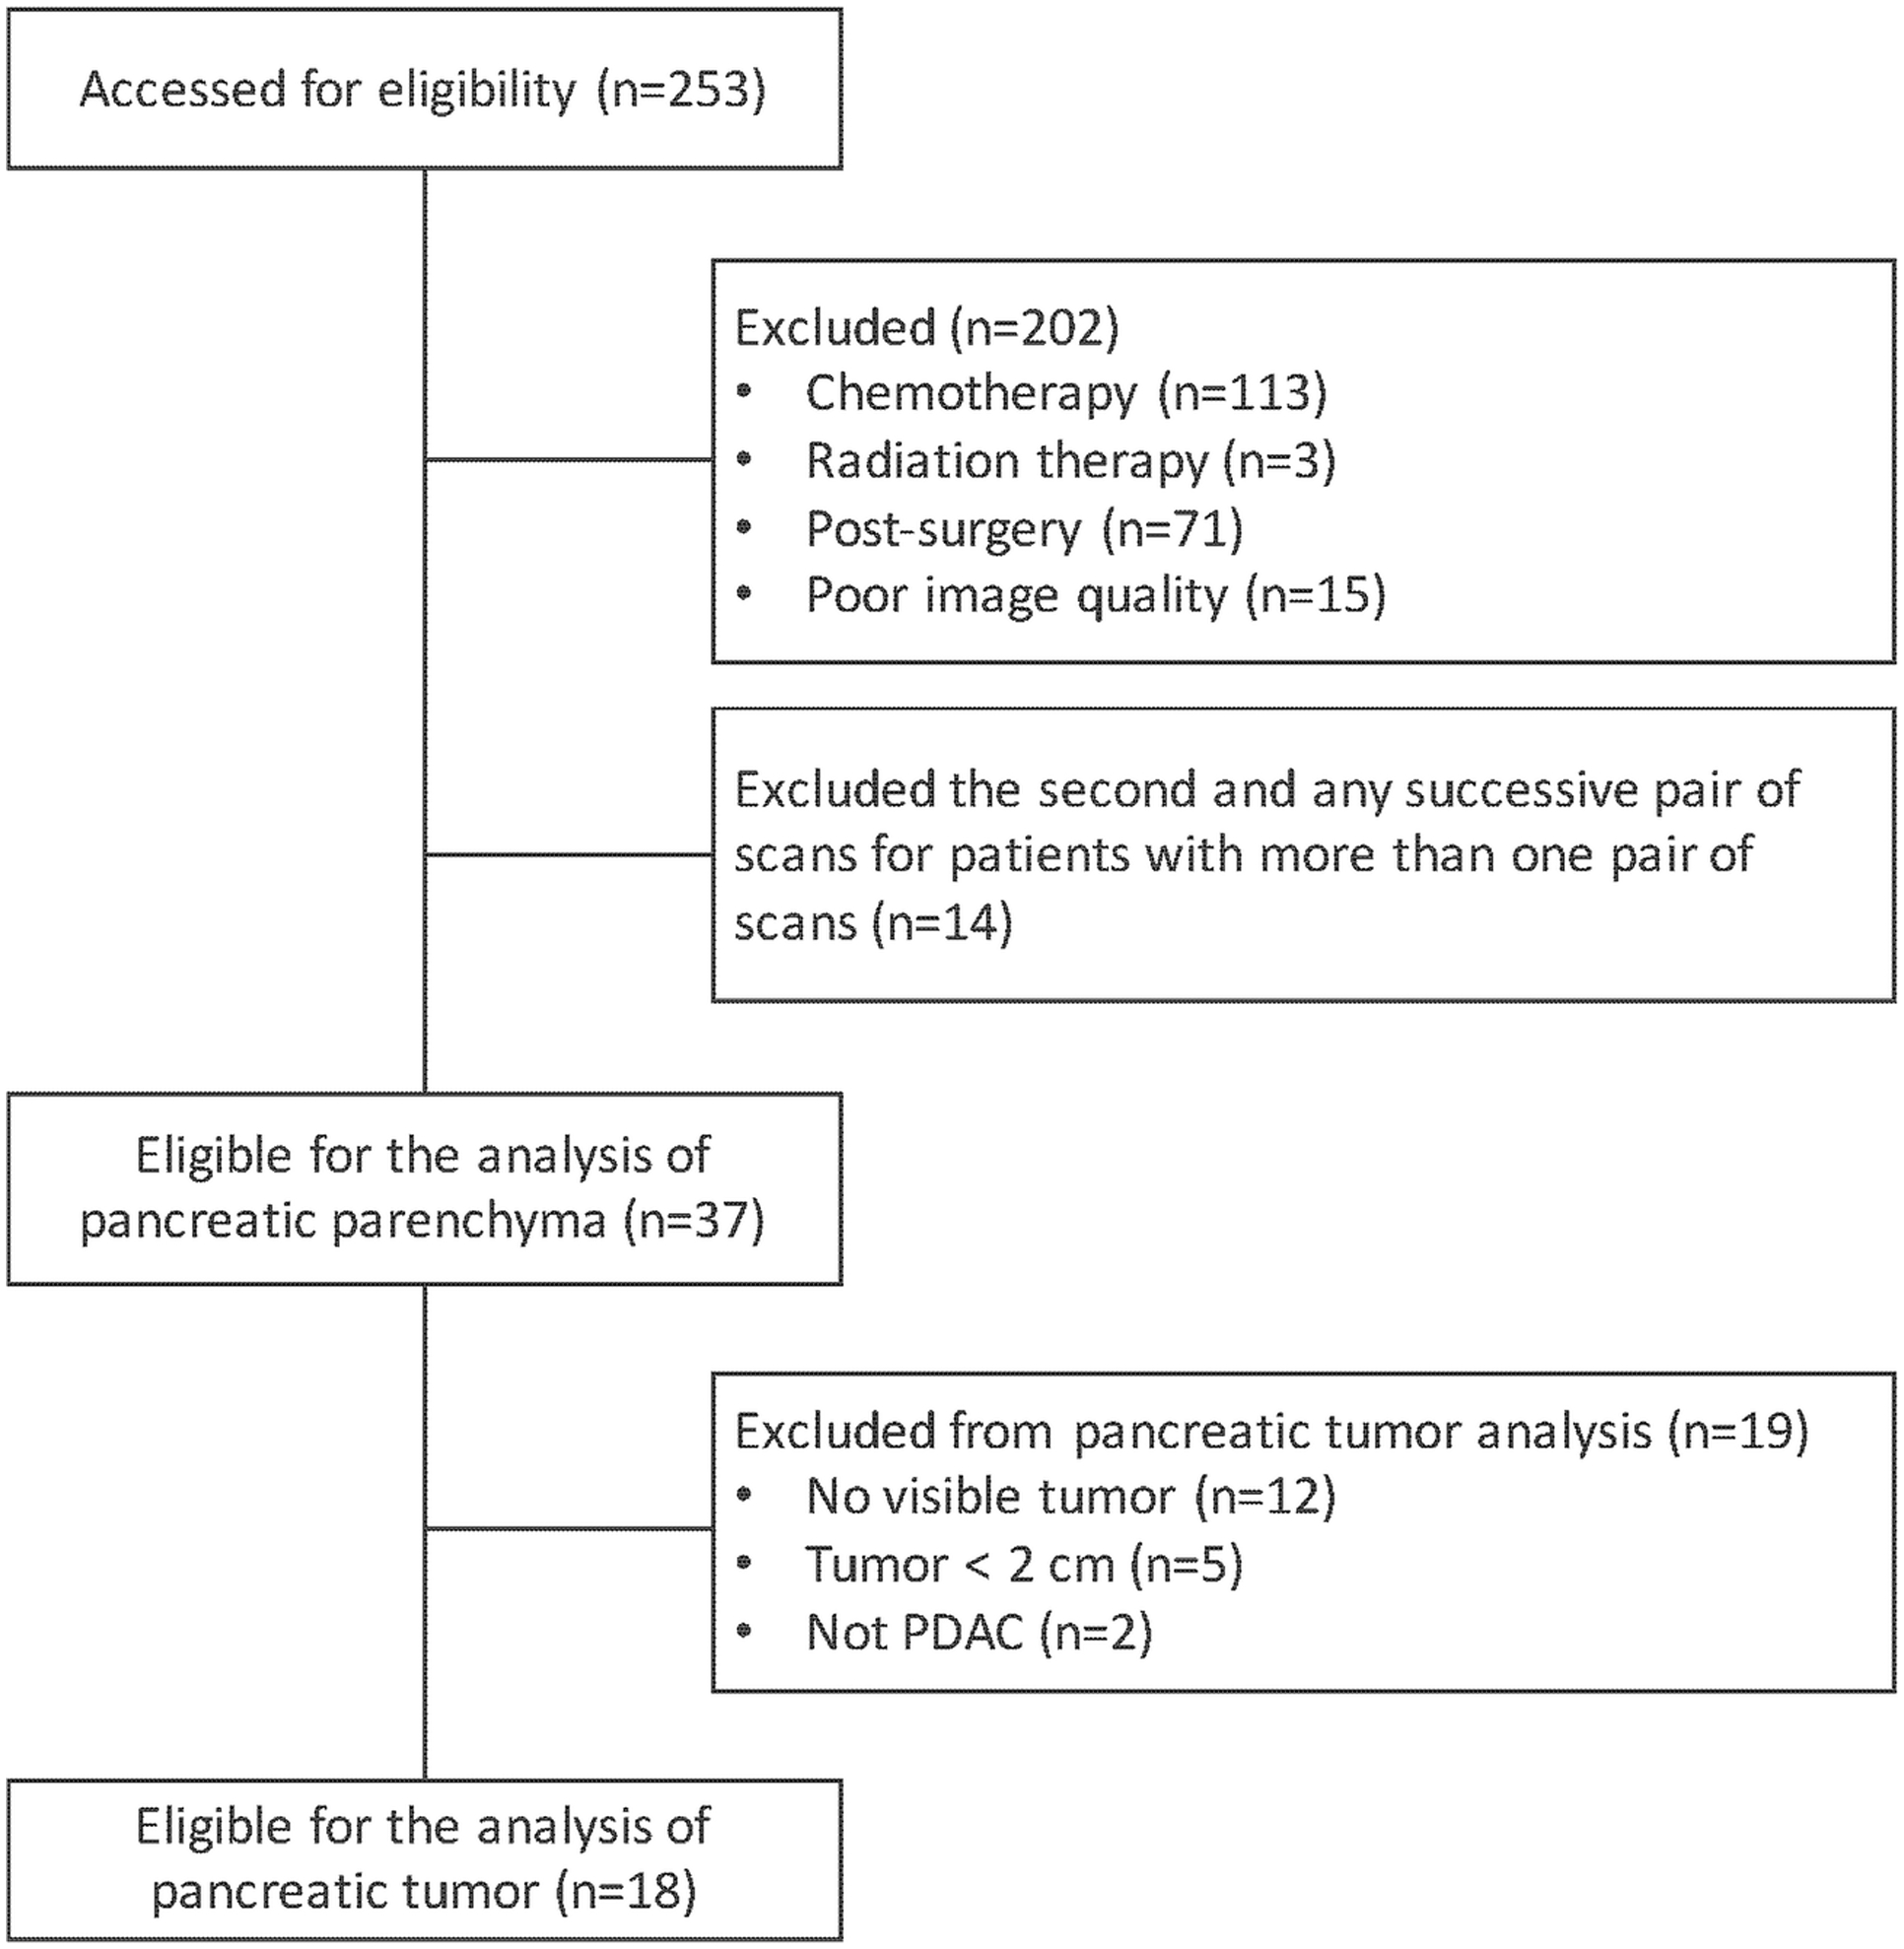
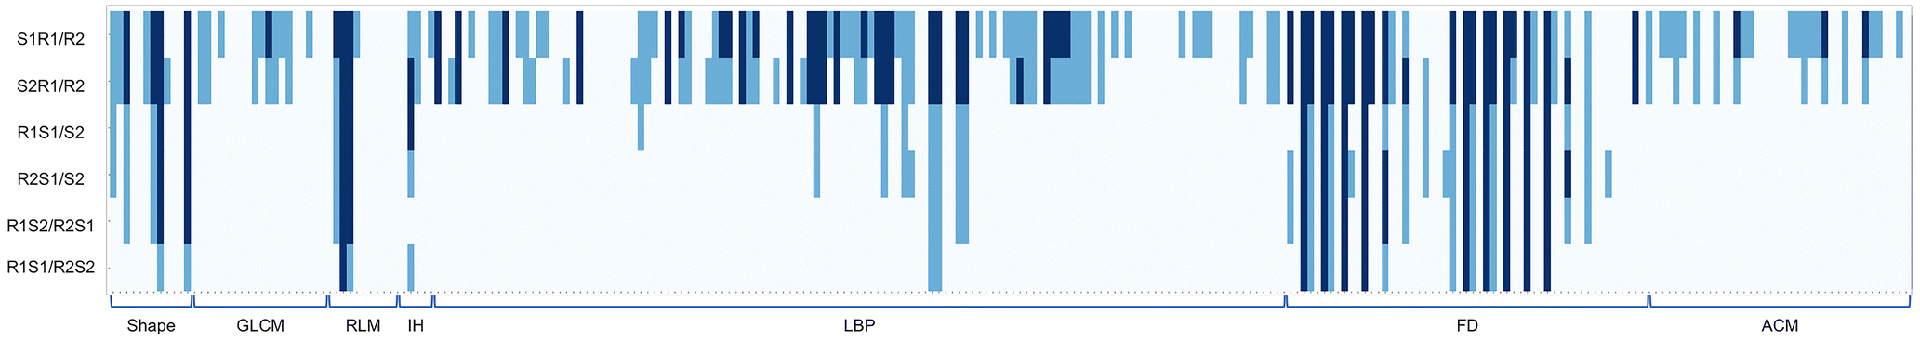
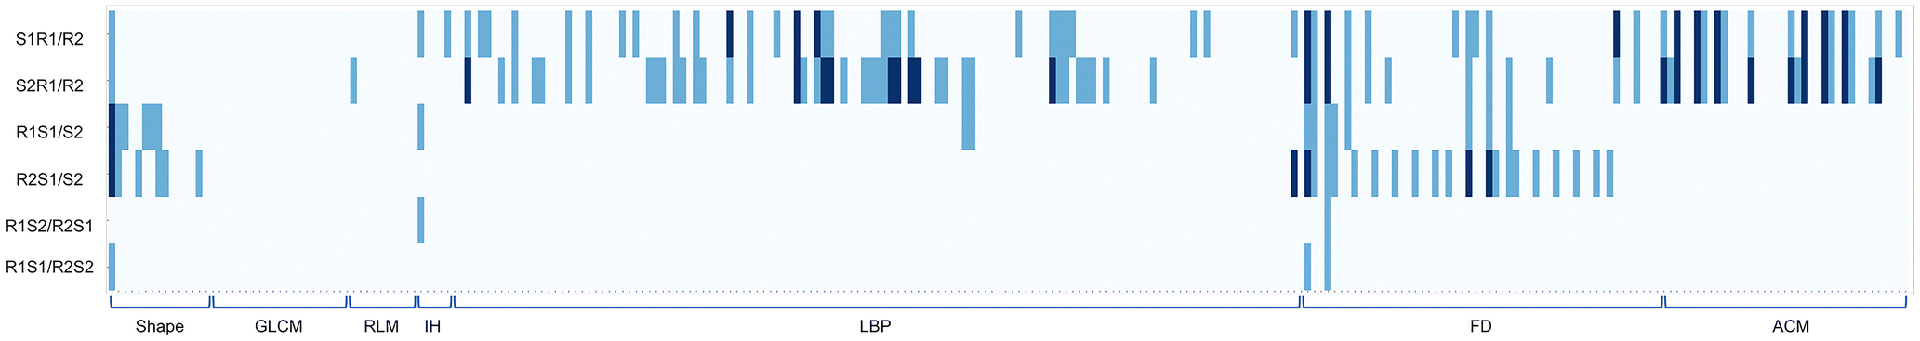
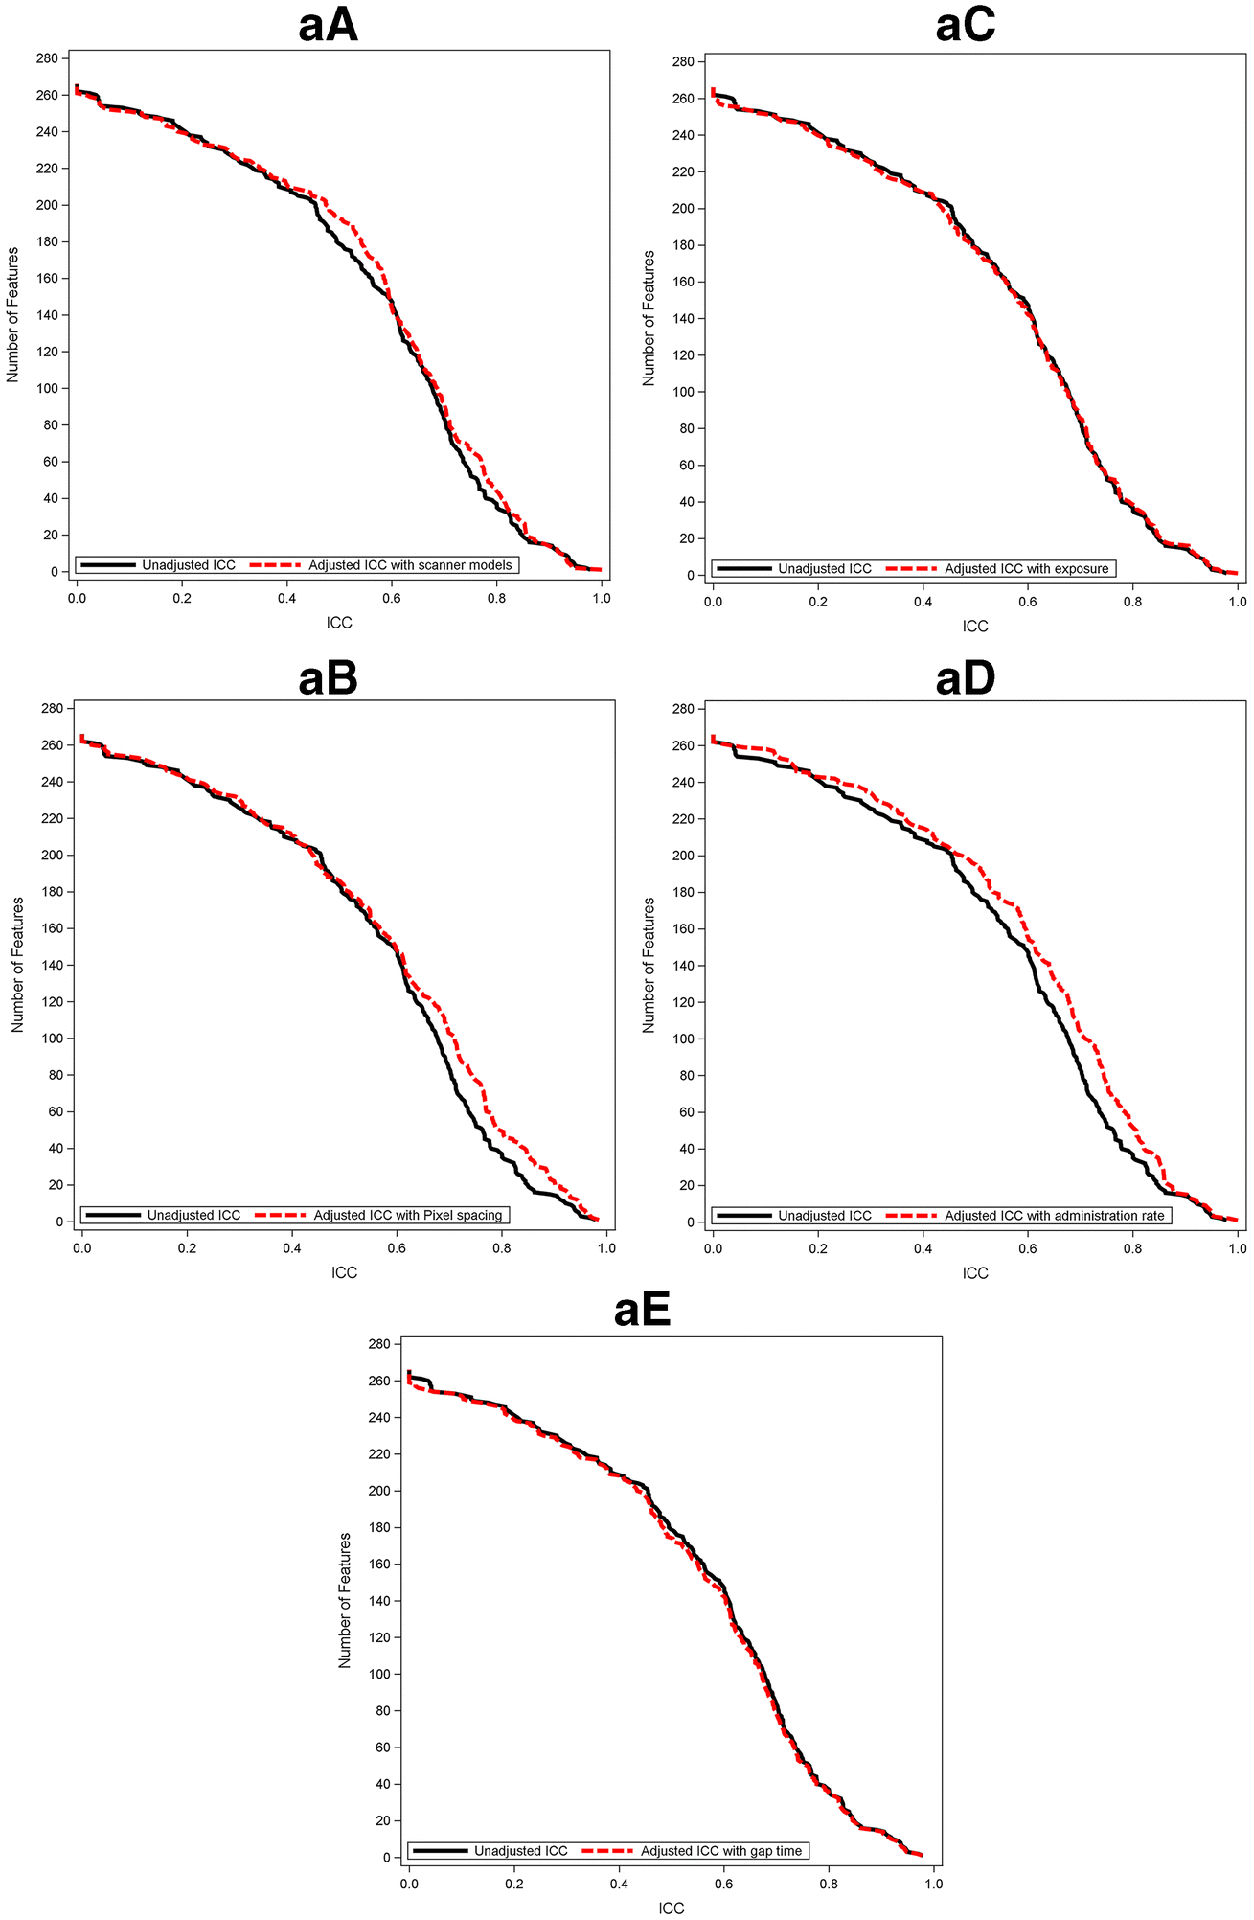
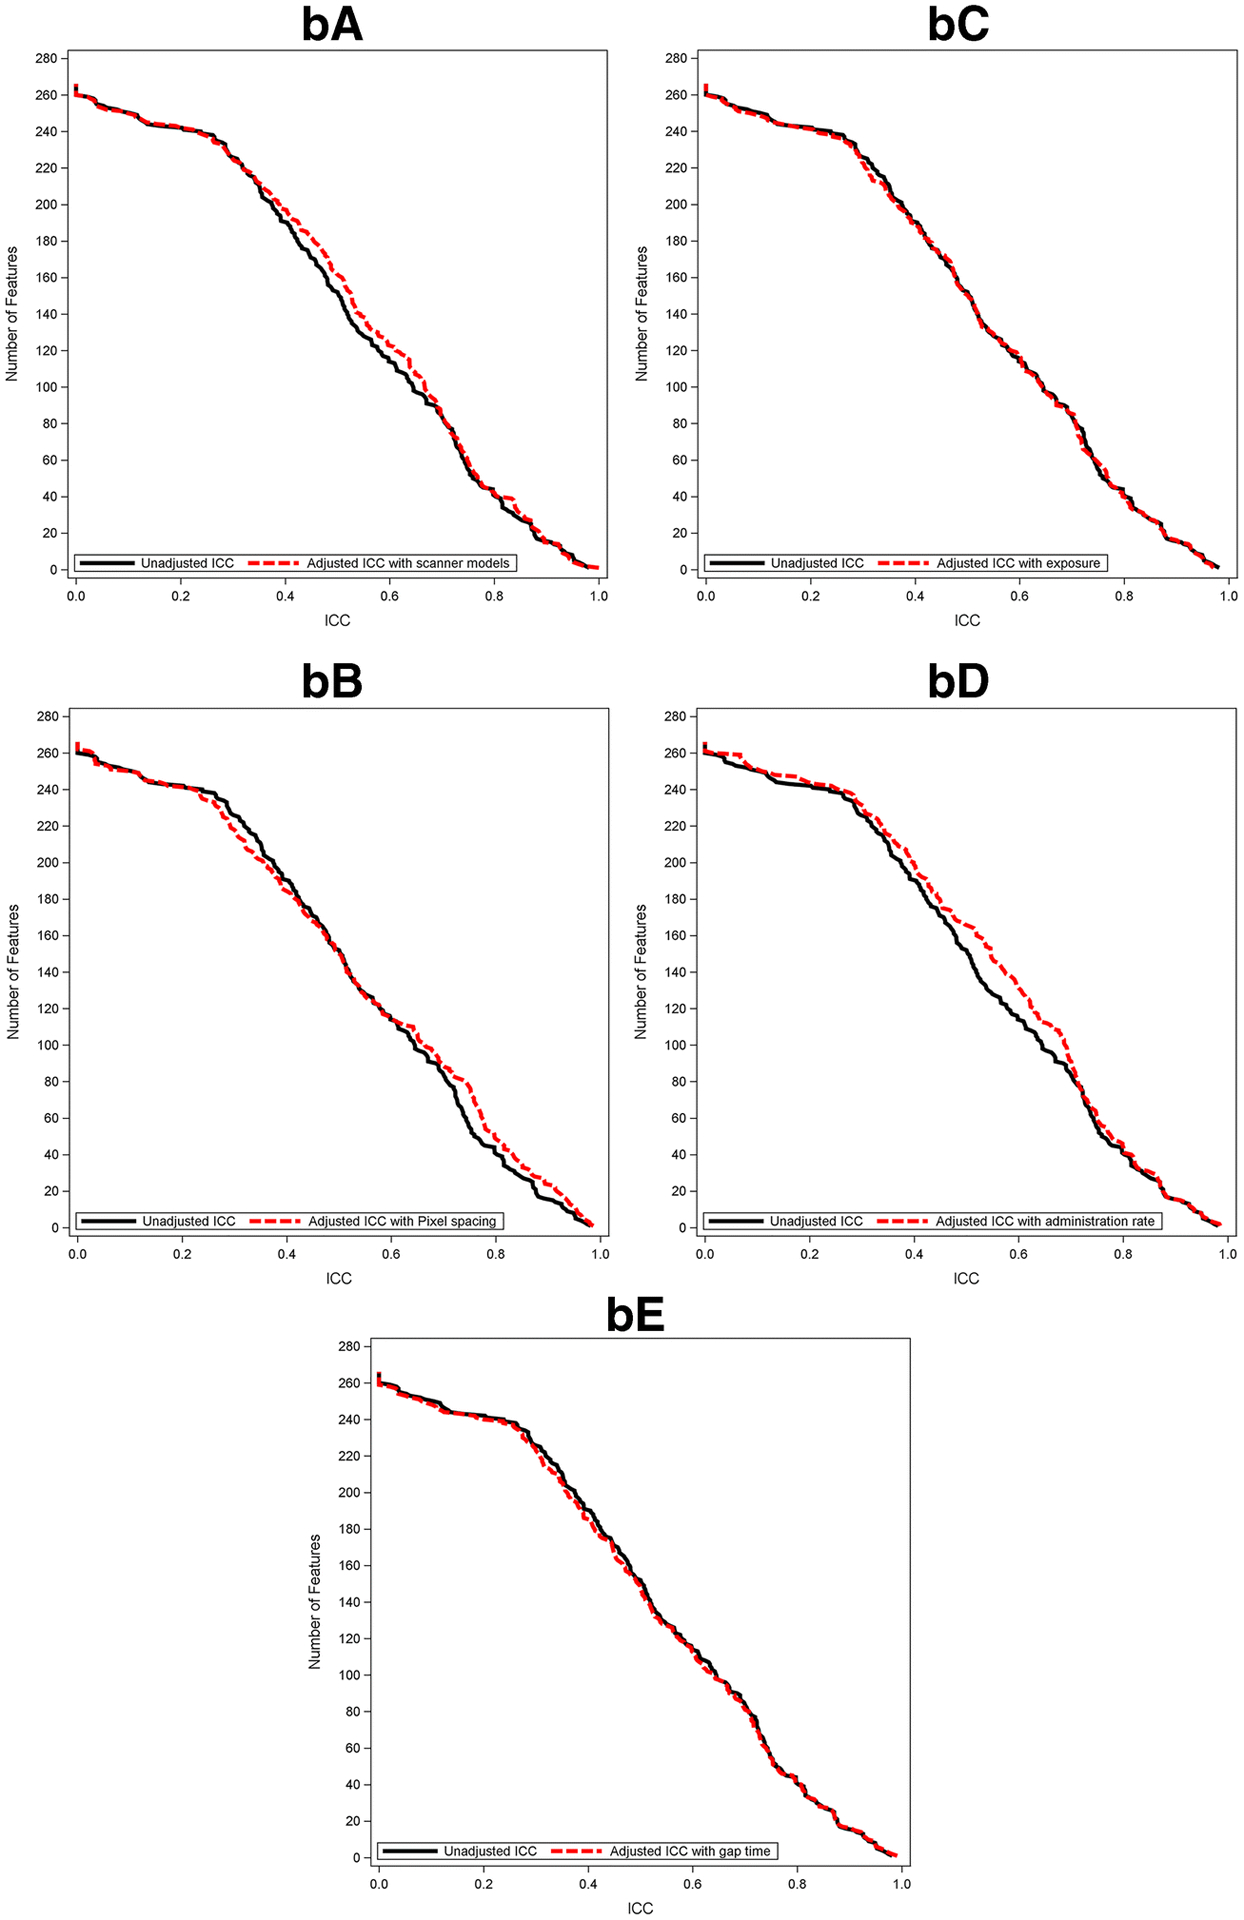
Methods: In this IRB-approved and HIPAA-compliant retrospective study, 37 pairs of scans from 37 unique patients who underwent CECTs within a 2-week interval were included in the analysis of the reproducibility of features derived from pancreatic parenchyma, and a subset of 18 pairs of scans were further analyzed for the reproducibility of features derived from PDAC. In each patient, pancreatic parenchyma and pancreatic tumor (when present) were manually segmented by two radiologists independently. A total of 266 radiomic features were extracted from the pancreatic parenchyma and tumor region and also the volume and diameter of the tumor. The concordance correlation coefficient (CCC) was calculated to assess feature reproducibility for each patient in three scenarios: (1) different radiologists, same CECT; (2) same radiologist, different CECTs; and (3) different radiologists, different CECTs.

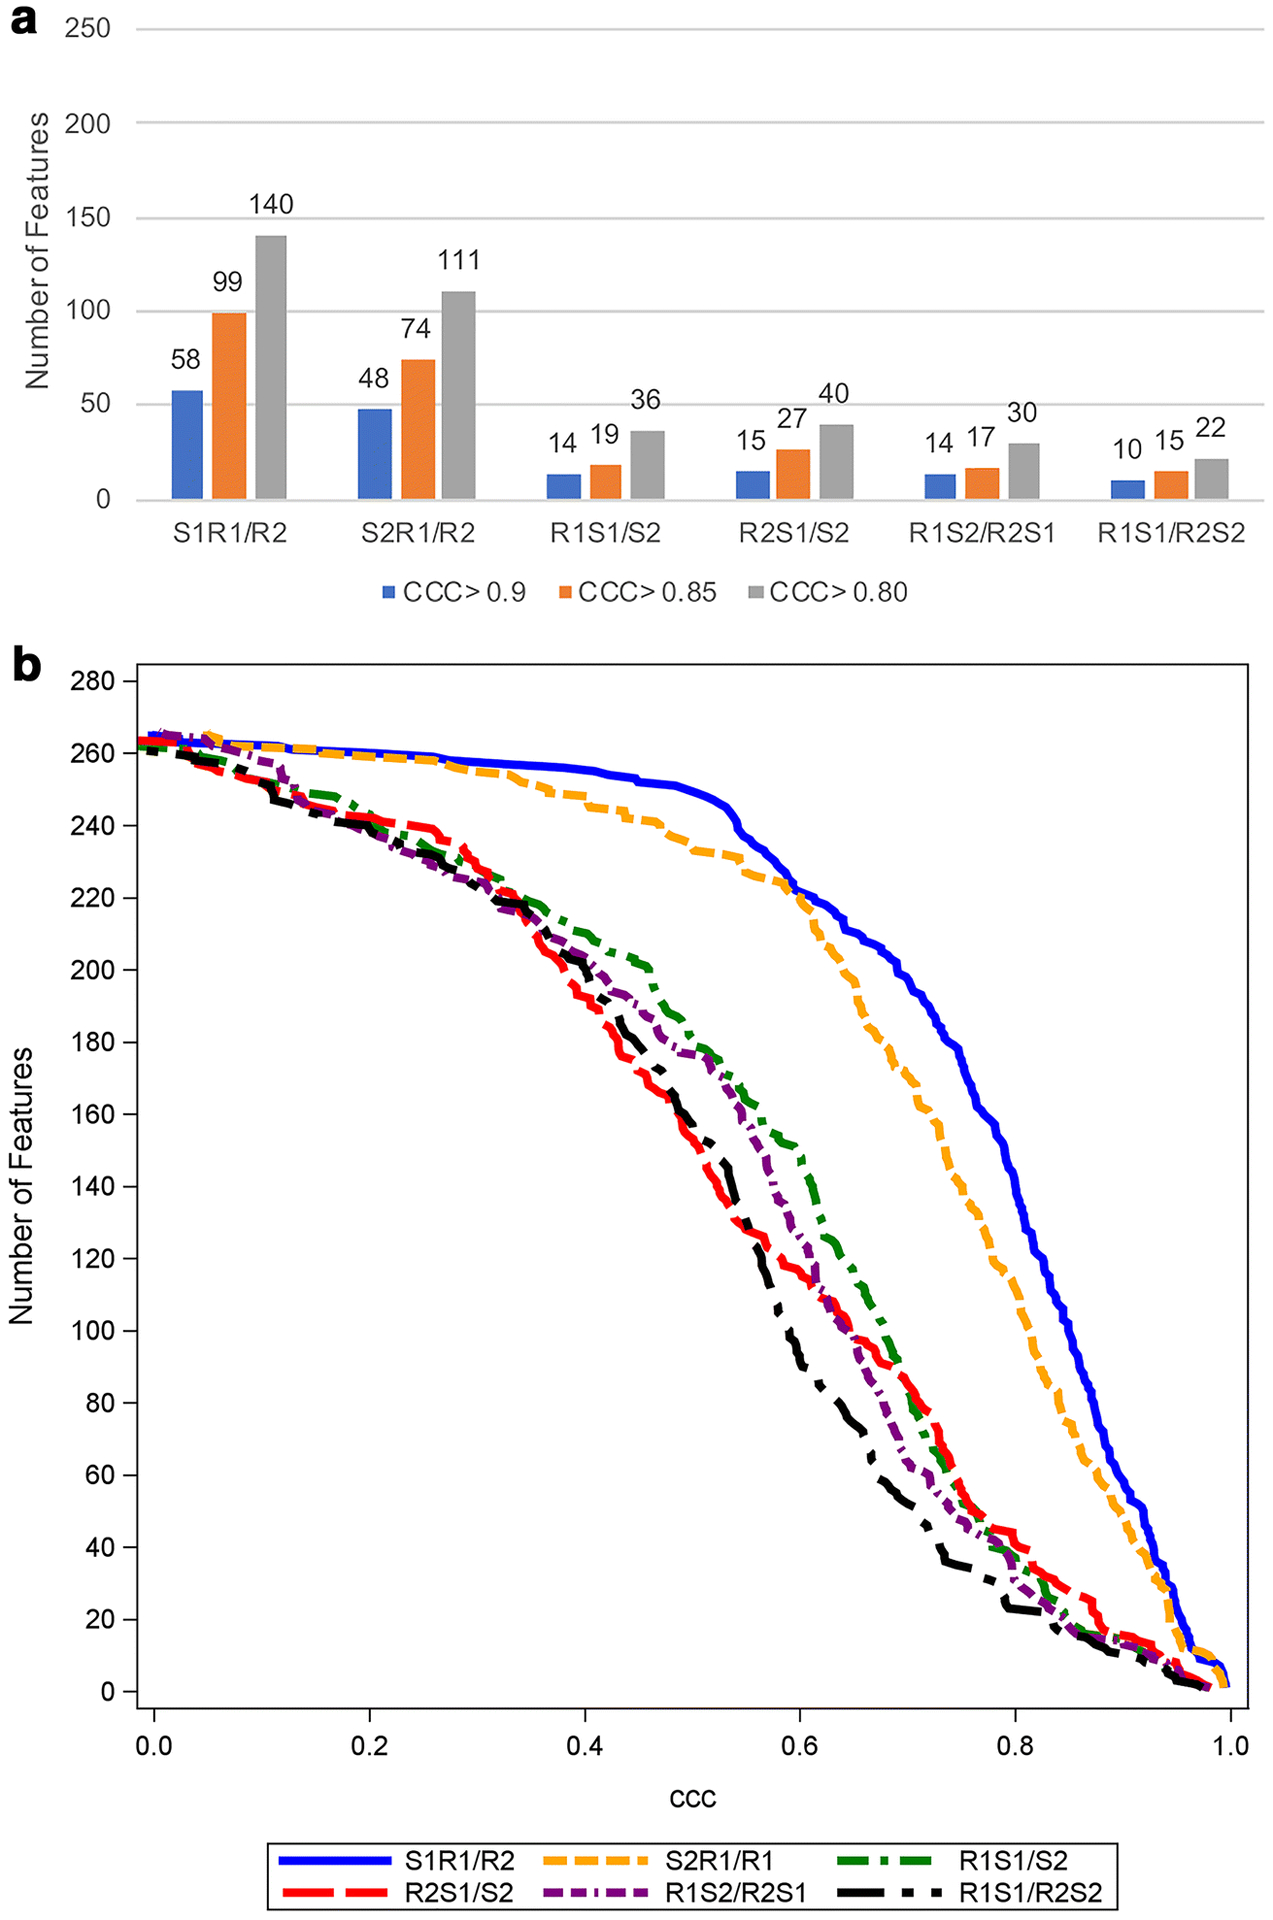
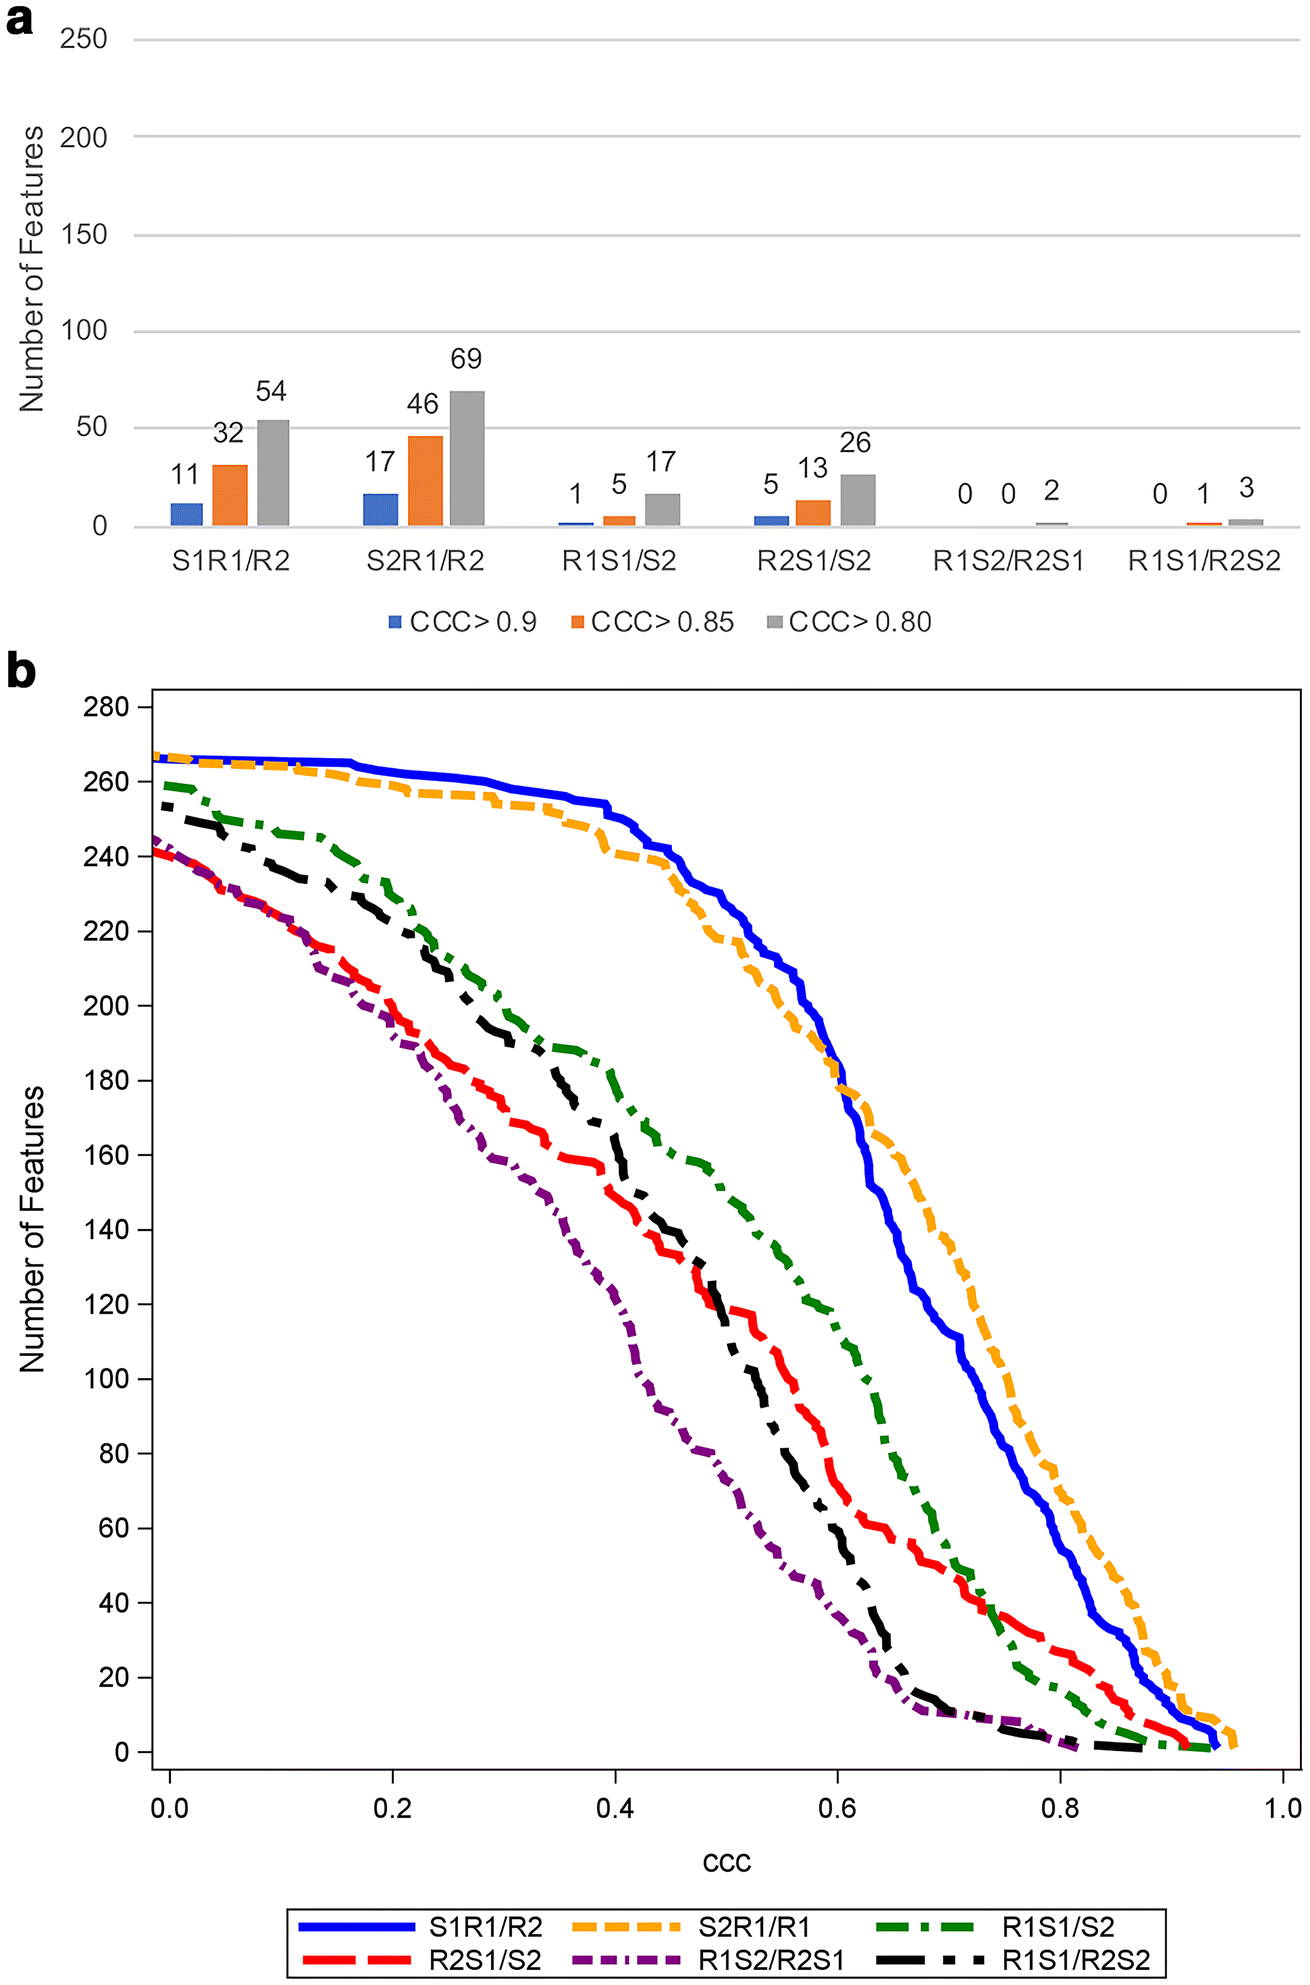
Results: Among pancreatic parenchyma-derived features, using a threshold of CCC > 0.90, 58/266 (21.8%) and 48/266 (18.1%) features met the threshold for scenario 1, 14/266 (5.3%) and 15/266 (5.6%) for scenario 2, and 14/266 (5.3%) and 10/266 (3.8%) for scenario 3. Among pancreatic tumor-derived features, 11/268 (4.1%) and 17/268 (6.3%) features met the threshold for scenario 1, 1/268 (0.4%) and 5/268 (1.9%) features met the threshold for scenario 2, and no features for scenario 3 met the threshold, respectively.

Conclusions: Variations between CECT scans affected radiomic feature reproducibility to a greater extent than variation in segmentation. A smaller number of pancreatic tumor-derived radiomic features were reproducible compared with pancreatic parenchyma-derived radiomic features under the same conditions.

Key points: • For pancreatic-derived radiomic features from contrast-enhanced CT (CECT), fewer than 25% are reproducible (with a threshold of CCC < 0.9) in a clinical heterogeneous dataset. • Variations between CECT scans affected the number of reproducible radiomic features to a greater extent than variations in radiologist segmentation. • A smaller number of pancreatic tumor-derived radiomic features were reproducible compared with pancreatic parenchyma-derived radiomic features under the same conditions.

Keywords: Pancreatic ductal carcinoma; Radiomics; Reproducibility of results; Texture analysis; X-ray computed tomography.


Conflict of interest statement

Conflict of Interest:

The authors of this manuscript declare no relationships with any companies, whose products or services may be related to the subject matter of the article.

Figures

Figure 1
Figure 1
Study flowchart. Note that n is the number of pairs of scans. Abbreviations: PDAC; pancreatic ductal adenocarcinoma
Figure 2
Figure 2
The number of pancreatic parenchyma-derived features with CCC > 0.9, 0.85, and 0.8 (a) and cumulative distribution function plot of the CCC (b) in six sets of analyses for pancreatic parenchyma (n=37). The total number of features examined is 266. Abbreviations: CCC; concordance correlation coefficient, S1R1/R2; reader 1 on scan 1 vs reader 2 on scan 1, S2R1/R2; reader 1 on scan 2 vs reader 2 on scan 2, R1S1/S2; reader 1 on scan 1 vs reader 1 on scan 2, R2S1/S2; reader 2 on scan 1 vs reader 2 on scan 2, R1S2/R2S1; reader 1 on scan 2 vs reader 2 on scan 1, R1S1/R2S2; reader 1 on scan 1 vs reader 2 on scan 2
Figure 3
Figure 3
The number of pancreatic tumor-derived features with CCC > 0.9, 0.85, and 0.8 (a) and cumulative distribution function plot of the CCC (b) in six sets of analyses for pancreatic tumor (n=18). The total number of features examined is 268. Abbreviations: CCC; concordance correlation coefficient, S1R1/R2; reader 1 on scan 1 vs reader 2 on scan 1, S2R1/R2; reader 1 on scan 2 vs reader 2 on scan 2, R1S1/S2; reader 1 on scan 1 vs reader 1 on scan 2, R2S1/S2; reader 2 on scan 1 vs reader 2 on scan 2, R1S2/R2S1; reader 1 on scan 2 vs reader 2 on scan 1, R1S1/R2S2; reader 1 on scan 1 vs reader 2 on scan 2
Figure 4
Figure 4
Heatmap demonstrating pancreatic parenchyma-derived reproducible features with thresholds of CCC > 0.8 and CCC > 0.9, where each row and column represents each comparison dataset and radiomic feature, respectively. Pale blue indicates CCC ≤ 0.8, light blue indicates 0.8 < CCC ≤ 0.9, and dark blue indicates 0.9 < CCC. Abbreviations: CCC; concordance correlation coefficient, GLCM; gray-level co-occurrence matrix, RLM; run length matrix, IH; intensity histogram, LBP; local binary pattern, FD; fractal dimension, ACM; angle co-occurrence matrix, S1R1/R2; reader 1 on scan 1 vs reader 2 on scan 1, S2R1/R2; reader 1 on scan 2 vs reader 2 on scan 2, R1S1/S2; reader 1 on scan 1 vs reader 1 on scan 2, R2S1/S2; reader 2 on scan 1 vs reader 2 on scan 2, R1S2/R2S1; reader 1 on scan 2 vs reader 2 on scan 1, R1S1/R2S2; reader 1 on scan 1 vs reader 2 on scan 2
Figure 5
Figure 5
Heatmap demonstrating pancreatic tumor-derived reproducible features with thresholds of CCC > 0.8 and CCC > 0.9, where each row and column represents each comparison dataset and radiomic feature, respectively. Pale blue indicates CCC ≤ 0.8, light blue indicates 0.8 < CCC ≤ 0.9, and dark blue indicates 0.9 < CCC. Abbreviations: CCC; concordance correlation coefficient, GLCM; gray-level co-occurrence matrix, RLM; run length matrix, IH; intensity histogram, LBP; local binary pattern, FD; fractal dimension, ACM; angle co-occurrence matrix, S1R1/R2; reader 1 on scan 1 vs reader 2 on scan 1, S2R1/R2; reader 1 on scan 2 vs reader 2 on scan 2, R1S1/S2; reader 1 on scan 1 vs reader 1 on scan 2, R2S1/S2; reader 2 on scan 1 vs reader 2 on scan 2, R1S2/R2S1; reader 1 on scan 2 vs reader 2 on scan 1, R1S1/R2S2; reader 1 on scan 1 vs reader 2 on scan 2
Figure 6
Figure 6
Cumulative distribution function plots of adjusted ICC value of pancreatic parenchyma-derived (a) and tumor-derived (b) features with scanner model (A), pixel spacing (B), exposure (C), administration rate (D), and gap time (E) along with that of unadjusted ICC. Abbreviations: ICC; intraclass correlation coefficient
Figure 6
Figure 6
Cumulative distribution function plots of adjusted ICC value of pancreatic parenchyma-derived (a) and tumor-derived (b) features with scanner model (A), pixel spacing (B), exposure (C), administration rate (D), and gap time (E) along with that of unadjusted ICC. Abbreviations: ICC; intraclass correlation coefficient

References

    1. Siegel RL, Miller KD, Jemal A (2018) Cancer statistics, 2018. CA Cancer J Clin 68:7–30. doi: 10.3322/caac.21442 - DOI - PubMed
    1. Garrido-Laguna I, Hidalgo M (2015) Pancreatic cancer: from state-of-the-art treatments to promising novel therapies. Nat Rev Clin Oncol 12:319–334. doi: 10.1038/nrclinonc.2015.53 - DOI - PubMed
    1. Gillies RJ, Kinahan PE, Hricak H (2016) Radiomics: Images Are More than Pictures, They Are Data. Radiology 278:563–577. doi: 10.1148/radiol.2015151169 - DOI - PMC - PubMed
    1. Lambin P, Rios-Velazquez E, Leijenaar R, et al. (2012) Radiomics: extracting more information from medical images using advanced feature analysis. Eur J Cancer 48:441–446. doi: 10.1016/j.ejca.2011.11.036 - DOI - PMC - PubMed
    1. Aerts HJWL Velazquez ER, Leijenaar RTH, et al. (2014) Decoding tumour phenotype by noninvasive imaging using a quantitative radiomics approach. Nat Commun 5:4006. doi: 10.1038/ncomms5006 - DOI - PMC - PubMed