

Potential clinical impact of multiparametric quantitative MR spectroscopy in neurological disorders: A review and analysis
- PMID: 31393032
- PMCID: PMC6814297
- DOI: 10.1002/mrm.27912
Potential clinical impact of multiparametric quantitative MR spectroscopy in neurological disorders: A review and analysis
Abstract
Purpose: Unlike conventional MR spectroscopy (MRS), which only measures metabolite concentrations, multiparametric MRS also quantifies their longitudinal (T1 ) and transverse (T2 ) relaxation times, as well as the radiofrequency transmitter inhomogeneity (B1+ ). To test whether knowledge of these additional parameters can improve the clinical utility of brain MRS, we compare the conventional and multiparametric approaches in terms of expected classification accuracy in differentiating controls from patients with neurological disorders.
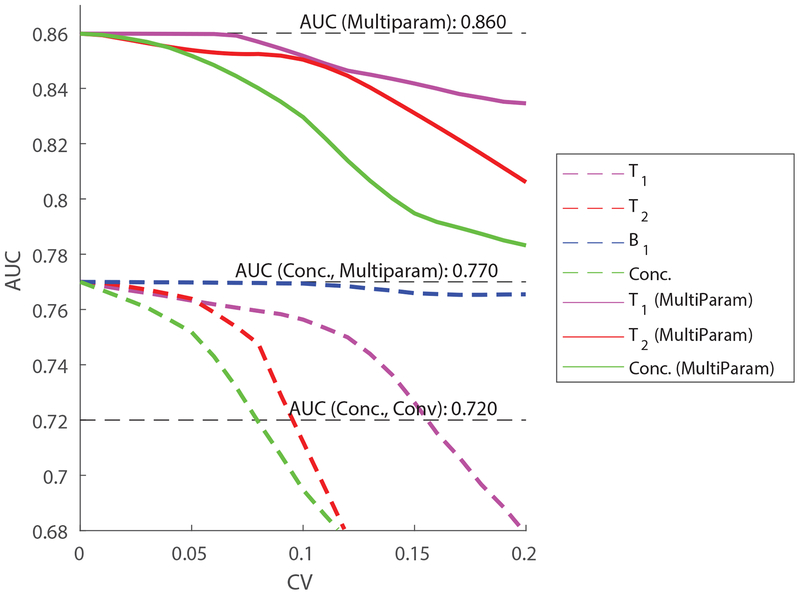
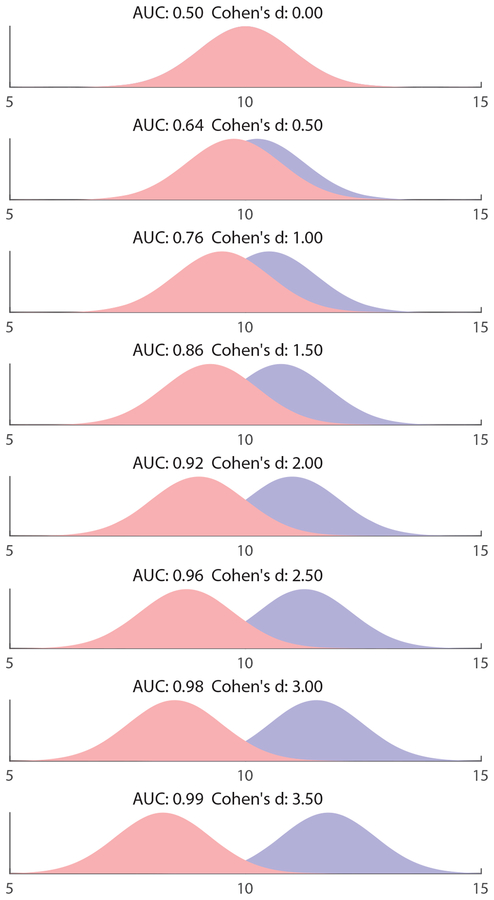
Theory and methods: A literature review was conducted to compile metabolic concentrations and relaxation times in a wide range of neuropathologies and regions of interest. Simulations were performed to construct receiver operating characteristic curves and compute the associated areas (area under the curve) to examine the sensitivity and specificity of MRS for detecting each pathology in each region. Classification accuracy was assessed using metabolite concentrations corrected using population-averages for T1 , T2 , and B1+ (conventional MRS); using metabolite concentrations corrected using per-subject values (multiparametric MRS); and using an optimal linear multiparametric estimator comprised of the metabolites' concentrations and relaxation constants (multiparametric MRS). Additional simulations were conducted to find the minimal intra-subject precision needed for each parameter.
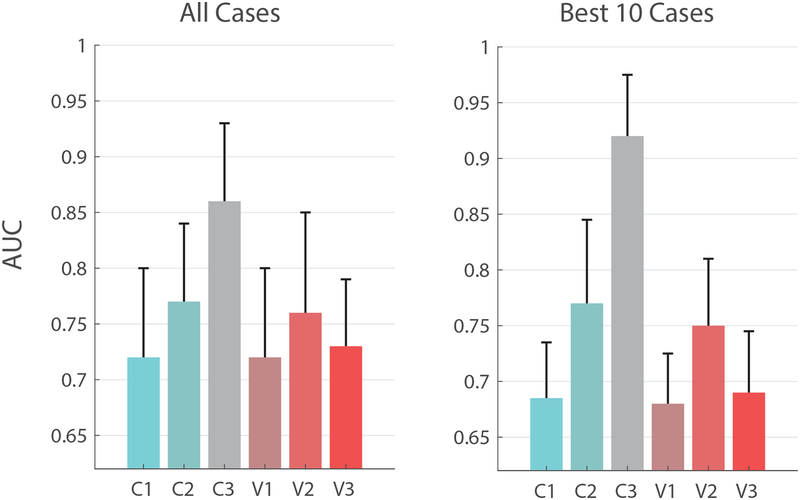
Results: Compared with conventional MRS, multiparametric approaches yielded area under the curve improvements for almost all neuropathologies and regions of interest. The median area under the curve increased by 0.14 over the entire dataset, and by 0.24 over the 10 instances with the largest individual increases.
Conclusions: Multiparametric MRS can substantially improve the clinical utility of MRS in diagnosing and assessing brain pathology, motivating the design and use of novel multiparametric sequences.
Keywords: MRS; multiparametric MRI; qMRI; quantitative MRI; relaxation times; single-voxel spectroscopy.
© 2019 International Society for Magnetic Resonance in Medicine.
Figures
References
-
- Warntjes JB, Dahlqvist O, Lundberg P. Novel method for rapid, simultaneous T1, T2*, and proton density quantification. Magnetic resonance in medicine 2007;57(3):528–537. - PubMed
-
- Voigt T, Nehrke K, Doessel O, Katscher U. T1 corrected B1 mapping using multi-TR gradient echo sequences. Magnetic resonance in medicine 2010;64(3):725–733. - PubMed
Publication types
MeSH terms
Substances
Grants and funding
LinkOut - more resources
Full Text Sources
