. 2019 Oct;13(10):2160-2177.
doi: 10.1002/1878-0261.12558. Epub 2019 Aug 28.

Disruption of the RICTOR/mTORC2 complex enhances the response of head and neck squamous cell carcinoma cells to PI3K inhibition

Affiliations

Disruption of the RICTOR/mTORC2 complex enhances the response of head and neck squamous cell carcinoma cells to PI3K inhibition

Kara M Ruicci et al. Mol Oncol. 2019 Oct.

Erratum in

Abstract

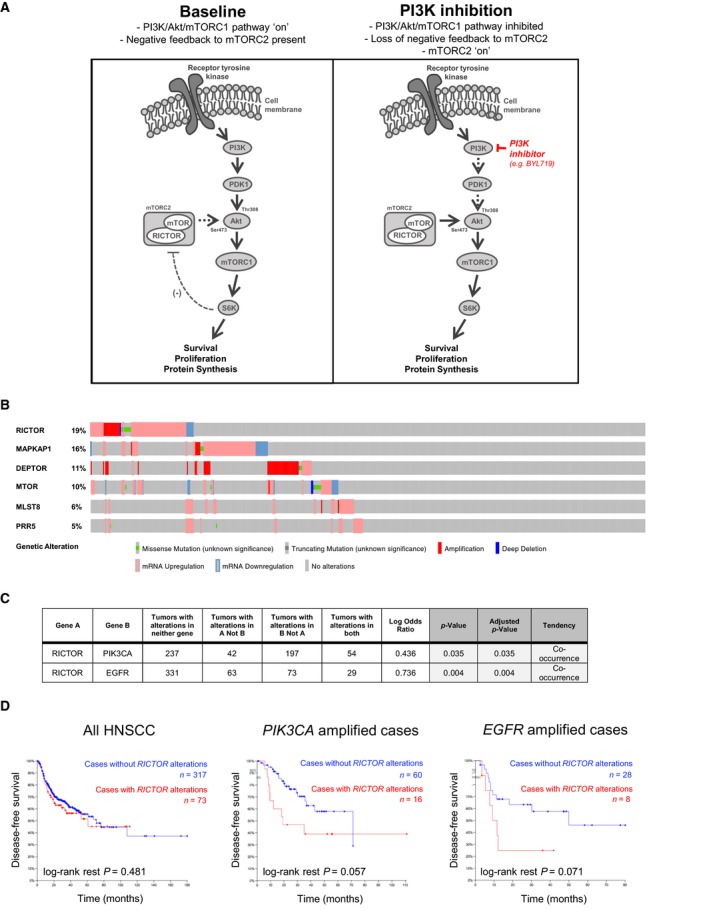
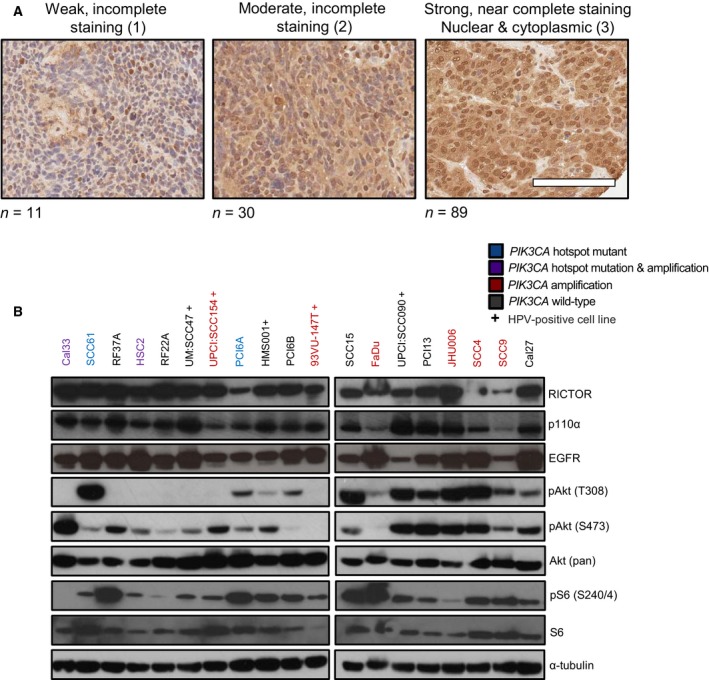
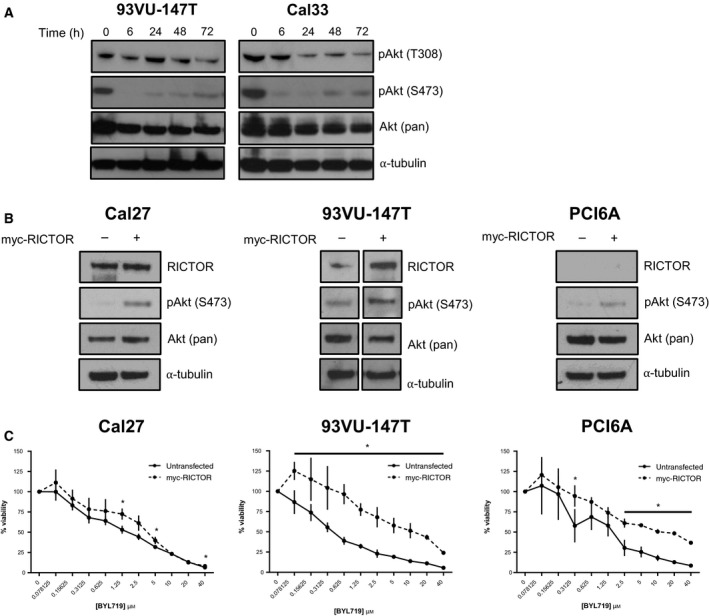
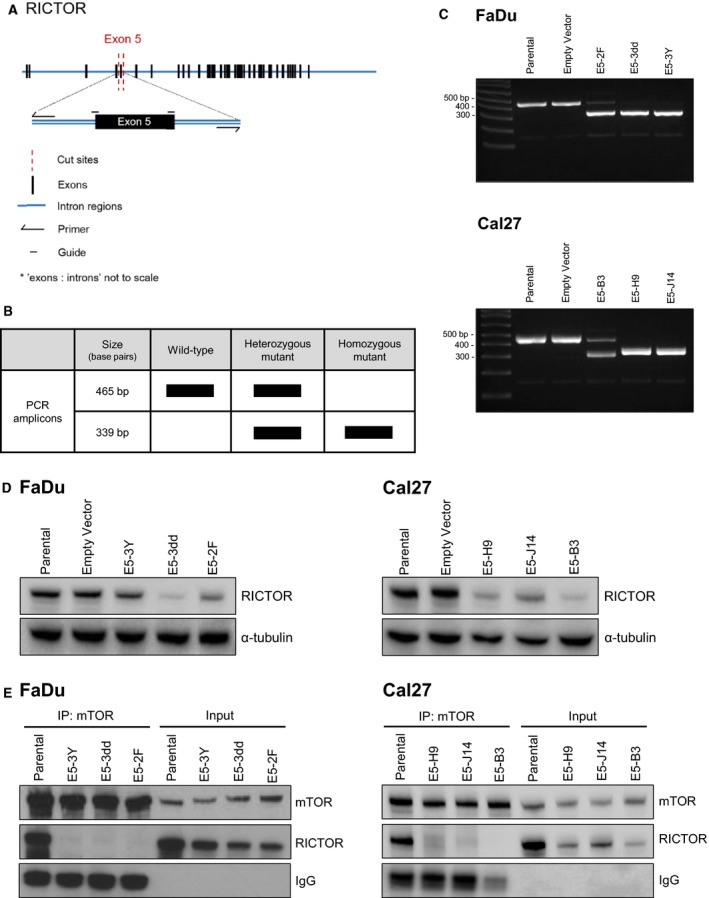
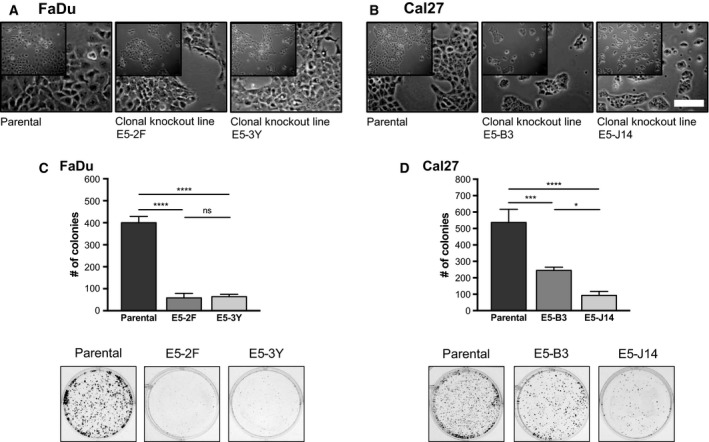
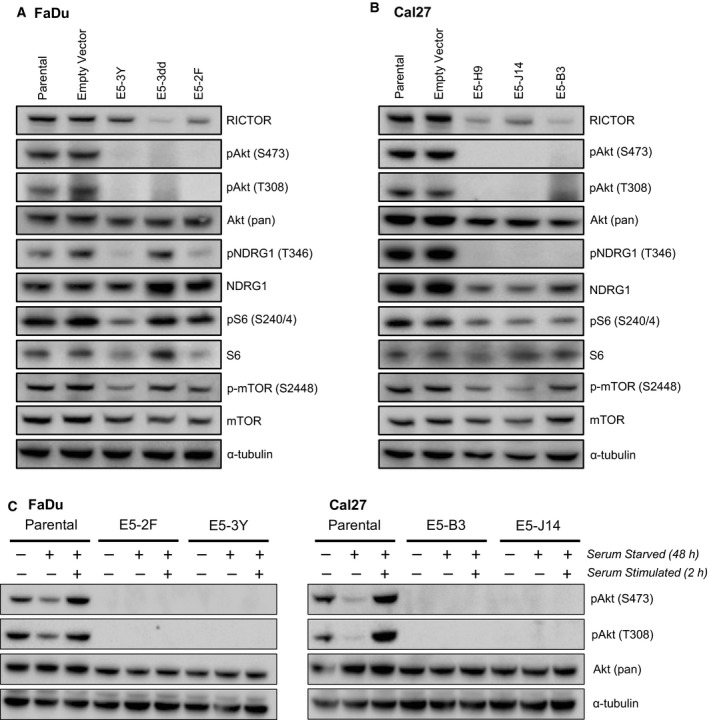
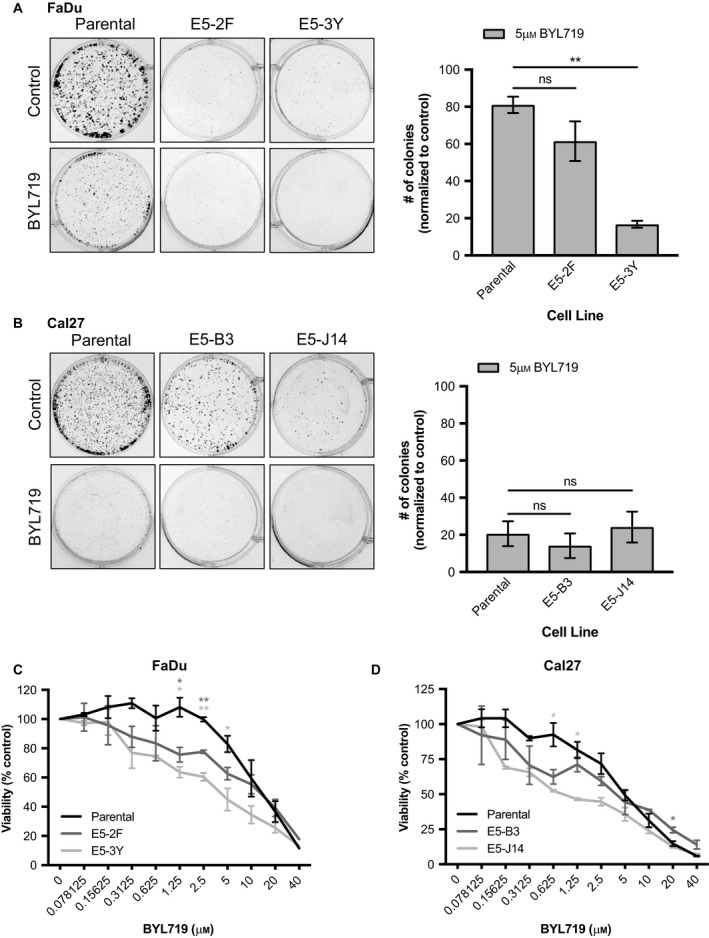
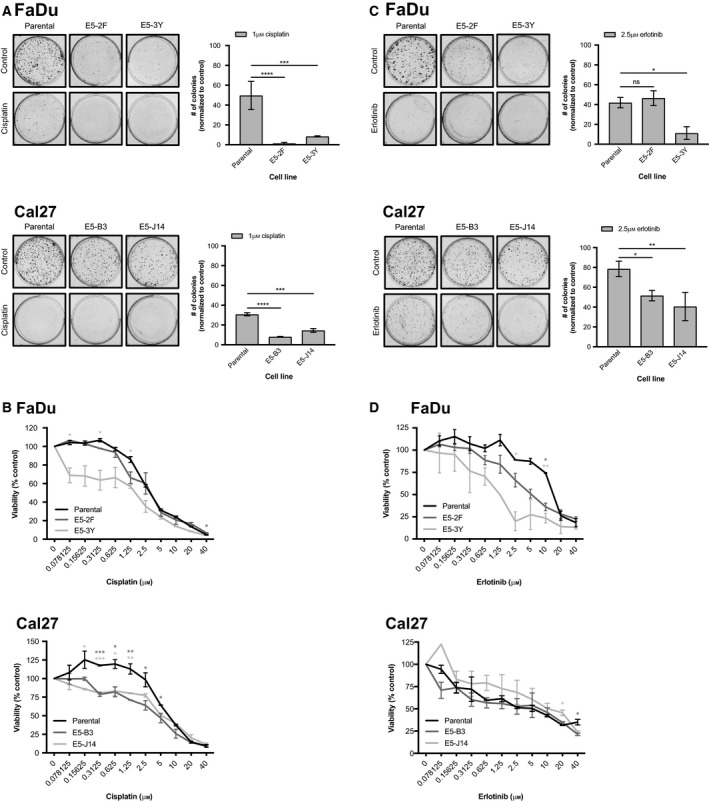
Phosphoinositide 3-kinase (PI3K) is aberrantly activated in head and neck squamous cell carcinomas (HNSCC) and plays a pivotal role in tumorigenesis by driving Akt signaling, leading to cell survival and proliferation. Phosphorylation of Akt Thr308 by PI3K-PDK1 and Akt Ser473 by mammalian target of rapamycin complex 2 (mTORC2) activates Akt. Targeted inhibition of PI3K is a major area of preclinical and clinical investigation as it reduces Akt Thr308 phosphorylation, suppressing downstream mTORC1 activity. However, inhibition of mTORC1 releases feedback inhibition of mTORC2, resulting in a resurgence of Akt activation mediated by mTORC2. While the role of PI3K-activated Akt signaling is well established in HNSCC, the significance of mTORC2-driven Akt signaling has not been thoroughly examined. Here we explore the expression and function of mTORC2 and its obligate subunit RICTOR in HNSCC primary tumors and cell lines. We find RICTOR to be overexpressed in a subset of HNSCC tumors, including those with PIK3CA or EGFR gene amplifications. Whereas overexpression of RICTOR reduced susceptibility of HNSCC tumor cells to PI3K inhibition, genetic ablation of RICTOR using CRISPR/Cas9 sensitized cells to PI3K inhibition, as well as to EGFR inhibition and cisplatin treatment. Further, mTORC2 disruption led to reduced viability and colony forming abilities of HNSCC cells relative to their parental lines and induced loss of both activating Akt phosphorylation modifications (Thr308 and Ser473). Taken together, our findings establish RICTOR/mTORC2 as a critical oncogenic complex in HNSCC and rationalize the development of an mTORC2-specific inhibitor for use in HNSCC, either combined with agents already under investigation, or as an independent therapy.

Keywords: PI3-kinase; RICTOR; head and neck cancer; mTORC2; targeted therapy.


Conflict of interest statement

The authors declare no conflict of interest.

Figures

Figure 1
Figure 1
RICTOR/mTORC2 in HNSCC primary tumors. (A) Schematic representation of PI3K/Akt/mTOR signaling cascade with emphasis on negative feedback inhibition of RICTOR/mTORC2 by S6K. (B) Oncoprint showing prevalence of single nucleotide variations (SNV), copy number aberrations, and transcript expression of mTOR complex 2 subunits in TCGA‐curated HNSCC tumors, generated using cbioportal software (https://www.cbioportal.org/). (C) Evaluation of mutual exclusivity or co‐occurrence of genomic aberrations in RICTOR and PIK3CA, as well as in RICTOR and EGFR (generated based on TCGA‐curated HNSCC tumors using cbioportal). (D) Kaplan–Meier survival analyses of TCGA‐curated HNSCC cases. Cases were stratified according to the presence or absence of RICTOR gene amplification, SNV and mRNA overexpression (> 2 standard deviations above average expression) in HNSCC as whole, or in subsets of HNSCC cases with either PIK3CA or EGFR amplifications. Cases with RICTOR alterations are represented in red.
Figure 2
Figure 2
RICTOR/mTORC2 and PI3K pathway activation in established HNSCC cell lines and primary tumors. (A) Representative images of RICTOR IHC in human HNSCCs arranged by score. Scale bar represents 100 µm. (B) Immunoblot of RICTOR, EGFR, p110α, and Akt with lysates from indicated HNSCC cell lines. ‘+’ denotes HPV‐positive cell lines.
Figure 3
Figure 3
Feedback relief following PI3K inhibition leads to Akt Ser473 accumulation. (A) Immunoblot showing time‐dependent re‐accumulation of phosphorylated Akt (Ser473) following PI3K inhibition by BYL719 (5 µm). (B) Immunoblot with indicated antibodies following transfection of HNSCC cells with myc‐tagged RICTOR. (C) Proliferation after 72 h of HNSCC cell lines at baseline compared to following transfection of myc‐tagged RICTOR upon increasing doses of BYL719 (0–40 µm). *P < 0.05.
Figure 4
Figure 4
Deletion of RICTOR exon 5 disrupts the interaction between RICTOR and mTOR. (A) Schematic illustrating design of single‐guide RNA and primers for CRISPR/Cas9‐mediated deletion of exon 5 of RICTOR. (B) Predicted genotypes and base pair sizes for genomic PCR amplicons of RICTOR following CRISPR/Cas9 targeting of RICTOR. (C) Agarose gel images showing RICTOR amplicons in cell populations (FaDu, Cal27 cells) transfected with guides targeting RICTOR or an empty vector (PX458‐CMV). (D) Immunoblot of RICTOR expression in parental and mutant cell lines (E5‐XX lines). (E) Immunoblot showing co‐IP of RICTOR and mTOR in FaDu and Cal27 cells, but no detectable interaction in any of the putative RICTOR knockout cell lines. [Correction added on 06 January 2020, after first online publication: Fig. 4 has been amended. In the original publication of this article, the RICTOR immunoblot in Fig. 4D was accidently removed.]
Figure 5
Figure 5
Deletion of RICTOR exon 5 alters cell growth and colony forming ability. Phase contrast images of parental and RICTOR knockout FaDu (A) and Cal27 (B) cell lines. Scale bar represents 130 µm. (C, D) Colony formation assays of parental and RICTOR knockout cell lines following 10 days of growth. Number of colonies was quantified using fiji software. Error bars represent SD, n = 3. *P < 0.05, ***P < 0.001, ****P < 0.0001, ns, not significant, one‐way ANOVA.
Figure 6
Figure 6
Activating phosphorylation of Akt is lost in RICTOR knockout cell lines. (A, B) Immunoblots of indicated lysates showing activation status of mTORC2 readouts Akt (Ser473) and NDRG1 (Thr346), as well as expression of other relevant pathway members. (C) Immunoblots of indicated lysates showing phosphorylation of Akt (Thr308 and Ser473) following serum starvation for 48 h and serum stimulation for 2 h.
Figure 7
Figure 7
RICTOR/mTORC2 loss improves response of HNSCC cells to PI3K inhibition. (A, B) Colony formation assays of parental and RICTOR knockout cell lines with/without 5 µm BYL719 for 10 days. Number of colonies was quantified using fiji software. Error bars represent SD. n = 3. (C, D) Proliferation after 72 h of parental versus RICTOR/mTORC2 knockout HNSCC cells upon increasing doses of BYL719 (0–40 µm). Error bars represent SEM. *P < 0.05, **P < 0.01, ns, not significant, one‐way ANOVA.
Figure 8
Figure 8
RICTOR/mTORC2 loss sensitizes HNSCC cells to erlotinib and cisplatin treatment. (A) Colony formation assays of parental and RICTOR knockout cell lines with/without 1 µm cisplatin for 10 days. Number of colonies was quantified using fiji software. Error bars represent SD. n = 3. (B) Proliferation after 72 h of parental versus RICTOR/mTORC2 knockout HNSCC cells upon increasing doses of cisplatin (0–40 µm). Error bars represent SEM. (C) Colony formation assays of parental and RICTOR knockout cell lines with/without 2.5 µm erlotinib for 10 days. Number of colonies was quantified using fiji software. Error bars represent SD. n = 3. (D) Proliferation after 72 h of parental versus RICTOR/mTORC2 knockout HNSCC cells upon increasing doses of erlotinib (0–40 µm). Error bars represent SEM. *P < 0.05, **P < 0.01, ***P < 0.001, ****P < 0.0001, ns, not significant, one‐way ANOVA.

References

    1. Agrawal N, Frederick MJ, Pickering CR, Bettegowda C, Chang K, Li RJ, Fakhry C, Xie TX, Zhang J, Wang J et al (2011) Exome sequencing of head and neck squamous cell carcinoma reveals inactivating mutations in NOTCH1. Science 333, 1154–1157. - PMC - PubMed
    1. Benavides‐Serrato A, Lee J, Holmes B, Landon KA, Bashir T, Jung ME, Lichtenstein A and Gera J (2017) Specific blockade of Rictor‐mTOR association inhibits mTORC2 activity and is cytotoxic in glioblastoma. PLoS ONE 12, e0176599–20. - PMC - PubMed
    1. Castel P, Ellis H, Bago R, Toska E, Razavi P, Carmona FJ, Kannan S, Verma CS, Dickler M, Chandarlapaty S et al (2016) PDK1‐SGK1 signaling sustains AKT‐independent mTORC1 activation and confers resistance to PI3Kα inhibition. Cancer Cell 30, 229–242. - PMC - PubMed
    1. Chen X, Liu M, Tian Y, Li J, Qi Y, Zhao D, Wu Z, Huang M, Wong CCL, Wang H‐W et al (2018) Cryo‐EM structure of human mTOR complex 2. Cell Res 28, 518–528. - PMC - PubMed
    1. Cheng H, Zou Y, Ross JS, Wang K, Liu X, Halmos B, Ali SM, Liu H, Verma A, Montagna C et al (2015) RICTOR amplification defines a novel subset of patients with lung cancer who may benefit from treatment with mTORC1/2 inhibitors. Cancer Discov 5, 1262–1270. - PMC - PubMed

Publication types

MeSH terms

Substances