. 2019 Oct 1;317(4):G408-G428.
doi: 10.1152/ajpgi.00061.2019. Epub 2019 Aug 8.

Exogenous PP2A inhibitor exacerbates the progression of nonalcoholic fatty liver disease via NOX2-dependent activation of miR21

Affiliations

Exogenous PP2A inhibitor exacerbates the progression of nonalcoholic fatty liver disease via NOX2-dependent activation of miR21

Muayad Albadrani et al. Am J Physiol Gastrointest Liver Physiol. .

Abstract

Nonalcoholic fatty liver disease (NAFLD) is an emerging global pandemic. Though significant progress has been made in unraveling the pathophysiology of the disease, the role of protein phosphatase 2A (PP2A) and its subsequent inhibition by environmental and genetic factors in NAFLD pathophysiology remains unclear. The present report tests the hypothesis that an exogenous PP2A inhibitor leads to hepatic inflammation and fibrogenesis via an NADPH oxidase 2 (NOX2)-dependent pathway in NAFLD. Results showed that microcystin (MC) administration, a potent PP2A inhibitor found in environmental exposure, led to an exacerbation of NAFLD pathology with increased CD68 immunoreactivity, the release of proinflammatory cytokines, and stellate cell activation, a process that was attenuated in mice that lacked the p47phox gene and miR21 knockout mice. Mechanistically, leptin-primed immortalized Kupffer cells (a mimicked model for an NAFLD condition) treated with apocynin or nitrone spin trap 5,5 dimethyl-1- pyrroline N-oxide (DMPO) had significantly decreased CD68 and decreased miR21 and α-smooth muscle actin levels, suggesting the role of NOX2-dependent reactive oxygen species in miR21-induced Kupffer cell activation and stellate cell pathology. Furthermore, NOX2-dependent peroxynitrite generation was primarily responsible for cellular events observed following MC exposure since incubation with phenylboronic acid attenuated miR21 levels, Kupffer cell activation, and inflammatory cytokine release. Furthermore, blocking of the AKT pathway attenuated PP2A inhibitor-induced NOX2 activation and miR21 upregulation. Taken together, we show that PP2A may have protective roles, and its inhibition exacerbates NAFLD pathology via activating NOX2-dependent peroxynitrite generation, thus increasing miR21-induced pathology.NEW & NOTEWORTHY Protein phosphatase 2A inhibition causes nonalcoholic steatohepatitis (NASH) progression via NADPH oxidase 2. In addition to a novel emchanism of action, we describe a new tool to describe NASH histopathology.

Keywords: NADPH; NAFLD; NOX-2; PP2A inhibitor; leptin; miR21; microcystin; oxidative stress; siRNA.


Conflict of interest statement

Y. Jule is a paid employee of Biocellvia, France, who designed the NASH pathology software. S. Chatterjee is a consultant for Biocellvia and has independently verified the results of software analysis described in this manuscript. None of the other authors have any conflicts of interest, financial or otherwise, to disclose.

Figures

None
Graphical abstract
Fig. 1.
Fig. 1.
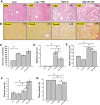
Exogenous protein phosphatase 2A (PP2A) inhibition in mouse liver exacerbates nonalcoholic fatty liver disease (NAFLD) pathology. Qualitative and quantitative image analysis of microcystin (MC) effects on liver steatosis and fibrosis induced in an NAFLD mouse model. A: representative histological images of liver sections stained with hematoxylin-eosin (H&E), from lean mouse control and lean mouse + MC (n = 3), wild-type mouse NAFLD, and NAFLD + MC (n = 3). B: representative histological images of the same groups of mice stained with picrosirius red (PicroS). Images were taken at ×20 magnification. C: quantification of serum alanine aminotransferase (ALT) level and comparison between control (lean and NAFLD) and MC-tested groups. Automatic digital-imaging quantification of steatosis area (%) (D), mean vesicle size (µm2) (E), fibrosis area (%) (F), and liver tissue density (%) (G) in lean and NAFLD groups. H: Western blot analysis of β-actin and PP2A protein levels in the liver homogenates of control (lean and NAFLD) and MC-tested groups. I: morphometric band analysis of PP2A normalized against β-actin. The y-axis depicts the PP2A to β-actin ratio. J: quantitative RT-PCR (qRT-PCR) analysis of mRNA expression of PP2AR subunit in liver. K: qRT-PCR analysis of mRNA expression of PP2AC subunit in the liver for control (lean and NAFLD) and MC-tested groups. L: Western blot analysis of β-actin and PP2A protein levels in the human liver homogenates comparing control with nonalcoholic steatohepatitis (NASH). M: morphometric band analysis of PP2A normalized against β-actin. The y-axis depicts the PP2A-to-β-actin ratio. N: qRT-PCR analysis of mRNA expression of PP2AR5D subunit in liver. O: qRT-PCR analysis of mRNA expression of PP2ACB subunit in liver comparing control with NASH. *P < 0.05. Results were expressed as means ± SE.
Fig. 1.
Fig. 1.
Exogenous protein phosphatase 2A (PP2A) inhibition in mouse liver exacerbates nonalcoholic fatty liver disease (NAFLD) pathology. Qualitative and quantitative image analysis of microcystin (MC) effects on liver steatosis and fibrosis induced in an NAFLD mouse model. A: representative histological images of liver sections stained with hematoxylin-eosin (H&E), from lean mouse control and lean mouse + MC (n = 3), wild-type mouse NAFLD, and NAFLD + MC (n = 3). B: representative histological images of the same groups of mice stained with picrosirius red (PicroS). Images were taken at ×20 magnification. C: quantification of serum alanine aminotransferase (ALT) level and comparison between control (lean and NAFLD) and MC-tested groups. Automatic digital-imaging quantification of steatosis area (%) (D), mean vesicle size (µm2) (E), fibrosis area (%) (F), and liver tissue density (%) (G) in lean and NAFLD groups. H: Western blot analysis of β-actin and PP2A protein levels in the liver homogenates of control (lean and NAFLD) and MC-tested groups. I: morphometric band analysis of PP2A normalized against β-actin. The y-axis depicts the PP2A to β-actin ratio. J: quantitative RT-PCR (qRT-PCR) analysis of mRNA expression of PP2AR subunit in liver. K: qRT-PCR analysis of mRNA expression of PP2AC subunit in the liver for control (lean and NAFLD) and MC-tested groups. L: Western blot analysis of β-actin and PP2A protein levels in the human liver homogenates comparing control with nonalcoholic steatohepatitis (NASH). M: morphometric band analysis of PP2A normalized against β-actin. The y-axis depicts the PP2A-to-β-actin ratio. N: qRT-PCR analysis of mRNA expression of PP2AR5D subunit in liver. O: qRT-PCR analysis of mRNA expression of PP2ACB subunit in liver comparing control with NASH. *P < 0.05. Results were expressed as means ± SE.
Fig. 2.
Fig. 2.
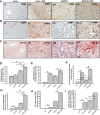
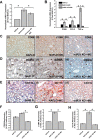
Protein phosphatase 2A inhibition by microcystin (MC) activates Kupffer cells and hepatic stellate cells and induces an inflammatory surge in mouse liver. Representative histological images of liver sections immunostained with CD68 (A), α-smooth muscle actin (SMA) (B), and CD11b (C) from lean mouse, lean mouse + MC, nonalcoholic fatty liver disease (NAFLD), and NAFLD + MC (n = 3/group). Images were taken at ×20 magnification. Morphometric analysis of CD68 (D), α-SMA (E), and CD11b (F) in lean, lean + MC, NAFLD, and NAFLD + MC groups (n = 3/group). Morphometric analysis was expressed in percentage of positive immunoreactive area per regions of interest (ROIs) (3 ROIs/liver section). Quantitative RT-PCR analysis of mRNA expression of CCL2 (G), TNF-α (H), and CD68 (I), in lean, lean + MC, NAFLD, and NAFLD + MC livers. The mRNA expressions were normalized with 18s and presented as fold change of lean group. *P < 0.05. Results were expressed as means ± SE.
Fig. 3.
Fig. 3.
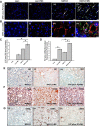
The activation of Kupffer cells, hepatic stellate cells, and an inflammatory surge in microcystin (MC)-exposed livers are mediated by NADPH oxidase 2-dependent oxidative stress. A: representative images of P47 phox (red) and GP91 phox (green) immunofluorescence counterstained with DAPI (blue); colocalization indicated by arrows. Images were taken at ×40 magnification. B: representative images of CD68 (red) and GP91 phox (green) immunofluorescence counterstained with DAPI (blue), from lean, lean + MC, nonalcoholic fatty liver disease (NAFLD), and NAFLD + MC (n = 3/group). Colocalization was indicated by a circle. Images were taken at ×60 magnification. C: morphometric analysis of P47 phox (red) and GP91 phox (green) colocalization expressed in percentage of positive colocalized immunoreactive area per region of interest (ROI) (3 ROIs/liver section, n = 3 each group). D: quantitative RT-PCR (qRT-PCR) analysis of mRNA expression of P47 phoxin lean and NAFLD groups treated with MC, expressed as fold change of lean control group. Representative immunohistochemistry images depicting 3-nitrotyrosine (3NT) (E), CD68 (F), α-smooth muscle actin (SMA) (G), and CD11b (H) expression in NAFLD, NAFLD + MC, and P47 phox knockout (KO) groups treated with MC. All immunohistochemistry images were taken at ×20. Morphometric analysis of 3NT (I), CD68 (J), α-SMA (K), and CD11b (L) immunoreactivity in NAFLD, NAFLD + MC, and P47 KO mice treated with MC, expressed in percentage of positive immunoreactive area per ROIs (n = 3/group, 3 ROIs/liver section). qRT-PCR analysis of mRNA expression of CD68, CCL2 and TNF-α in NAFLD and P47 KO mice treated with MC, expressed as fold change of NAFLD control group (M). *P < 0.05. Results were expressed as means ± SE.
Fig. 3.
Fig. 3.
The activation of Kupffer cells, hepatic stellate cells, and an inflammatory surge in microcystin (MC)-exposed livers are mediated by NADPH oxidase 2-dependent oxidative stress. A: representative images of P47 phox (red) and GP91 phox (green) immunofluorescence counterstained with DAPI (blue); colocalization indicated by arrows. Images were taken at ×40 magnification. B: representative images of CD68 (red) and GP91 phox (green) immunofluorescence counterstained with DAPI (blue), from lean, lean + MC, nonalcoholic fatty liver disease (NAFLD), and NAFLD + MC (n = 3/group). Colocalization was indicated by a circle. Images were taken at ×60 magnification. C: morphometric analysis of P47 phox (red) and GP91 phox (green) colocalization expressed in percentage of positive colocalized immunoreactive area per region of interest (ROI) (3 ROIs/liver section, n = 3 each group). D: quantitative RT-PCR (qRT-PCR) analysis of mRNA expression of P47 phoxin lean and NAFLD groups treated with MC, expressed as fold change of lean control group. Representative immunohistochemistry images depicting 3-nitrotyrosine (3NT) (E), CD68 (F), α-smooth muscle actin (SMA) (G), and CD11b (H) expression in NAFLD, NAFLD + MC, and P47 phox knockout (KO) groups treated with MC. All immunohistochemistry images were taken at ×20. Morphometric analysis of 3NT (I), CD68 (J), α-SMA (K), and CD11b (L) immunoreactivity in NAFLD, NAFLD + MC, and P47 KO mice treated with MC, expressed in percentage of positive immunoreactive area per ROIs (n = 3/group, 3 ROIs/liver section). qRT-PCR analysis of mRNA expression of CD68, CCL2 and TNF-α in NAFLD and P47 KO mice treated with MC, expressed as fold change of NAFLD control group (M). *P < 0.05. Results were expressed as means ± SE.
Fig. 4.
Fig. 4.
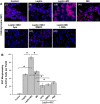
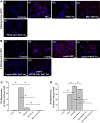
The protein phosphatase 2A inhibition activates NADPH oxidase 2-dependent oxidative stress in Kupffer cells. Leptin was used to mimic a nonalcoholic fatty liver disease (NAFLD) condition. Kupffer cells were exposed to 100 ng/mL leptin for 24 h. A: representative immunofluorescence images depicting P47 phox (red) and GP-91 phox (green) immunolabelling, counterstained with DAPI (blue), in control, leptin, microcystin (MC), leptin + MC, and leptin + MC + apocynin (Apo) rat Kupffer cells groups. Images were taken at ×60 magnification. B: morphometric analysis of the number of cells expressing a colocalization for P47 phox and GP91 phox. The y-axis shows colocalization events/100-cell unit (n = 3, analysis from 3 separate microscopic fields). *P < 0.05. Results were expressed as means ± SE.
Fig. 5.
Fig. 5.
Protein phosphatase 2A inhibitor microcystin (MC) synergistically increases NADPH oxidase 2 (NOX2)-dependent tyrosine nitration in Kupffer cells. NOX2-dependent tyrosin nitration marker 3-nitrotyrosine (3NT) immunoreactivity in leptin-activated rat Kupffer cell line. A: representative immunofluorescence images depicting 3NT immunoreactivity in control, leptin, MC, leptin + MC, leptin + MC + apocynin (Apo), leptin + MC + DMPO, and leptin + MC + phenyl boronic acid (FBA) Kupffer cells groups. Images were taken at ×20 magnification. B: morphometric analysis of the number of immunoreactive cells for 3NT in control and treated groups. The y-axis shows immunoreactive events/100-cell unit (n = 3, analysis from 3 separate microscopic fields). *P < 0.05. Results were expressed as means ± SE.
Fig. 6.
Fig. 6.
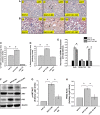
Exogenous protein phosphatase 2A inhibitor-induced oxidative stress triggers miR21-dependent NF-κB pathway activation in nonalcoholic steatohepatitis. Histological features and morphometric analysis of CD68, α-smooth muscle actin (SMA), and CD11b expression in nonalcoholic fatty liver disease (NAFLD) and miR21 knockout (KO) mice. A: quantitative RT-PCR (qRT-PCR) analysis of miRNA expression of miR21 in NAFLD, NAFLD + microcystin (MC), and P47 KO + MC groups, expressed as fold change of NAFLD group. B: qRT-PCR analysis of mRNA expression of CD68, CCL2, and TNF-α, in NAFLD, NAFLD + MC, and miR21 KO groups. mRNA expression is represented as fold change of NAFLD. Representative immunohistochemical images depicting CD68 (C), α-SMA (D), and CD11b (E) immunoreactivity in NAFLD, NAFLD + MC, and miR21 KO groups. Morphometric analysis of CD68 (F), α-SMA (G), and CD11b (H) immunolabelling in the various treated groups. The y-axis shows the percentage of positive immunoreactive area/region of interest (ROI) (n = 3, analysis from 3 separate microscopic fields). *P < 0.05. Results were expressed as means ± SE.
Fig. 7.
Fig. 7.
Exogenous protein phosphatase 2A inhibitor-induced miR21 upregulation acted downstream by modulating the p-AKT-NF-κB signaling pathway. A and B: representative immunohistochemical images depicting p-AKT and P65 immunoreactivity in nonalcoholic fatty liver disease (NAFLD), NAFLD + microcystin (MC), and miR21 knockout (KO) + MC groups. C and D: morphometric analysis of p-AKT and P65 immunolabelling in various treated groups; y-axis shows the percentage of positive immunoreactive area/region of interest (ROI) (n = 3, analysis from 3 separate microscopic fields). E: quantative RT-PCR analysis of mRNA expression of RelA, NF-κB-P105, and P-65 in NAFLD, NAFLD + MC, and miR21 KO groups, expressed as fold change of NAFLD. F: Western blot analysis of β-actin, p-AKT, AKT, and P65 protein levels in the liver homogenates in NAFLD, NAFLD + MC, and miR21 KO groups. G: morphometric band analysis of p-AKT normalized against AKT. The y-axis depicts the p-AKT-to-AKT ratio. H: morphometric band analysis of P65 normalized against β-actin. The y-axis depicts the P65-to-β-actin ratio in the liver of NAFLD, NAFLD + MC, and miR21 KO groups, expressed as fold change of NAFLD. *P < 0.05. Results were expressed as means ± SE.
Fig. 8.
Fig. 8.
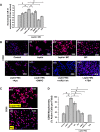
NADPH oxidase 2-miR21-NF-κB signaling pathway in microcystin (MC)-exposed immortalized rat Kupffer cells. A: miR21 expression in control, leptin, MC, leptin + MC, leptin + MC + apocynin (Apo), leptin + MC + DMPO, leptin + MC + miR21 inhibitor (inh), and leptin + MC + phenyl boronic acid (FBA). miRNA expression is represented as fold change of control group. B: representative immunofluorescence images depicting CD68 (red), counterstained with DAPI (blue), in control and tested rat Kupffer cell groups. Images were taken at ×20 magnification. C: immunofluorescence images depicting CD68 (red), counterstained with DAPI (blue), in leptin + MC and MC groups of rat Kupffer cells. Images were taken at ×40 magnification. D: morphometric analysis of CD68 immunoreactivity; y-axis shows the percentage of activated Kupffer cells per region of interest (n = 3, analysis from 3 separate microscopic fields). *P < 0.05. Results were expressed as means ± SE.
Fig. 9.
Fig. 9.
Exogenous protein phosphatase 2A inhibitor exposure increases M1 phenotype in Kupffer cells. Immunoreactivity of β-tubulin and inducible nitric oxide synthase (iNOS) and quantification of nitirc oxide in leptin-activated rat Kupffer cell line. A and B: immunofluorescence images depicting β-tubulin and NOS2 (iNOS) (red), counterstained with DAPI (blue), in control, leptin, microcystin (MC), leptin + MC, leptin + MC + apocynin (Apo), leptin + MC + DMPO, leptin + MC + miR21 inhibitor (inh) and leptin + MC + phenyl boronic acid (FBA) groups of rat Kupffer cells. Images were taken at ×60 magnification. C: nitric oxide release measured as total nitrite (μM) in variously treated leptin-activated Kupffer cells. *P < 0.05. Results were expressed as means ± SE.
Fig. 10.
Fig. 10.
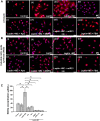
Exogenous protein phosphatase 2A inhibitor exposure activates hepatic stellate cells via NADPH oxidase 2-miR21 axis. A: immunofluorescence images depicting α-smooth muscle actin (SMA) (green), counterstained with DAPI (blue), in control, leptin, microcystin (MC), leptin + MC, leptin + MC + apocynin (Apo), leptin + MC + DMPO, leptin + MC + miR21 inhibitor (inh), and leptin + MC + phenyl boronic acid (FBA) groups of 8B rat hepatic stellate cells. Images were taken at ×40 magnification. B: morphometric analysis of α-SMA immunoreactivity; y-axis shows the percentage of α-SMA-positive cells per region of interest (ROI) (n = 3, analysis from 3 separate microscopic fields). *P < 0.05. Results were expressed as means ± SE.
Fig. 11.
Fig. 11.
Exogenous protein phosphatase 2A (PP2A) inhibitor activates NADPH oxidase 2 via AKT pathway. Immunoreactivity and morphometric analysis of P47 phox and GP91 phox expression in leptin and microcystin (MC) -treated rat Kupffer cells. A: immunofluorescence images depicting P47 phox (red) and GP91 phox (green) colocalization, counterstained with DAPI (blue), in control, MC, PP2A inhibitor (inh), AKT inh + MC, and AKT inh + PP2A inh. B: immunofluorescence images depicting P47 phox (red) and GP91 phox (green) colocalization, counterstained with DAPI (blue), in control, leptin, leptin + MC, Leptin + PP2A inh, leptin + MC + AKT inh, and leptin + PP2A inh + AKT inh. C and D: quantitative analysis of the number of colocalized cells for P47 phox and GP91 phox in the various Kupffer cell line groups; y-axis shows colocalization events/100-cell unit (n = 3, analysis from 3 separate microscopic fields). *P < 0.05. Results were expressed as means ± SE.
Fig. 12.
Fig. 12.
Exogenous protein phosphatase 2A (PP2A) inhibitor-activated NADPH oxidase 2 generates oxidative stress via AKT pathway. Immunoreactivity and morphometric analysis of 3-nitrotyrosine (3NT) expression in rat Kupffer cells. A: immunofluorescence images depicting 3NT immunoreactivity (red), counterstained with DAPI (blue), in control, microcystin (MC), PP2A inhibitor (inh), MC + AKT inh, and PP2A inh + AKTinh. B: immunofluorescence images depicting P47 phox (red) and GP91 phox (green) colocalization, counterstained with DAPI (blue), in control, leptin, leptin + MC, leptin + PP2A inh, leptin + MC + AKT inh, and leptin + PP2A inh + AKT inh. C and D: quantitative analysis of the number of immunoreactive cells for 3NT immunoreactivity in various treated groups; y-axis shows colocalization events/100-cell unit (n = 3, analysis from 3 separate microscopic fields). *P < 0.05. Results were expressed as means ± SE.
Fig. 13.
Fig. 13.
Mechanism of protein phosphatase 2A (PP2A) inhibition-induced nonalcoholic fatty liver disease (NAFLD) pathology. Graphical representation showing upregulation of miR21 via NADPH oxidase 2 (NOX2) activation by exogenous PP2A inhibitor (microcystin) in Kupffer cells, leading to transcriptional upregulation of inflammatory cytokines, M1 polarization, and fibrosis in NAFLD liver. α-SMA, α-smooth muscle actin; Apo, apocynin; FBA, phenyl boronic acid.

References

    1. Alhasson F, Seth RK, Sarkar S, Kimono DA, Albadrani MS, Dattaroy D, Chandrashekaran V, Scott GI, Raychoudhury S, Nagarkatti M, Nagarkatti P, Diehl AM, Chatterjee S. High circulatory leptin mediated NOX-2-peroxynitrite-miR21 axis activate mesangial cells and promotes renal inflammatory pathology in nonalcoholic fatty liver disease. Redox Biol 17: 1–15, 2018. doi:10.1016/j.redox.2018.04.002. - DOI - PMC - PubMed
    1. Amado LL, Monserrat JM. Oxidative stress generation by microcystins in aquatic animals: why and how. Environ Int 36: 226–235, 2010. doi:10.1016/j.envint.2009.10.010. - DOI - PubMed
    1. Arciello M, Gori M, Maggio R, Barbaro B, Tarocchi M, Galli A, Balsano C. Environmental pollution: a tangible risk for NAFLD pathogenesis. Int J Mol Sci 14: 22052–22066, 2013. doi:10.3390/ijms141122052. - DOI - PMC - PubMed
    1. Barrett JP, Henry RJ, Villapol S, Stoica BA, Kumar A, Burns MP, Faden AI, Loane DJ. NOX2 deficiency alters macrophage phenotype through an IL-10/STAT3 dependent mechanism: implications for traumatic brain injury. J Neuroinflammation 14: 65, 2017. doi:10.1186/s12974-017-0843-4. - DOI - PMC - PubMed
    1. Bohinc BN, Diehl AM. Mechanisms of disease progression in NASH: new paradigms. Clin Liver Dis 16: 549–565, 2012. doi:10.1016/j.cld.2012.05.002. - DOI - PubMed

Publication types

MeSH terms