. 2019 Aug;127(8):87003.
doi: 10.1289/EHP3857. Epub 2019 Aug 8.

Associations of Combined Exposures to Surrounding Green, Air Pollution, and Road Traffic Noise with Cardiometabolic Diseases

Affiliations

Associations of Combined Exposures to Surrounding Green, Air Pollution, and Road Traffic Noise with Cardiometabolic Diseases

Jochem O Klompmaker et al. Environ Health Perspect. 2019 Aug.

Erratum in

Abstract

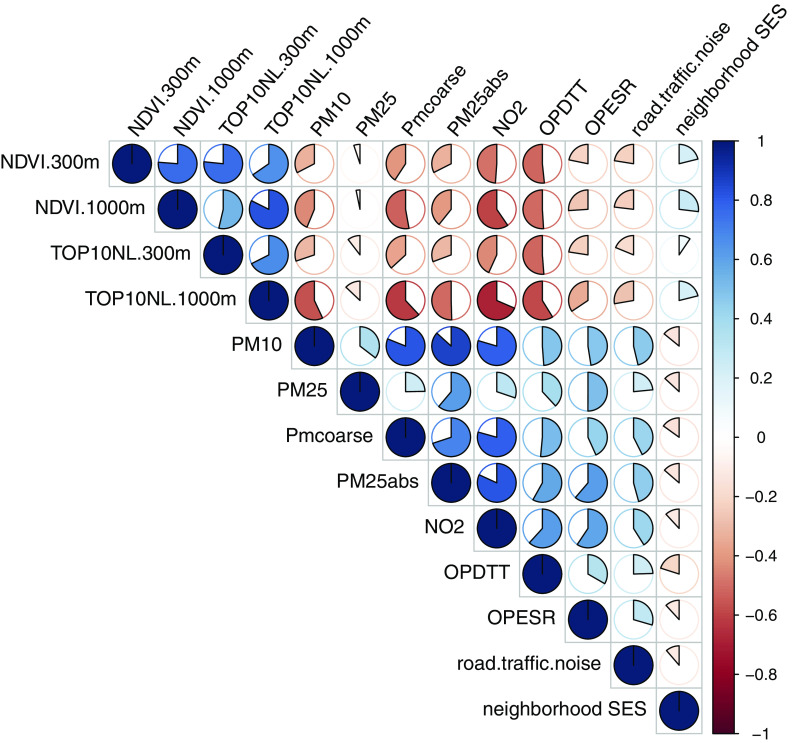
Background: Surrounding green, air pollution, and noise have been associated with cardiometabolic diseases, but most studies have assessed only one of these correlated exposures.

Objectives: We aimed to evaluate associations of combined exposures to green, air pollution, and road traffic noise with cardiometabolic diseases.

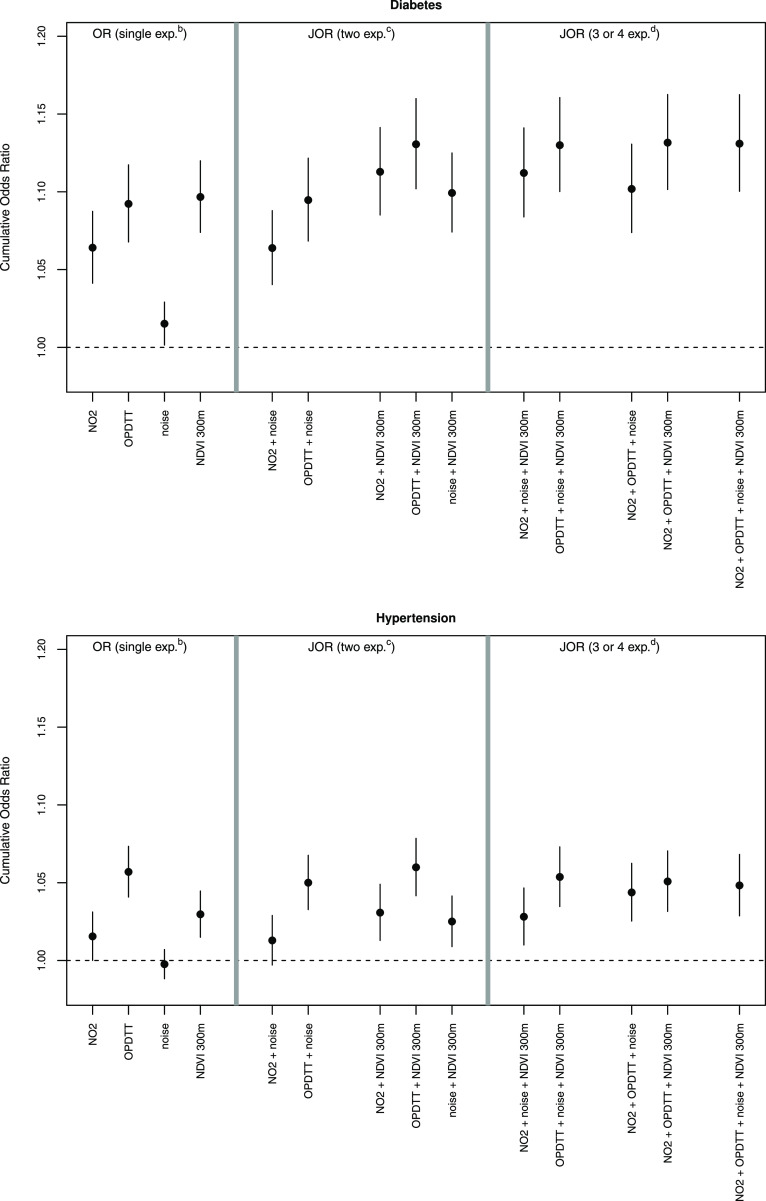
Methods: In this cross-sectional study, we studied associations between self-reported physician-diagnosed diabetes, hypertension, heart attack, and stroke from a Dutch national health survey of 387,195 adults and residential surrounding green, annual average air pollutant concentrations [including particulate matter with aerodynamic diameter [Formula: see text] ([Formula: see text]), PM with aerodynamic diameter [Formula: see text] ([Formula: see text]), nitrogen dioxide ([Formula: see text]), and oxidative potential (OP) with the dithiothreitol (DTT) assay ([Formula: see text])] and road traffic noise. Logistic regression models were used to analyze confounding and interaction of surrounding green, air pollution, and noise exposure.

Results: In single-exposure models, surrounding green was inversely associated with diabetes, while air pollutants ([Formula: see text], [Formula: see text]) and road traffic noise were positively associated with diabetes. In two-exposure analyses, associations with green and air pollution were attenuated but remained. The association between road traffic noise and diabetes was reduced to unity when adjusted for surrounding green or air pollution. Air pollution and surrounding green, but not road traffic noise, were associated with hypertension in single-exposure models. The weak inverse association of surrounding green with hypertension attenuated and lost significance when adjusted for air pollution. Only [Formula: see text] was associated with stroke and heart attack.

Conclusions: Studies including only one of the correlated exposures surrounding green, air pollution, and road traffic noise may overestimate the association of diabetes and hypertension attributed to the studied exposure. https://doi.org/10.1289/EHP3857.


Figures

Figure 1A is a schematic representation of a single exposure effect. NDVI 300m and OP DTT each lead to the box labeled diabetes. Figure 1B shows confounding relations, where NDVI 300m and OP DTT each lead to the box labeled diabetes. NDVI 300m and OP DTT are connected with a dotted line. Figure 1C shows interaction, where NDVI 300m and OP DTT each lead to the box labeled diabetes. NDVI 300m and OP DTT are connected with a curved line. An arrow originating from the curved line also leads to the box labeled diabetes. Figure 1D shows mediation, where NDVI 300m and OP DTT each lead to the box labeled diabetes. NDVI 300m leads to the box labeled OP DTT. A dotted rectangle appears outside the box labeled OP DTT.
Figure 1.
Schematic overview of the analyses performed for two exposures and one health outcome. The black solid lines represent hypothesized causal relationships; the black dashed line represents a noncausal relationship. Note: NDVI, Normalized Difference Vegetation Index; OPDTT, oxidative potential (OP) metric with dithiothreitol (DTT).
Figure 2 is a schematic representation showing Spearman correlations.
Figure 2.
Spearman correlations between surrounding green, air pollution, road traffic noise, and neighborhood socioeconomic status (SES). Clockwise pies denote positive correlations, and counterclockwise pies denote negative correlations. Note: All correlations are statistically significant, different from 0.0 (p<0.005). Surrounding green space in a 300-m buffer based on TOP10NL; surrounding green space in a 1,000-m buffer based on TOP10NL. NDVI, Normalized Difference Vegetation Index; NO2, nitrogen dioxide; OPDTT, oxidative potential (OP) metric with dithiothreitol (DTT); OPESR, oxidative potential (OP) metric with electron spin resonance; PM2.5, PM with aerodynamic diameter 2.5μm; PM10, particulate matter with aerodynamic diameter 10μm.
The first diagram in Figure 3 plots odds ratios (single-exposure models) and joint odds ratio (two-exposure models and three- or four-exposure models) for diabetes. The second diagram plots the same for hypertension.
Figure 3.
Joint odds ratios (JORs) for associations of air pollution, road traffic noise, and decreased surrounding green with diabetes and hypertension. The JORs are based on the CRI methods and represents the odds for a 1-unit [interquartile range (IQR)] increase in air pollution and road traffic noise and a 1-unit decrease in surrounding green exposure relative to the odds for no increase (no decrease in surrounding green) in any of the exposures. Results are given as JOR [95% confidence interval (CI)] per continuous increase for air pollution and road traffic noise and decrease for surrounding green (IQR for Normalized Difference Vegetation Index (NDVI) 300m: 0.13, IQR for OPDTT: 0.27nmolDTT/min/m3, IQR for NO2: 7.85μg/m3, increment for road traffic noise: 5dB) (main model). bORs are based on effect estimates of single-exposure models, cJORs are based on effect estimates of two-exposure models, dJORs are based on effect estimates of three- or four-exposure models. Note: NO2, nitrogen dioxide; OPDTT, oxidative potential (OP) with the dithiothreitol (DTT) assay.

References

    1. Allen RW, Davies H, Cohen MA, Mallach G, Kaufman JD, Adar SD. 2009. The spatial relationship between traffic-generated air pollution and noise in 2 US cities. Environ Res 109(3):334–342, PMID: , 10.1016/j.envres.2008.12.006. - DOI - PMC - PubMed
    1. Astell-Burt T, Feng X, Kolt GS. 2014. Is neighborhood green space associated with a lower risk of type 2 diabetes? Evidence from 267,072 Australians. Diabetes Care 37(1):197–201, PMID: , 10.2337/dc13-1325. - DOI - PubMed
    1. Atkinson RW, Carey IM, Kent AJ, van Staa TP, Anderson HR, Cook DG. 2013. Long-term exposure to outdoor air pollution and incidence of cardiovascular diseases. Epidemiology 24(1):44–53, PMID: , 10.1097/EDE.0b013e318276ccb8. - DOI - PubMed
    1. Babisch W. 2014. Updated exposure-response relationship between road traffic noise and coronary heart diseases: a meta-analysis. Noise Health 16(68):1–9, PMID: , 10.4103/1463-1741.127847. - DOI - PubMed
    1. Balti EV, Echouffo-Tcheugui JB, Yako YY, Kengne AP. 2014. Air pollution and risk of type 2 diabetes mellitus: a systematic review and meta-analysis. Diabetes Res Clin Pract 106(2):161–172, PMID: , 10.1016/j.diabres.2014.08.010. - DOI - PubMed

Publication types

MeSH terms