. 2019 Aug 8;14(8):e0220106.
doi: 10.1371/journal.pone.0220106. eCollection 2019.

Forecasting dengue fever in Brazil: An assessment of climate conditions

Affiliations

Forecasting dengue fever in Brazil: An assessment of climate conditions

Lucas M Stolerman et al. PLoS One. .

Abstract

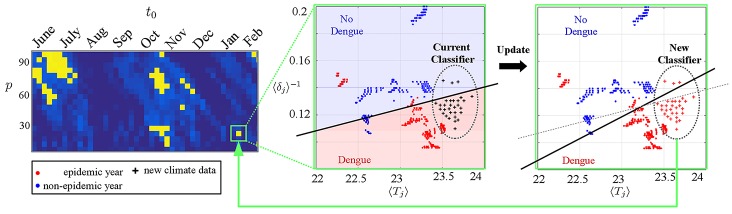
Local climate conditions play a major role in the biology of the Aedes aegypti mosquito, the main vector responsible for transmitting dengue, zika, chikungunya and yellow fever in urban centers. For this reason, a detailed assessment of periods in which changes in climate conditions affect the number of human cases may improve the timing of vector-control efforts. In this work, we develop new machine-learning algorithms to analyze climate time series and their connection to the occurrence of dengue epidemic years for seven Brazilian state capitals. Our method explores the impact of two key variables-frequency of precipitation and average temperature-during a wide range of time windows in the annual cycle. Our results indicate that each Brazilian state capital considered has its own climate signatures that correlate with the overall number of human dengue-cases. However, for most of the studied cities, the winter preceding an epidemic year shows a strong predictive power. Understanding such climate contributions to the vector's biology could lead to more accurate prediction models and early warning systems.


Conflict of interest statement

The authors have declared that no competing interests exist.

Figures

Fig 1
Fig 1. Schematic overview.
We analyze time series data for climate variables from seven Brazilian state capitals (Aracajú, Belo Horizonte, Manaus, Recife, Rio de Janeiro, Salvador, and São Luís) and their connection to dengue epidemic years. (i) Illustrative example showing data from Rio de Janeiro. Two parameters define the epochs in which climate conditions are considered: the starting date t0 (month/day) and period length of p (days). (ii) We locate periods along the year where the separability between epidemic and non-epidemic climate is higher. Keeping track of signature differences at key epochs may significantly improve dengue forecasting in the upcoming years.
Fig 2
Fig 2. Outline of SVM methodology.
A supervised learning technique for classification: (i) We calculate and plot mean of average temperature 〈Tj〉 and frequency of rain events 〈δj−1 for a fixed (t0, p) interval of all years, using red and blue colors or periods preceding epidemic and non-epidemic years respectively. (ii)(a) For each (t0, p) interval of the rectangle R (called (t0, p)-rectangle), we apply (i) to obtain a cloud (dashed circles) of points in the plane, for each year. (b) Linear and RBF kernels are used to execute the SVM train/test and cross-validation routines. (c) the SVM score for R is obtained. We plot t0 × p heatmaps with Regions of High and Low SVM scores, which indicates where temperature and precipitation are better correlated with the occurrence of dengue.
Fig 3
Fig 3. Outline of the prediction method.
For each state capital, we calculate the dengue probability for an out-of-sample year using the remaining 10 years as a training set: the user (i) chooses between a linear/nonlinear (RBF) classification kernel to build a heatmap of SVMscore for a wide range of t0 and p values, (ii) selects (t0, p) rectangles with SVMscoreα × max(SVMscore) for a threshold parameter α, and (iii) computes the probability of dengue occurrence in the testing year using the Earliest as Possible (EP) strategy or the Average of All (AA) strategy. EP uses only the first selected rectangle (boxed in green) while AA takes an average of the probabilities of all selected rectangles (circled in magenta). See text for details.
Fig 4
Fig 4. Examples of high and low cluster separability plots with the full training dataset.
For each state Capital, we selected special time windows in which there was a clear separation between climate signatures preceding epidemic and non-epidemic years. This picture illustrates the cases of Rio de Janeiro and Recife. The Left side of the panel shows distinct data separation, while in the right side the climate variables seem to be poorly distinguishable, therefore not suitable for dengue prediction. This separability notion is made quantitatively precise by the SVM scores (see text for details). Examples for the other capitals can be found in the S1 Appendix.
Fig 5
Fig 5. Favorable climate conditions for epidemics in predictive EP-periods.
The EP strategy uses the rectangle in the t0 × p plane with earliest t0. Four capitals exhibited highly predictive EP rectangles, and we show the corresponding epidemic vs non-epidemic climate conditions. Belo Horizonte: EP-window from June 13th to August 25th. Most epidemic years had a precipitation rate in the interval [0.02,0.08] and different clusters were separated by an ovoid-shape kernel. Rio de Janeiro: EP-window ranged between June 19th and September 25th. Most epidemic years had average temperatures above 23° Celsius and precipitation rates below 0.15. Clusters were separated by an hyperboloid-shape kernel. Aracajú: EP-window from June 1st–19th. There is a clear separability between dengue and no-dengue regarding a temperature threshold around 25.2° Celsius. Clusters were separated by an S-shape kernel. Salvador: EP-windows from August 30th–December 11th. Clusters were separated by a single linear threshold of 〈δi−1 below 0.2. The picture shows climate signatures considering training years 2003–2012 for Rio de Janeiro and 2002–2011 for the other capitals.
Fig 6
Fig 6. Appending data for further analysis.
For a high scored (t0, p)-rectangle (green box), we plot the respective climate indicators with their epidemic/non-epidemic (red/blue) labels. A classifier is used to predict the outcome of newly available climate data (black crosses). Depending on the outcome, the new data is appended to the SVM-training set. This procedure will also update the SVM score and the importance of the chosen (t0, p)-rectangle for dengue prediction.

References

    1. World Health Organization. dengue and severe dengue. WHO Factsheet No 117. Geneva. 2015; Available from: http://www.who.int/mediacentre/factsheets/fs117/en/.
    1. Bhatt S, Gething PW, Brady OJ, Messina JP, Farlow AW, Moyes CL, et al. The global distribution and burden of dengue. Nature. 2013; 496, 504–507. 10.1038/nature12060 - DOI - PMC - PubMed
    1. Figueredo LTM. Dengue in Brazil: Past, Present and Future Perspectives. dengue Bulletin. 2003; 27, 25–33.
    1. Fares RC, Souza KP, Añez G, Rios M. Epidemiological Scenario of dengue in Brazil. Biomed research international. 2015. 10.1155/2015/321873 - DOI - PMC - PubMed
    1. Rabaa MA, Simmons CP, Fox A, Le MQ, Nguyen TTT, et al. dengue virus in sub-tropical northern and central Viet Nam: Population immunity and climate shape patterns of viral invasion and maintenance. PLoS Negl Trop Dis. 2013; 7 (12) e2581 10.1371/journal.pntd.0002581 - DOI - PMC - PubMed

Publication types

MeSH terms