

MR-based cardiac and respiratory motion correction of PET: application to static and dynamic cardiac 18F-FDG imaging
- PMID: 31394518
- PMCID: PMC7007962
- DOI: 10.1088/1361-6560/ab39c2
MR-based cardiac and respiratory motion correction of PET: application to static and dynamic cardiac 18F-FDG imaging
Abstract
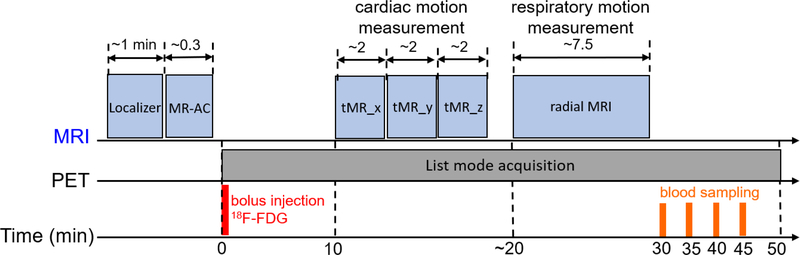
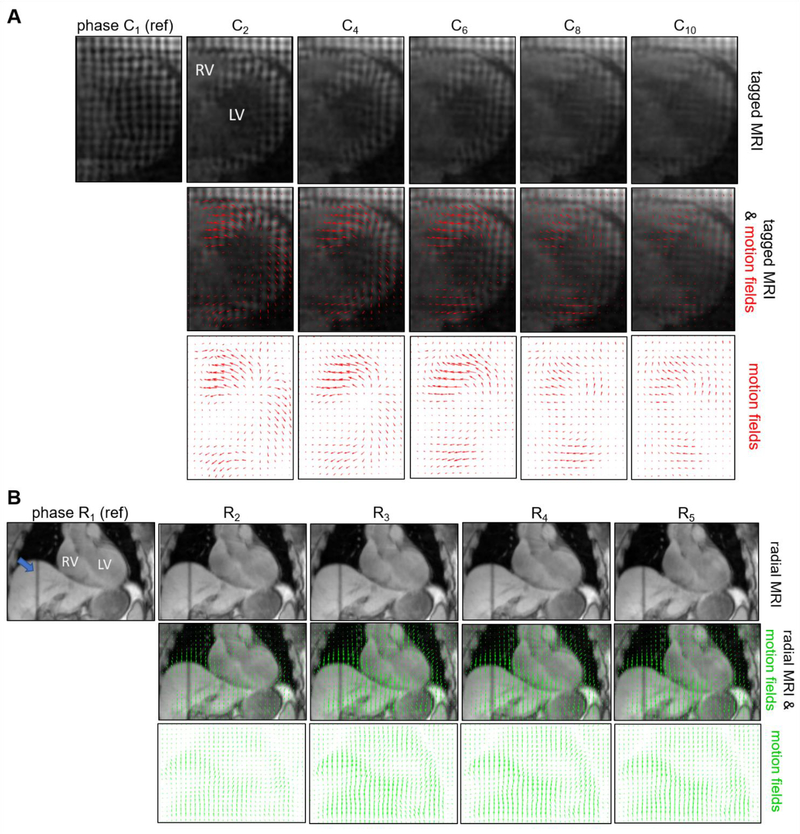
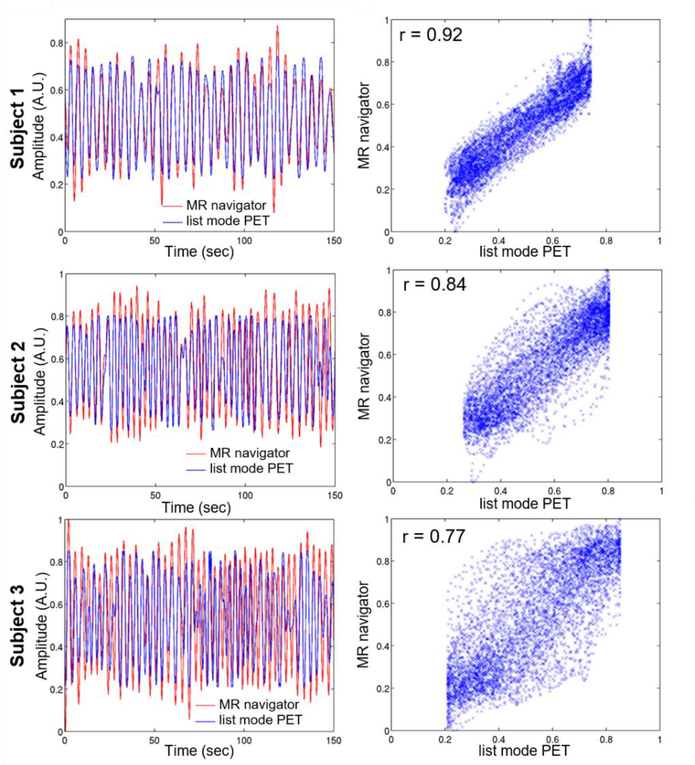
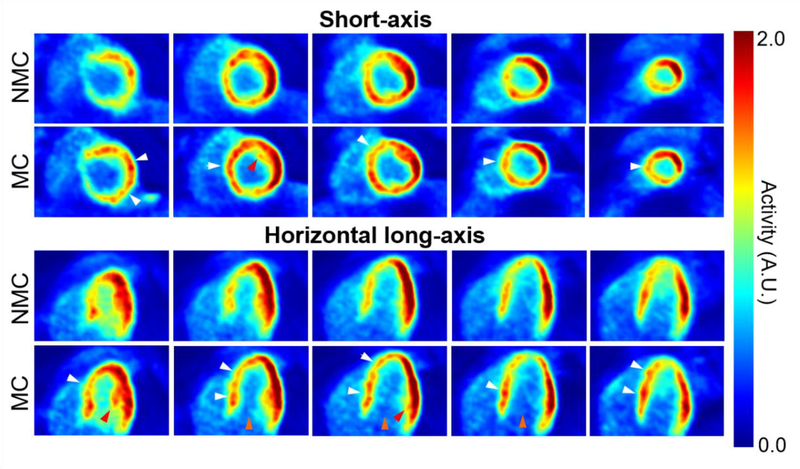
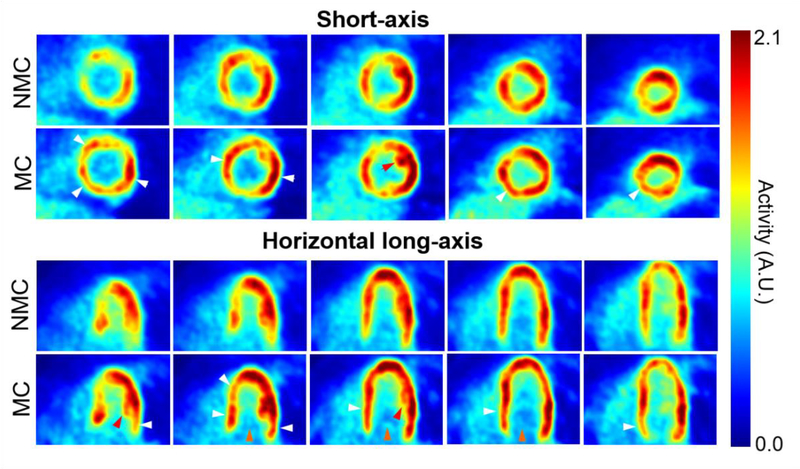
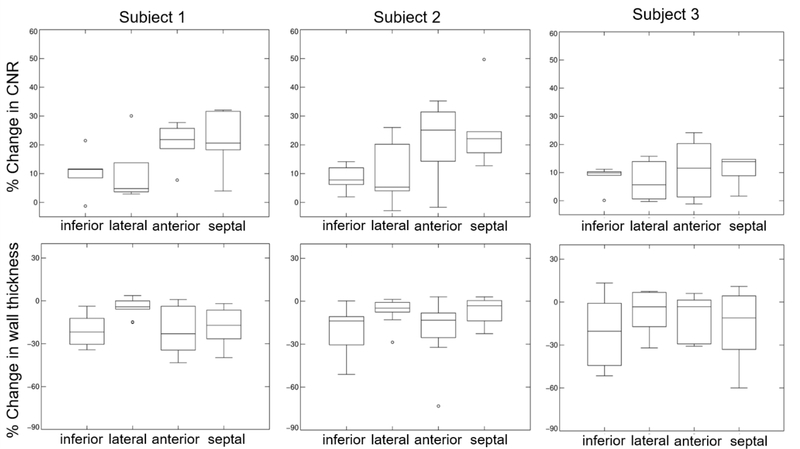
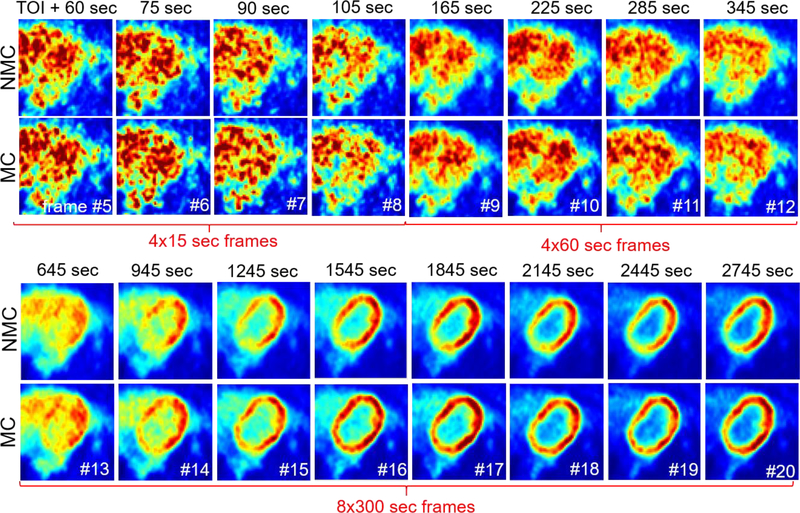
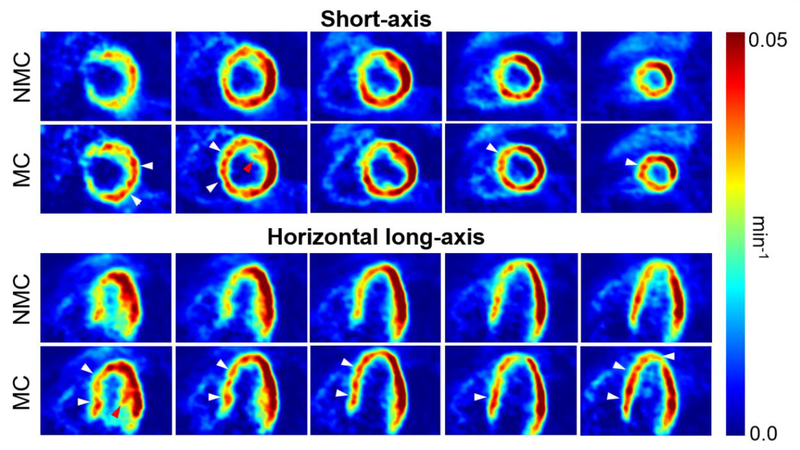
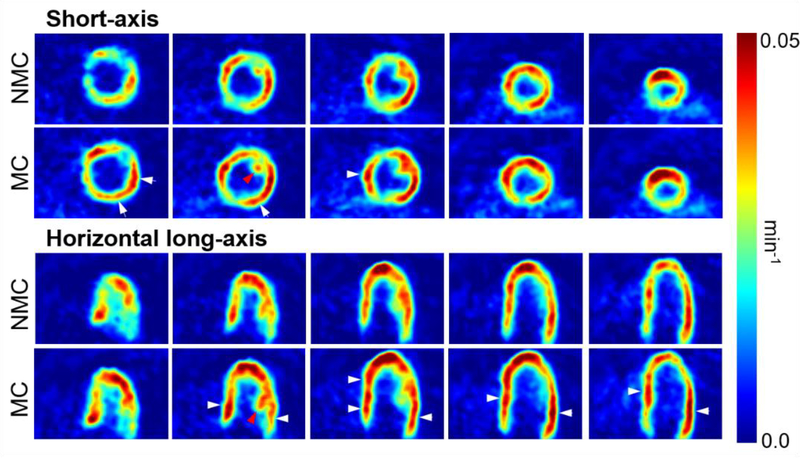
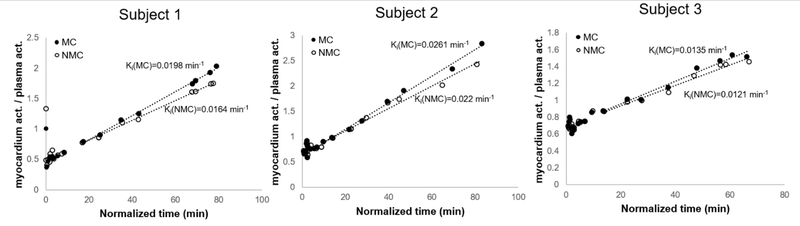
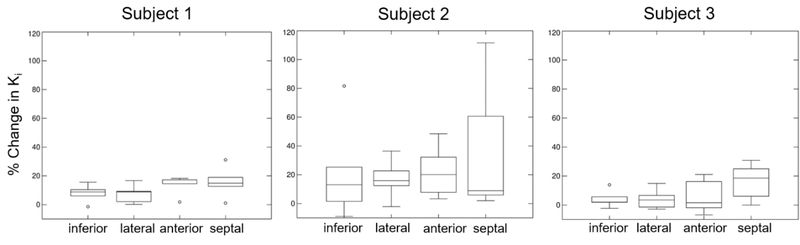
Motion of the myocardium deteriorates the quality and quantitative accuracy of cardiac PET images. We present a method for MR-based cardiac and respiratory motion correction of cardiac PET data and evaluate its impact on estimation of activity and kinetic parameters in human subjects. Three healthy subjects underwent simultaneous dynamic 18F-FDG PET and MRI on a hybrid PET/MR scanner. A cardiorespiratory motion field was determined for each subject using navigator, tagging and golden-angle radial MR acquisitions. Acquired coincidence events were binned into cardiac and respiratory phases using electrocardiogram and list mode-driven signals, respectively. Dynamic PET images were reconstructed with MR-based motion correction (MC) and without motion correction (NMC). Parametric images of 18F-FDG consumption rates (Ki) were estimated using Patlak's method for both MC and NMC images. MC alleviated motion artifacts in PET images, resulting in improved spatial resolution, improved recovery of activity in the myocardium wall and reduced spillover from the myocardium to the left ventricle cavity. Significantly higher myocardium contrast-to-noise ratio and lower apparent wall thickness were obtained in MC versus NMC images. Likewise, parametric images of Ki calculated with MC data had improved spatial resolution as compared to those obtained with NMC. Consistent with an increase in reconstructed activity concentration in the frames used during kinetic analyses, MC led to the estimation of higher Ki values almost everywhere in the myocardium, with up to 18% increase (mean across subjects) in the septum as compared to NMC. This study shows that MR-based motion correction of cardiac PET results in improved image quality that can benefit both static and dynamic studies.
Figures
Similar articles
-
MR-assisted PET motion correction in simultaneous PET/MRI studies of dementia subjects.J Magn Reson Imaging. 2018 Nov;48(5):1288-1296. doi: 10.1002/jmri.26000. Epub 2018 Mar 8. J Magn Reson Imaging. 2018. PMID: 29517819 Free PMC article.
-
Practical PET Respiratory Motion Correction in Clinical PET/MR.J Nucl Med. 2015 Jun;56(6):890-6. doi: 10.2967/jnumed.114.151779. Epub 2015 May 7. J Nucl Med. 2015. PMID: 25952740
-
Impact of motion and partial volume effects correction on PET myocardial perfusion imaging using simultaneous PET-MR.Phys Med Biol. 2017 Jan 21;62(2):326-343. doi: 10.1088/1361-6560/aa5087. Epub 2016 Dec 20. Phys Med Biol. 2017. PMID: 27997375 Free PMC article.
-
MR-Based Cardiac and Respiratory Motion-Compensation Techniques for PET-MR Imaging.PET Clin. 2016 Apr;11(2):179-91. doi: 10.1016/j.cpet.2015.09.004. Epub 2016 Jan 26. PET Clin. 2016. PMID: 26952730 Review.
-
Magnetic resonance-based motion correction for positron emission tomography imaging.Semin Nucl Med. 2013 Jan;43(1):60-7. doi: 10.1053/j.semnuclmed.2012.08.007. Semin Nucl Med. 2013. PMID: 23178089 Free PMC article. Review.
Cited by
-
Multiparametric Cardiac 18F-FDG PET in Humans: Kinetic Model Selection and Identifiability Analysis.IEEE Trans Radiat Plasma Med Sci. 2020 Nov;4(6):759-767. doi: 10.1109/trpms.2020.3031274. Epub 2020 Oct 15. IEEE Trans Radiat Plasma Med Sci. 2020. PMID: 33778234 Free PMC article.
-
Low-Dose PET Imaging of Tumors in Lung and Liver Regions Using Internal Motion Estimation.Diagnostics (Basel). 2021 Nov 18;11(11):2138. doi: 10.3390/diagnostics11112138. Diagnostics (Basel). 2021. PMID: 34829485 Free PMC article.
-
Design and system evaluation of a dual-panel portable PET (DP-PET).EJNMMI Phys. 2021 Jun 12;8(1):47. doi: 10.1186/s40658-021-00392-5. EJNMMI Phys. 2021. PMID: 34117943 Free PMC article.
-
Quantitative PET in the 2020s: a roadmap.Phys Med Biol. 2021 Mar 12;66(6):06RM01. doi: 10.1088/1361-6560/abd4f7. Phys Med Biol. 2021. PMID: 33339012 Free PMC article.
-
Motion correction for PET data using subspace-based real-time MR imaging in simultaneous PET/MR.Phys Med Biol. 2020 Dec 2;65(23):235022. doi: 10.1088/1361-6560/abb31d. Phys Med Biol. 2020. PMID: 33263317 Free PMC article.
References
-
- Klein GJ, Reutter RW, and Huesman RH, “Four-dimensional affine registration models for respiratory-gated PET,” IEEE Transactions on Nuclear Science, vol. 48, no. 3, pp. 756–760, 2002.
-
- Rogers WJ et al., “Quantification of and correction for left ventricular systolic long-axis shortening by magnetic resonance tissue tagging and slice isolation,” Circulation, vol. 84, no. 2, pp. 721–731, 1991. - PubMed
-
- Fisher M, von Schulthess G, and Higgins C, “Multiphasic cardiac magnetic resonance imaging: normal regional left ventricular wall thickening,” American Journal of Roentgenology, vol. 145, no. 1, pp. 27–30, Jul. 1985. - PubMed
-
- Gould KL, Pan T, Loghin C, Johnson NP, Guha A, and Sdringola S, “Frequent diagnostic errors in cardiac PET/CT due to misregistration of CT attenuation and emission PET images: a definitive analysis of causes, consequences, and corrections,” Journal of Nuclear Medicine, vol. 48, no. 7, pp. 1112–1121, 2007. - PubMed
-
- Loghin C, Sdringola S, and Gould KL, “Common artifacts in PET myocardial perfusion images due to attenuation–emission misregistration: clinical significance, causes, and solutions,” Journal of Nuclear Medicine, vol. 45, no. 6, pp. 1029–1039, 2004. - PubMed
Publication types
MeSH terms
Substances
Grants and funding
LinkOut - more resources
Full Text Sources
Medical