Review
. 2019 Aug 7;8(8):1176.
doi: 10.3390/jcm8081176.

Electrical Impedance Tomography for Cardio-Pulmonary Monitoring

Affiliations
Review

Electrical Impedance Tomography for Cardio-Pulmonary Monitoring

Christian Putensen et al. J Clin Med. .

Abstract

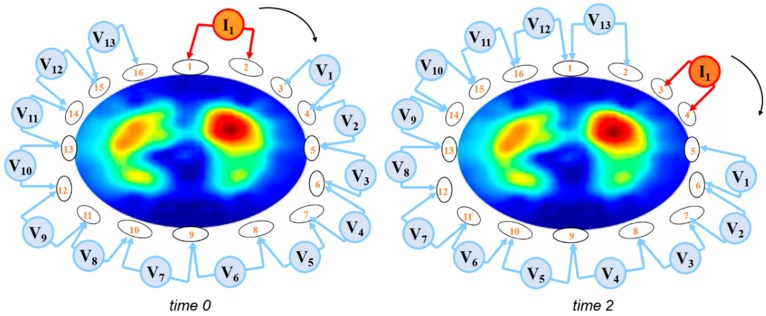
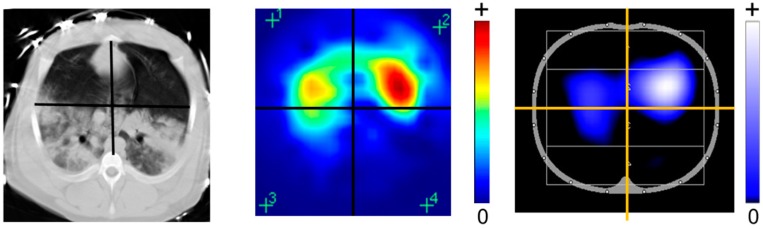
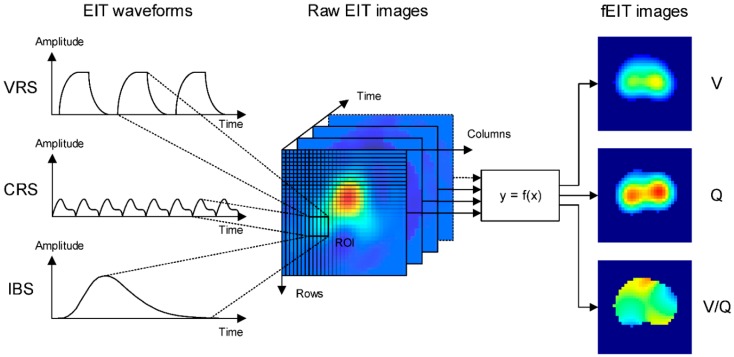
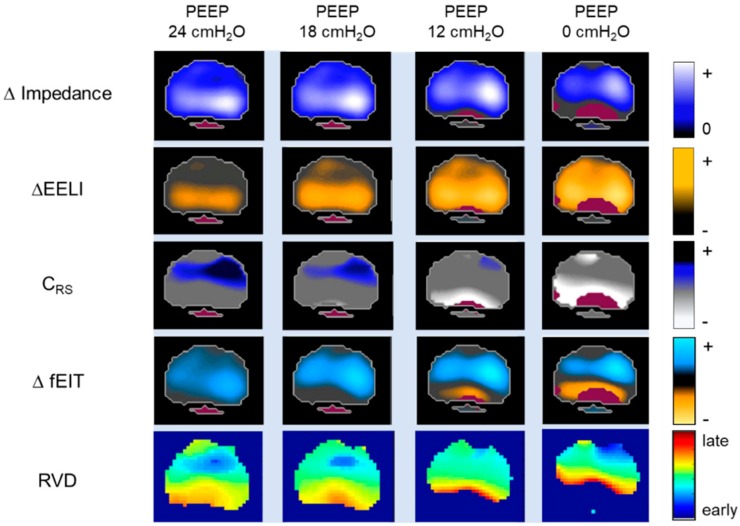
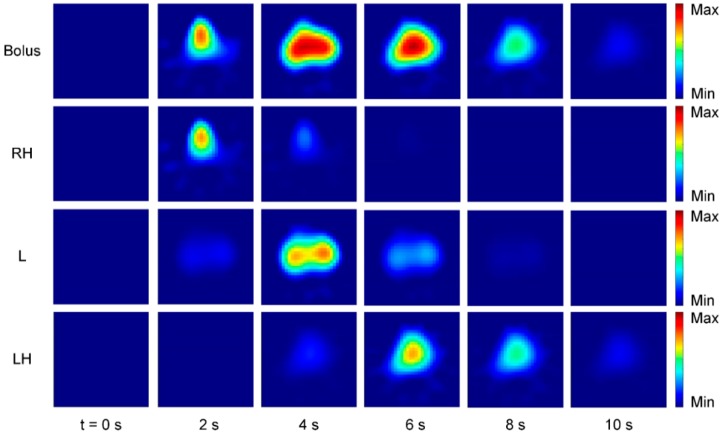
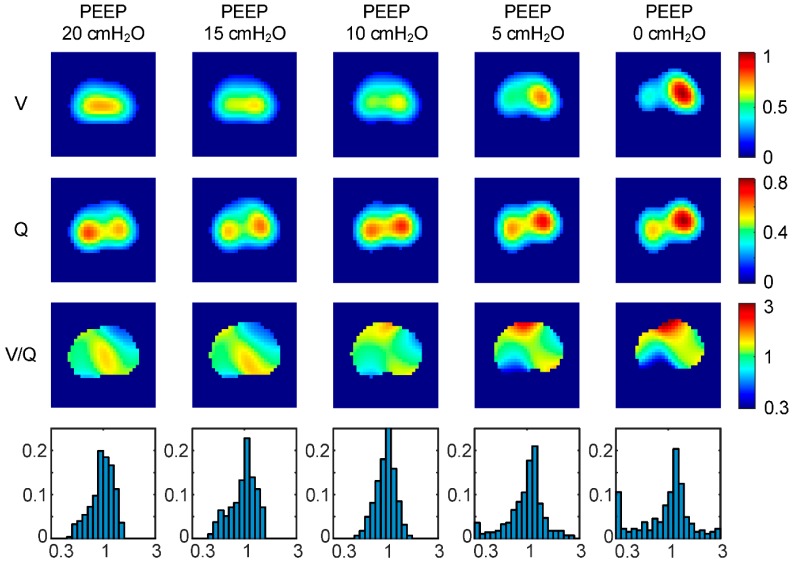
Electrical impedance tomography (EIT) is a bedside monitoring tool that noninvasively visualizes local ventilation and arguably lung perfusion distribution. This article reviews and discusses both methodological and clinical aspects of thoracic EIT. Initially, investigators addressed the validation of EIT to measure regional ventilation. Current studies focus mainly on its clinical applications to quantify lung collapse, tidal recruitment, and lung overdistension to titrate positive end-expiratory pressure (PEEP) and tidal volume. In addition, EIT may help to detect pneumothorax. Recent studies evaluated EIT as a tool to measure regional lung perfusion. Indicator-free EIT measurements might be sufficient to continuously measure cardiac stroke volume. The use of a contrast agent such as saline might be required to assess regional lung perfusion. As a result, EIT-based monitoring of regional ventilation and lung perfusion may visualize local ventilation and perfusion matching, which can be helpful in the treatment of patients with acute respiratory distress syndrome (ARDS).

Keywords: bioimpedance; electrical impedance tomography; image reconstruction; monitoring; regional perfusion; regional ventilation; thorax.


Conflict of interest statement

The authors declare no conflict of interest. The funders had no role in the design of the study; in the collection, analyses, or interpretation of data; in the writing of the manuscript, or in the decision to publish the results.

Figures

Figure 1
Figure 1
Current application and voltage measurements around the thorax using an EIT system with 16 electrodes. Within a few milliseconds, both the current electrodes and the active voltage electrodes are repeatedly rotated around the thorax.
Figure 2
Figure 2
Different available color codings of EIT images in comparison to the CT scan. The rainbow-color scheme uses red for the highest relative impedance (e.g., during inspiration), green for a medium relative impedance, and blue for the lowest relative impedance (e.g., during expiration). A newer color scales use instead black for no impedance change), blue for an intermediate impedance change, and white for the strongest impedance change.
Figure 3
Figure 3
EIT waveforms and functional EIT (fEIT) images are derived from the raw EIT images. EIT waveforms can be defined pixel-wise or on a region of interest (ROI). Conductivity changes result naturally from ventilation (VRS) or cardiac activity (CRS) but can also be induced artificially, e.g., by bolus injection (IBS) for perfusion measurement. fEIT images display regional physiological parameters, such as ventilation (V) and perfusion (Q), extracted from the raw EIT images using a mathematical operation over time.
Figure 4
Figure 4
Change in impedance (∆Impedance), change in end-expiratory lung impedance (∆EELI), regional respiratory system compliance (CRS), difference functional EIT (∆fEIT) images, and regional ventilation delay (RVD) are determined at different PEEP-levels. The ∆EELI images display the regional ∆EELI between the different positive end-expiratory pressure (PEEP) levels. Regional CRS is measured and visualized in fEIT image by dividing pixel-by-pixel tidal impedance variations by global driving pressure. The ΔfEIT images are created by subtracting fEIT before the PEEP step from fEIT after each PEEP step. The RVD shows regional temporal ventilation delay and thus the temporal ventilation heterogeneity caused by a change in PEEP.
Figure 5
Figure 5
Bolus injection and transport of contrast agent (NaCl 10%) through the cardio-pulmonary system. The bolus is injected at t = 0 s and transported from the right heart (RH) to the lung (L) into the left heart (LH). Separation of the bolus is achieved using gamma-variate model fitting.
Figure 6
Figure 6
Regional lung ventilation (V) and perfusion (Q) obtained by EIT using a contrast agent in a decremental PEEP trial. Homogeneity of the distribution of regional ventilation to perfusion ratio (V/Q) slightly increases from 20 to 10 cm H2O, whereas a strong homogeneity decrease is observed from 10 to 0 cm H2O.

References

    1. Leonhardt S., Lachmann B. Electrical impedance tomography: The holy grail of ventilation and perfusion monitoring? Intensive Care Med. 2012;38:1917–1929. doi: 10.1007/s00134-012-2684-z. - DOI - PubMed
    1. Frerichs I., Amato M.B.P., van Kaam A.H., Tingay D.G., Zhao Z., Grychtol B., Bodenstein M., Gagnon H., Böhm S.H., Teschner E., et al. Chest electrical impedance tomography examination, data analysis, terminology, clinical use and recommendations: Consensus statement of the TRanslational EIT developmeNt stuDy group. Thorax. 2017;72:83–93. doi: 10.1136/thoraxjnl-2016-208357. - DOI - PMC - PubMed
    1. Posada-Quintero H.F., Reljin N., Eaton-Robb C., Noh Y., Riistama J., Chon K.H. Analysis of Consistency of Transthoracic Bioimpedance Measurements Acquired with Dry Carbon Black PDMS Electrodes, Adhesive Electrodes, and Wet Textile Electrodes. Sensors. 2018;18:1719. doi: 10.3390/s18061719. - DOI - PMC - PubMed
    1. Khalil S.F., Mohktar M.S., Ibrahim F. The theory and fundamentals of bioimpedance analysis in clinical status monitoring and diagnosis of diseases. Sensors. 2014;14:10895–10928. doi: 10.3390/s140610895. - DOI - PMC - PubMed
    1. Karsten J., Stueber T., Voigt N., Teschner E., Heinze H. Influence of different electrode belt positions on electrical impedance tomography imaging of regional ventilation: A prospective observational study. Crit. Care. 2016;20:3. doi: 10.1186/s13054-015-1161-9. - DOI - PMC - PubMed