. 2019 Aug 7;10(8):244.
doi: 10.3390/insects10080244.

The Year of the Honey Bee (Apis mellifera L.) with Respect to Its Physiology and Immunity: A Search for Biochemical Markers of Longevity

Affiliations

The Year of the Honey Bee (Apis mellifera L.) with Respect to Its Physiology and Immunity: A Search for Biochemical Markers of Longevity

Martin Kunc et al. Insects. .

Abstract

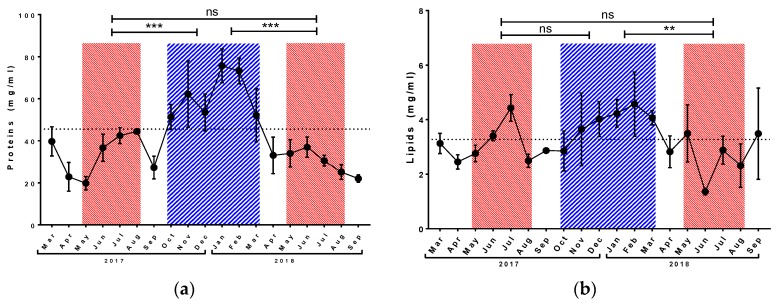
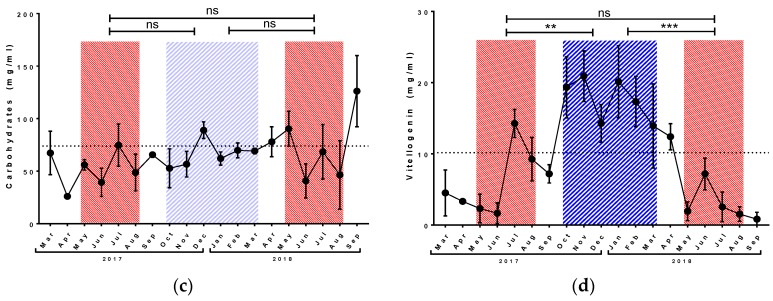
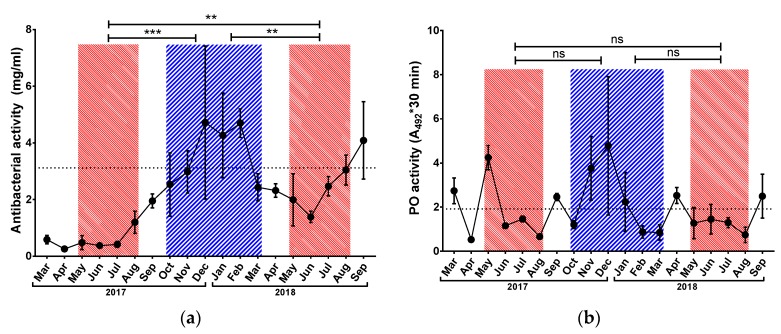
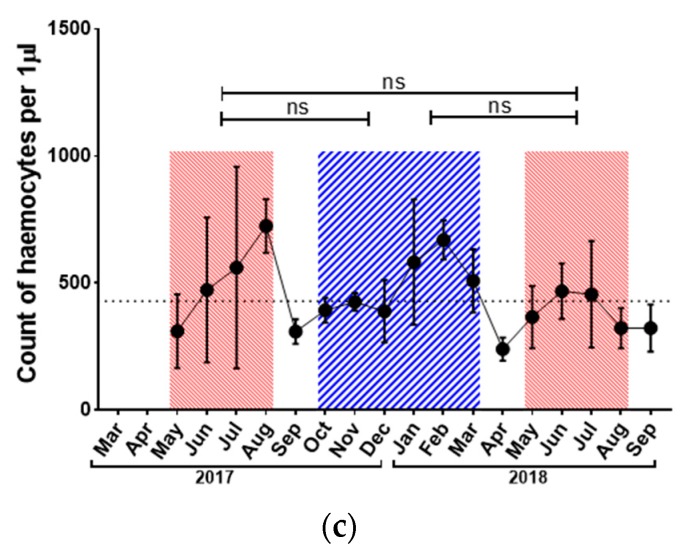
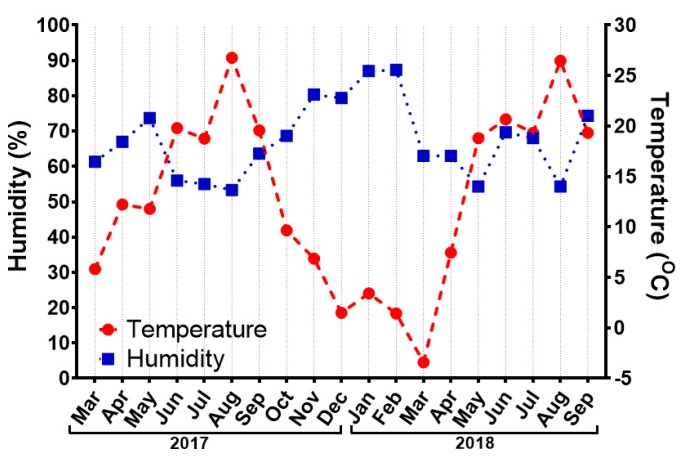
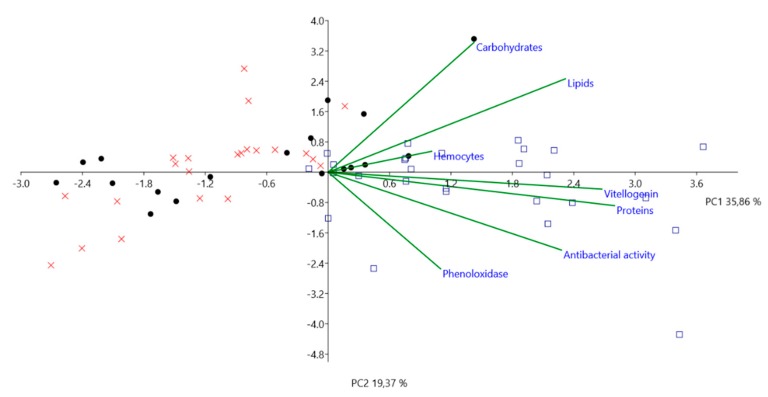
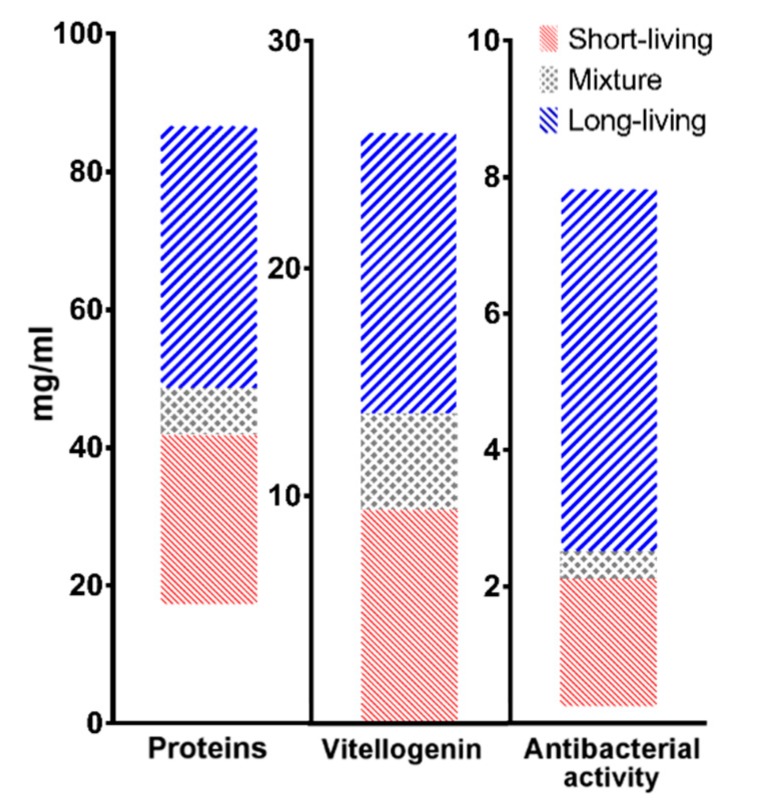
It has been known for many years that in temperate climates the European honey bee, Apis mellifera, exists in the form of two distinct populations within the year, short-living summer bees and long-living winter bees. However, there is only limited knowledge about the basic biochemical markers of winter and summer populations as yet. Nevertheless, the distinction between these two kinds of bees is becoming increasingly important as it can help beekeepers to estimate proportion of long-living bees in hives and therefore in part predict success of overwintering. To identify markers of winter generations, we employed the continuous long-term monitoring of a single honey bee colony for almost two years, which included measurements of physiological and immunological parameters. The results showed that the total concentration of proteins, the level of vitellogenin, and the antibacterial activity of haemolymph are the best three of all followed parameters that are related to honey bee longevity and can therefore be used as its markers.

Keywords: honey bee; immunity; longevity; physiology; seasonal changes.


Conflict of interest statement

The authors declare no conflicts of interest. The funders had no role in the design of the study; in the collection, analyses, or interpretation of data; in the writing of the manuscript, or in the decision to publish the results.

Figures

Figure 1
Figure 1
Seasonal development of total protein (a), lipid (b), and carbohydrate (c) concentration and level of vitellogenin (d) in honey bee haemolymph. Red striped areas indicate summer generations of honey bees (May–August), and blue area indicates winter generations (October–March). Dots represent mean ± SD, n = 3–5. Dotted line represents annual average (October 2017–September 2018). Asterisk indicates significant difference ** p < 0.01, *** p < 0.001, ns = not significant.
Figure 1
Figure 1
Seasonal development of total protein (a), lipid (b), and carbohydrate (c) concentration and level of vitellogenin (d) in honey bee haemolymph. Red striped areas indicate summer generations of honey bees (May–August), and blue area indicates winter generations (October–March). Dots represent mean ± SD, n = 3–5. Dotted line represents annual average (October 2017–September 2018). Asterisk indicates significant difference ** p < 0.01, *** p < 0.001, ns = not significant.
Figure 2
Figure 2
Seasonal development of antibacterial activity (a), the activity of phenoloxidase (b) and haemocytes counts (c) in honey bee haemolymph. Red striped areas indicate summer generations of honey bees (May–August), and blue area indicates winter generation (October–March). Dots represent mean ± SD, n = 3–5. Dotted line represents annual average (October 2017–September 2018). Asterisk indicates significant difference ** p < 0.01, *** p < 0.001, ns = not significant.
Figure 2
Figure 2
Seasonal development of antibacterial activity (a), the activity of phenoloxidase (b) and haemocytes counts (c) in honey bee haemolymph. Red striped areas indicate summer generations of honey bees (May–August), and blue area indicates winter generation (October–March). Dots represent mean ± SD, n = 3–5. Dotted line represents annual average (October 2017–September 2018). Asterisk indicates significant difference ** p < 0.01, *** p < 0.001, ns = not significant.
Figure 3
Figure 3
Changes in humidity (blue squares, left y-axis) and temperature (red dots, right y-axis) at the location of the apiary where honey bees were collected. Each point represents the mean value of measurements three days before the collection and on the day of collection.
Figure 4
Figure 4
Principal component analysis of variances (proteins, lipids, carbohydrates, vitellogenin, antibacterial activity, phenoloxidase, and haemocytes). Component 1 (PC1) depicted as the x-axis explains 35.86% of sample variability. Component 2 (PC2) depicted as the y-axis explains 19.37% of sample variability. Black dots, red crosses, and blue squares represent values for summer 2017, summer 2018, and winter 2017/2018, respectively. Green lines express the extent to which each variable contributes to the explanation of the differences.
Figure 5
Figure 5
Graphical depiction of proposed physiological ranges in protein, vitellogenin, and antimicrobial level for each season. Red, blue, and grey areas represent short-living, long-living, and mixed populations, respectively.

References

    1. Klatt B.K., Holzschuh A., Westphal C., Clough Y., Smit I., Pawelzik E., Tscharntke T. Bee pollination improves crop quality, shelf life and commercial value. Proc. R. Soc. B Biol. Sci. 2013;281:20132440. doi: 10.1098/rspb.2013.2440. - DOI - PMC - PubMed
    1. Klein A.M., Vaissière B.E., Cane J.H., Steffan-Dewenter I., Cunningham S.A., Kremen C., Tscharntke T. Importance of pollinators in changing landscapes for world crops. Proc. R. Soc. B Biol. Sci. 2007;274:303–313. doi: 10.1098/rspb.2006.3721. - DOI - PMC - PubMed
    1. Potts S.G., Biesmeijer J.C., Kremen C., Neumann P., Schweiger O., Kunin W.E. Global pollinator declines: Trends, impacts and drivers. Trends Ecol. Evol. 2010;25:345–353. doi: 10.1016/j.tree.2010.01.007. - DOI - PubMed
    1. Steinhauer N., Kulhanek K., Antúnez K., Human H., Chantawannakul P., Chauzat M.P., vanEngelsdorp D. Drivers of colony losses. Curr. Opin. Insect Sci. 2018;26:142–148. doi: 10.1016/j.cois.2018.02.004. - DOI - PubMed
    1. Williams G.R., Tarpy D.R., VanEngelsdorp D., Chauzat M.P., Cox-Foster D.L., Delaplane K.S., Neumann P., Pettis J.S., Rogers R.E.L., Shutler D. Colony collapse disorder in context. BioEssays. 2010;32:845–846. doi: 10.1002/bies.201000075. - DOI - PMC - PubMed

LinkOut - more resources