. 2019 Aug 7;16(16):2820.
doi: 10.3390/ijerph16162820.

Understanding the Spatial-Temporal Patterns and Influential Factors on Air Quality Index: The Case of North China

Affiliations

Understanding the Spatial-Temporal Patterns and Influential Factors on Air Quality Index: The Case of North China

Wenxuan Xu et al. Int J Environ Res Public Health. .

Abstract

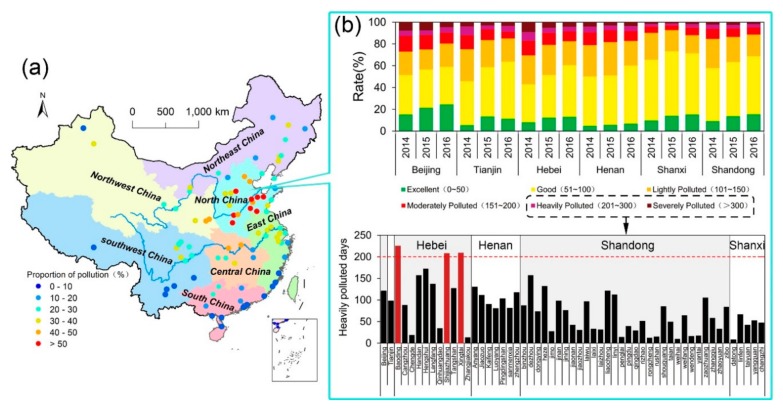
North China has become one of the worst air quality regions in China and the world. Based on the daily air quality index (AQI) monitoring data in 96 cities from 2014-2016, the spatiotemporal patterns of AQI in North China were investigated, then the influence of meteorological and socio-economic factors on AQI was discussed by statistical analysis and ESDA-GWR (exploratory spatial data analysis-geographically weighted regression) model. The principal results are as follows: (1) The average annual AQI from 2014-2016 exceeded or were close to the Grade II standard of Chinese Ambient Air Quality (CAAQ), although the area experiencing heavy pollution decreased. Meanwhile, the positive spatial autocorrelation of AQI was enhanced in the sample period. (2) The occurrence of a distinct seasonal cycle in air pollution which exhibit a sinusoidal pattern of fluctuations and can be described as "heavy winter and light summer." Although the AQI generally decreased in other seasons, the air pollution intensity increased in winter with the rapid expansion of higher AQI value in the southern of Hebei and Shanxi. (3) The correlation analysis of daily meteorological factors and AQI shows that air quality can be significantly improved when daily precipitation exceeds 10 mm. In addition, except for O3, wind speed has a negative correlation with AQI and major pollutants, which was most significant in winter. Meanwhile, pollutants are transmitted dynamically under the influence of the prevailing wind direction, which can result in the relocation of AQI. (4) According to ESDA-GWR analysis, on an annual scale, car ownership and industrial production are positively correlated with air pollution; whereas increase of wind speed, per capita gross domestic product (GDP), and forest coverage are conducive to reducing pollution. Local coefficients show spatial differences in the effects of different factors on the AQI. Empirical results of this study are helpful for the government departments to formulate regionally differentiated governance policies regarding air pollution.

Keywords: AQI; GWR; North China; influencing factors; spatiotemporal analysis.


Conflict of interest statement

The authors declare no conflict of interest.

Figures

Figure 1
Figure 1
Distribution of air quality monitoring stations in the study area. Inset map shows the location of the study area in China.
Figure 2
Figure 2
Proportions of different categories of air pollution for cities in China (2014–2016). (a) The AQI in North China is the highest in the country and is much higher than elsewhere in China. (b) The composition of AQI for each province in North China.
Figure 3
Figure 3
Spatial variation of AQI in North China from 2014 to 2016; (ac) the color bars on the right of each subgraph represent the raster proportion of each AQI interval in each year; (d) the core area of air pollution, which was extracted using the Iterative Self-Organizing Data Analysis Technique (ISODATA), located to the south of Yanshan Mountains, west of Taihang Mountains and east of Shandong Peninsula.
Figure 4
Figure 4
Daily and monthly average values of AQI for the cities of North China (2014–2016).
Figure 5
Figure 5
(a) Isograms of wavelet coefficients of AQI for four regions of North China. The abscissa is the local time (month) and the ordinate is the wavelet scale (in days). (b) and (c) are wavelet variance curves and wavelet coefficient curves of AQI of the four regions.
Figure 6
Figure 6
Seasonal spatial distribution matrix of AQI in North China (2014–2016).
Figure 7
Figure 7
(ac) Scatter plots of Global Moran Index (GMI) and local index of spatial association (LISA) agglomeration in North China (2014–2016). The abscissa represents the standardized AQI in cities and the ordinate represents the space lag vector which is the neighboring AQI as determined by the spatial weight weighting matrix. The GMI scatter plots are divided into four quadrants including H-H (upper right), L-L (lower left), H-L (lower right), and L-H (upper left).
Figure 8
Figure 8
The influence of precipitation on air quality. There were 1297 rainy days in the six provincial capitals during 2014 and 2016, with light rain (0–10 mm) accounting for 78.3% of the total.
Figure 9
Figure 9
Pearson correlation coefficient of urban wind speed and AQI in different seasons for capital cities in North China. The white rectangle indicates failed passed the significance test. BJ, TJ, SJZ, JN, ZZ, TY are the abbreviation of Beijing, Tianjin, Shijiazhuang, Jinan, Zhengzhou and Taiyuan, respectively.
Figure 10
Figure 10
(ad) Spatial distribution of AQI and overlay of the near ground wind field in North China from December 2015 to March 2016, and (e) shows wind roses showing the trajectory of maximum wind speed of major cities of North China from December 2015 to March 2016. The wind field data is derived from the National Centers for Environmental Prediction (NCEP) reanalysis data with a resolution of 2.5° × 2.5° (ftp://ftp.cdc.noaa.gov/Datasets/).
Figure 11
Figure 11
Results of the geographically weighted regression (GWR) in 58 cities. (a) Local R2 of GWR. (b) Local coefficients of civil vehicle number. (c) Local coefficients of industrial structure. (d) Local coefficients of wind speed. (e) Local coefficients of forest coverage. (f) Local coefficients of per capita gross domestic product (GDP).

References

    1. Usman M., Ma Z., Wasif Zafar M., Haseeb A., Ashraf R.U. Are Air Pollution, Economic and Non-Economic Factors Associated with Per Capita Health Expenditures? Evidence from Emerging Economies. Int. J. Environ. Res. Public Health. 2019;16:1967. doi: 10.3390/ijerph16111967. - DOI - PMC - PubMed
    1. Lin G., Fu J., Jiang D., Hu W., Dong D., Huang Y., Zhao M. Spatio-Temporal Variation of PM2.5 Concentrations and Their Relationship with Geographic and Socioeconomic Factors in China. Int. J. Environ. Res. Public Health. 2014;11:173–186. doi: 10.3390/ijerph110100173. - DOI - PMC - PubMed
    1. Xu W., Sun J., Liu Y., Xiao Y., Tian Y., Zhao B., Zhang X. Spatiotemporal variation and socioeconomic drivers of air pollution in China during 2005–2016. J. Environ. Manag. 2019;245:66–75. doi: 10.1016/j.jenvman.2019.05.041. - DOI - PubMed
    1. Tian Y., Jiang Y., Liu Q., Xu D., Zhao S., He L., Liu H., Xu H. Temporal and spatial trends in air quality in Beijing. Landsc. Urban Plan. 2019;185:35–43. doi: 10.1016/j.landurbplan.2019.01.006. - DOI
    1. Halkos G., Tsilika K. Understanding transboundary air pollution network: Emissions, depositions and spatio-temporal distribution of pollution in European region. Resour. Conserv. Recycl. 2019;145:113–123. doi: 10.1016/j.resconrec.2019.02.014. - DOI

Publication types