. 2019 Sep 2;218(9):2919-2944.
doi: 10.1083/jcb.201902117. Epub 2019 Aug 8.

Chromatin compartment dynamics in a haploinsufficient model of cardiac laminopathy

Affiliations

Chromatin compartment dynamics in a haploinsufficient model of cardiac laminopathy

Alessandro Bertero et al. J Cell Biol. .

Abstract

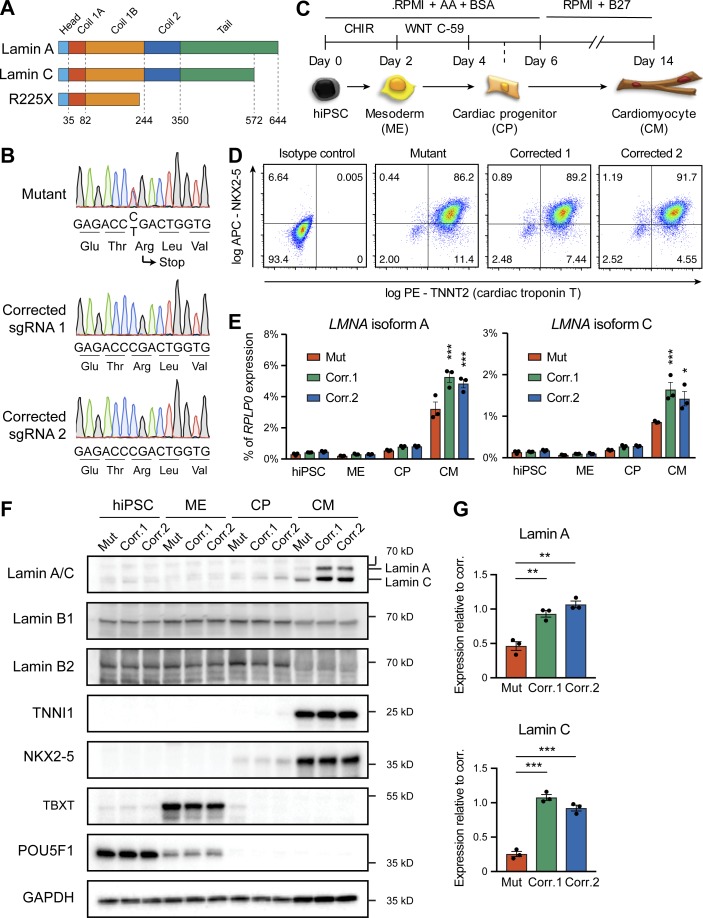
Mutations in A-type nuclear lamins cause dilated cardiomyopathy, which is postulated to result from dysregulated gene expression due to changes in chromatin organization into active and inactive compartments. To test this, we performed genome-wide chromosome conformation analyses in human induced pluripotent stem cell-derived cardiomyocytes (hiPSC-CMs) with a haploinsufficient mutation for lamin A/C. Compared with gene-corrected cells, mutant hiPSC-CMs have marked electrophysiological and contractile alterations, with modest gene expression changes. While large-scale changes in chromosomal topology are evident, differences in chromatin compartmentalization are limited to a few hotspots that escape segregation to the nuclear lamina and inactivation during cardiogenesis. These regions exhibit up-regulation of multiple noncardiac genes including CACNA1A, encoding for neuronal P/Q-type calcium channels. Pharmacological inhibition of the resulting current partially mitigates the electrical alterations. However, chromatin compartment changes do not explain most gene expression alterations in mutant hiPSC-CMs. Thus, global errors in chromosomal compartmentation are not the primary pathogenic mechanism in heart failure due to lamin A/C haploinsufficiency.


Figures

Figure 1.
Figure 1.
Generation of lamin A/C haploinsufficient hiPSC-CMs. (A) Predicted effect of the LMNA R225X mutation on the two splicing products lamin A and C. (B) Sanger sequencing of LMNA exon 4 in hiPSCs with heterozygous R225X mutation (top), or in hiPSCs obtained after CRISPR/Cas9-based scarless correction of the mutation (bottom). (C) Schematic of the protocol for step-wise directed differentiation of hiPSC-CMs. CHIR, CHIR-99021; AA, ascorbic acid. (D) Quantification of cardiac differentiation efficiency by flow cytometry for TNNT2 and NKX2-5 on hiPSC-CMs at day 14 of differentiation. (E) RT-qPCR analyses at the indicated stages of hiPSC-CM differentiation (see panel C). Differences versus mutant were calculated by two-way ANOVA with post hoc Holm–Sidak binary comparisons (*, P < 0.05; ***, P < 0.001; n = 3 differentiations; average ± SEM). (F) Representative Western blot for A- and B-type lamins and differentiation markers during iPSC-CM differentiation. (G) Quantification of lamin A/C expression in hiPSC-CMs from Western blot densitometries. Differences versus mutant were calculated by one-way ANOVA with post hoc Holm–Sidak binary comparisons (**, P < 0.01; ***, P < 0.001; n = 3 differentiations; average ± SEM). Throughout the figure (and in all other figures), Mut or Mutant indicates LMNA R225X hiPSCs, and Corr.1/2 or Corrected 1/2 indicates the two isogenic corrected control LMNA R225R hiPSC lines.
Figure 2.
Figure 2.
Electrophysiological properties of lamin A/C haploinsufficient hiPSC-CMs. (A) Representative traces from MEA recordings of spontaneous electrical activity in hiPSC-CM monolayers. (B) Representative quantifications of electrophysiological properties from MEA analyses. Differences versus mutant were calculated by one-way ANOVA with post hoc Holm–Sidak binary comparisons (**, P < 0.01; ***, P < 0.001; n = 5–16 wells; average ± SEM). (C) Representative voltage recordings by whole-cell patch clamp during evoked action potentials in individual hiPSC-CMs. (D) Quantifications of electrophysiological properties from whole-cell patch clamp analyses (APD90, action potential duration at 90% repolarization). Differences versus mutant were calculated by one-way ANOVA with post hoc Holm–Sidak binary comparisons (*, P < 0.05; **, P < 0.01; ***, P < 0.001; n = 26–30 cells from two differentiations; average ± SEM). (E) Representative optical recordings of calcium fluxes with Fluo-4 in hiPSC-CM monolayers electrically paced at 1 Hz (Fmax, peak fluorescence; F0, baseline fluorescence). (F) Representative quantifications of calcium fluxes properties. Differences versus mutant were calculated by unpaired t test (***, P < 0.001; n = 69–70 cells; average ± SEM).
Figure 3.
Figure 3.
Contractile properties of lamin A/C haploinsufficient hiPSC-CMs. (A) Representative measurements of cellular displacement during contraction of hiPSC-CM monolayers electrically paced at 1 Hz. (B) Representative quantifications of cell contractility from analyses of optical recordings. Differences versus mutant were calculated by one-way ANOVA with post hoc Holm–Sidak binary comparisons (*, P < 0.05; n = 5–6 FOVs; average ± SEM). (C) Representative measurements of twitch force during contraction of 3D-EHTs electrically paced at 1 Hz. (D) Representative quantifications of tissue contractility from analyses of optical recordings. Differences versus mutant were calculated by one-way ANOVA with post hoc Holm–Sidak binary comparisons (*, P < 0.05; **, P < 0.01; ***, P < 0.001; n = 4–5 3D-EHTs; average ± SEM).
Figure 4.
Figure 4.
Gene expression changes in lamin A/C haploinsufficient hiPSC-CMs. (A) RT-qPCR analyses in hiPSC-CMs at day 14 of differentiation. Differences versus mutant were calculated by one-way ANOVA with post hoc Holm–Sidak binary comparisons (*, P < 0.05; n = 3 differentiations; average ± SEM). (B) Hierarchical clustering of hiPSC-CMs analyzed by RNA-seq based on all expressed genes. r, replicate. (C) Overlap in genes up- or down-regulated in mutant hiPSC-CMs versus hiPSC-CMs from the two corrected control lines (change greater than twofold and q-value <0.05; Table S2). (D) Selected results from gene ontology (GO) and pathway enrichment analyses of genes consistently up- or down-regulation in mutant hiPSC-CMs. KEGG, Kyoto Encyclopedia of Genes and Genomes. (E) Linear dimensionality reduction by principal component (PC) analysis of RNA-seq data of mutant and corrected hiPSC-CMs, and hESC-CMs sampled at different time points of differentiation.
Figure 5.
Figure 5.
Global properties of chromatin topology in lamin A/C haploinsufficient hiPSC-CMs. (A) Hierarchical clustering of hiPSC-CMs analyzed by in situ DNase Hi-C based on similarity scores between the genomic contact matrices calculated with HiCRep. (B) Proportion of trans or cis interactions involving distances <20 kb (cis short) or >20 kb (cis long; Table S4). Differences versus mutant were calculated by two-way ANOVA with post hoc Holm–Sidak binary comparisons (*, P < 0.05; n = 2 differentiations; average ± SEM). (C) Representative heatmaps of differential contact matrices between autosomes (ordered by size). (D) Representative heatmaps of differential cis interactions between A and B compartments. (E) Probability of cis genomic contacts over increasing genomic distance for regions in homotypic (A-A or B-B) or heterotypic (A-B) chromatin compartments (gray background: 95% confidence bands). obs/exp, observed/expected.
Figure 6.
Figure 6.
Chromatin compartment transitions in lamin A/C haploinsufficient hiPSC-CMs. (A) Heatmap of all significantly different A/B compartment scores (Hi-C matrix PC1; P < 0.05 by one-way ANOVA; n = 2 differentiations; Table S5) in 500-kb bins that changed PC1 sign between two or more conditions. Positive and negative PC1 indicate A and B compartmentalization, respectively. (B) Representative log-transformed contact probability maps for chromosome 19. TADs are visible as squares along the diagonal. TADs within the same compartment interact off the diagonal as indicated by the symmetrical checkerboard patterns. Two genomic regions that show different compartmentalization in mutant hiPSC-CMs are indicated by dashed boxes to highlight the differences in contact probabilities with other genomic regions off the diagonal. (C) Linear dimensionality reduction by principal component (PC) analysis of A/B compartment scores from Hi-C data of mutant and corrected hiPSC-CMs, and hESC-CMs sampled at different time points of differentiation. (D) Significance of the overlap between changes in A/B compartments in mutant hiPSC-CMs and those occurring during hESC-CM differentiation. The number of genomic bins within each of the categories is indicated, and P values were calculated by χ2 tests. (E) Representative genomic tracks of chromatin compartmentalization for chromosome 19 and a section of chromosome 5. Positive and negative Hi-C matrix PC1 scores are shown in red and blue, and indicate 500-kb genomic bins in the A and B compartments, respectively. Genomic regions that transition from A to B during hESC-CM differentiation but remain in A in mutant hiPSC-CMs (noted as B to A) are indicated by dashed boxes. Selected genes found within such regions are listed (refer to Fig. 8 and Fig. S5).
Figure 7.
Figure 7.
Alterations in peripheral localization of lamin A/C–sensitive loci. (A) Representative immunoFISH for the nuclear lamina (lamin B1), the cardiac marker α-actinin, and the CACNA1C locus in mutant and corrected hiPSCs and hiPSC-CM (nuclei counterstained with DAPI). Scale bars, 5 µm. (B) Quantification of the distance between the indicated loci and the nuclear lamina in diploid cells based on immunoFISH data. Violin plots report the whole range, and horizontal lines indicate the first quartile, median, and third quartile. Statistical analysis by Brown–Forsythe and Welch ANOVA test followed by the Holm–Sidak multiple comparisons versus hiPSC for the same line or versus mutant, as indicated (*, P < 0.05; **, P < 0.01; ***, P < 0.001; n = individual loci, as indicated). (C) As in Fig. 6 E, but reporting chromatin compartmentalization changes for two genomic regions not affected by lamin A/C haploinsufficiency and used as negative control for immunoFISH experiments (B).
Figure 8.
Figure 8.
Correlation between altered chromatin compartmentalization and gene expression changes in lamin A/C haploinsufficient hiPSC-CMs. (A) Violin plots showing the expression of genes found with lamin A/C–sensitive domains. Boxplots indicate the first quartile, median, and third quartile, while whiskers are from the 5th to 95th percentiles. In the left panel, note that the tail of genes expressed at very low levels in corrected hiPSC-CMs is less pronounced in mutant cells. (B) Selected results from ontology enrichment analyses of up-regulated genes in domains aberrantly found in the A compartment in mutant hiPSC-CMs (average fold-change greater than two; Fig. S5 C). (C and D) RT-qPCR validation of gene expression changes in hiPSC-CMs matured by culture in vitro for 30 d (C) or by generation of 3D-EHTs (D). Differences versus mutant were calculated by one-way ANOVA with post hoc Holm–Sidak binary comparisons (*, P < 0.05; **, P < 0.01; n = 4 differentiations for panel C, and n = 3 3D-EHT batches for panel D; average ± SEM). RPKM, read kilobase per million mapped reads.
Figure 9.
Figure 9.
Role of P/Q- and L-type calcium currents in electrophysiological abnormalities of lamin A/C haploinsufficient hiPSC-CMs. (A and B) Representative quantifications of electrophysiological properties from MEA analyses in standard culture conditions or after treatment with the indicated inhibitors for P/Q-type calcium channels (ω-conotoxin MVIIC: 2 µM; ω-agatoxin TK: 0.5 µM). Differences versus mutant were calculated by one-way ANOVA with post hoc Holm–Sidak binary comparisons (*, P < 0.05; **, P < 0.01; n = 3–8 wells; average ± SEM). (C and D) RT-qPCR validation of gene expression changes in hiPSC-CMs matured by culture in vitro for 30 d (C) or by generation of 3D-EHTs (D). Differences versus mutant were calculated by one-way ANOVA with post hoc Holm–Sidak binary comparisons (*, P < 0.05; **, P < 0.01; ***, P < 0.001; n = 4 differentiations for panel C, and n = 3 3D-EHT batches for panel D; average ± SEM). (E) As in panels A and B, but hiPSC-CMs were treated with increasing doses of the L-type calcium channel blocker verapamil (*, P < 0.05; ***, P < 0.001; n = 1–4 wells; average ± SEM).
Figure 10.
Figure 10.
Proposed model for the chromatin compartmentalization–dependent and –independent effects of lamin A/C haploinsufficieny in developing hiPSC-CMs. Compartmentalization and pheripheral localization of few genomic hotspots is dysregulated (exemplified by the magenta and green loci), while a large number of genes are dysregulated independently of chromatin compartment changes (exemplified by the red locus).

Comment in

References

    1. Adams M.E., Mintz I.M., Reily M.D., Thanabal V., and Bean B.P.. 1993. Structure and properties of omega-agatoxin IVB, a new antagonist of P-type calcium channels. Mol. Pharmacol. 44:681–688. - PubMed
    1. Adriaens C., Serebryannyy L.A., Feric M., Schibler A., Meaburn K.J., Kubben N., Trzaskoma P., Shachar S., Vidak S., Finn E.H., et al. 2018. Blank spots on the map: some current questions on nuclear organization and genome architecture. Histochem. Cell Biol. 150:579–592. 10.1007/s00418-018-1726-1 - DOI - PMC - PubMed
    1. Akinrinade O., Ollila L., Vattulainen S., Tallila J., Gentile M., Salmenpera P., Koillinen H., Kaartinen M., Nieminen M.S., Myllykangas S., et al. 2015. Genetics and genotype-phenotype correlations in Finnish patients with dilated cardiomyopathy. Eur. Heart J. 36:2327–2337. 10.1093/eurheartj/ehv253 - DOI - PMC - PubMed
    1. Amendola M., and van Steensel B.. 2015. Nuclear lamins are not required for lamina-associated domain organization in mouse embryonic stem cells. EMBO Rep. 16:610–617. 10.15252/embr.201439789 - DOI - PMC - PubMed
    1. Amin A.S., Tan H.L., and Wilde A.A.M.. 2010. Cardiac ion channels in health and disease. Heart Rhythm. 7:117–126. 10.1016/j.hrthm.2009.08.005 - DOI - PubMed

Publication types

MeSH terms