. 2019 Oct 4;294(40):14661-14673.
doi: 10.1074/jbc.RA118.007110. Epub 2019 Aug 8.

The N-terminal region of RTP1S plays important roles in dimer formation and odorant receptor-trafficking

Affiliations

The N-terminal region of RTP1S plays important roles in dimer formation and odorant receptor-trafficking

Yosuke Fukutani et al. J Biol Chem. .

Abstract

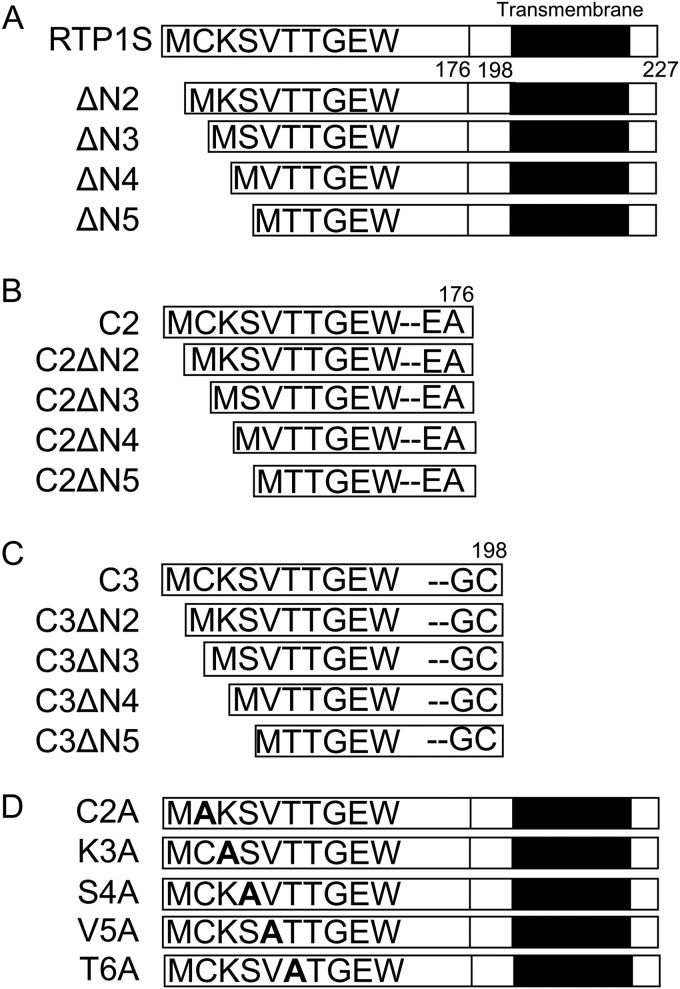
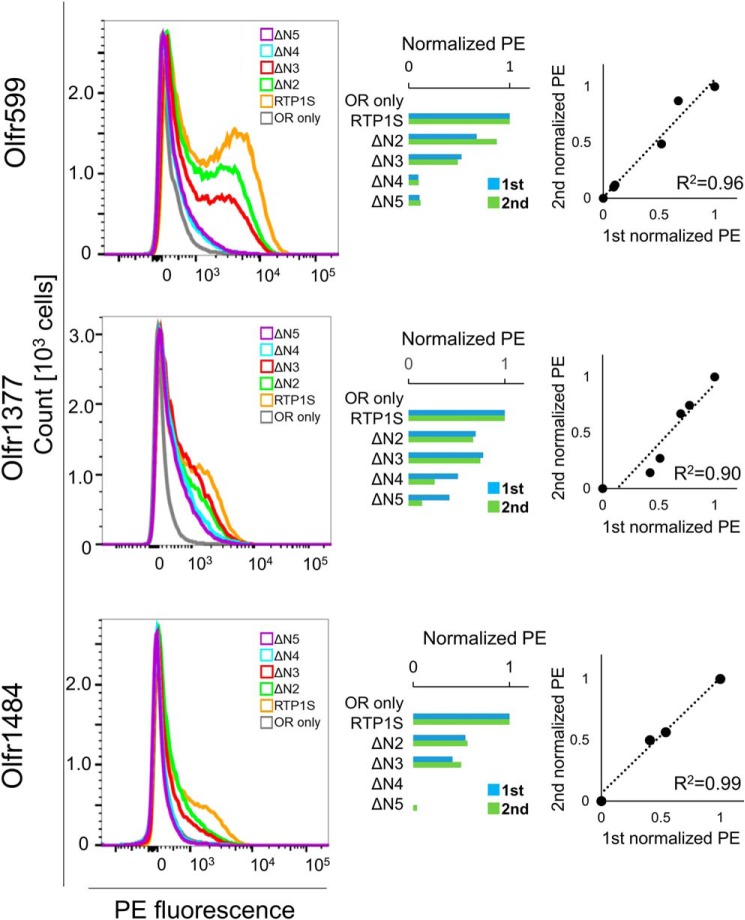
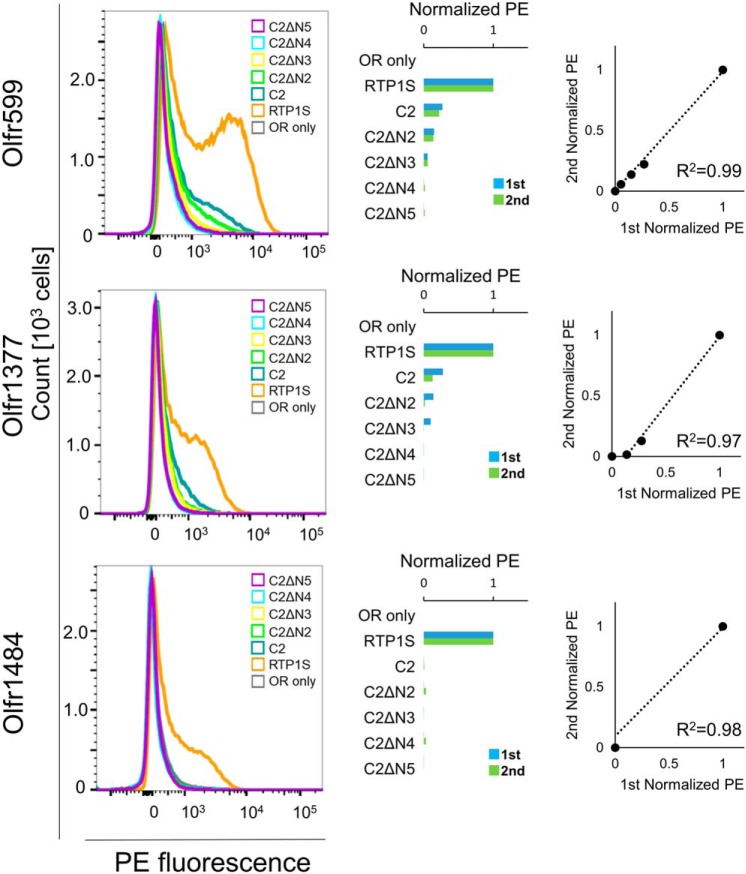
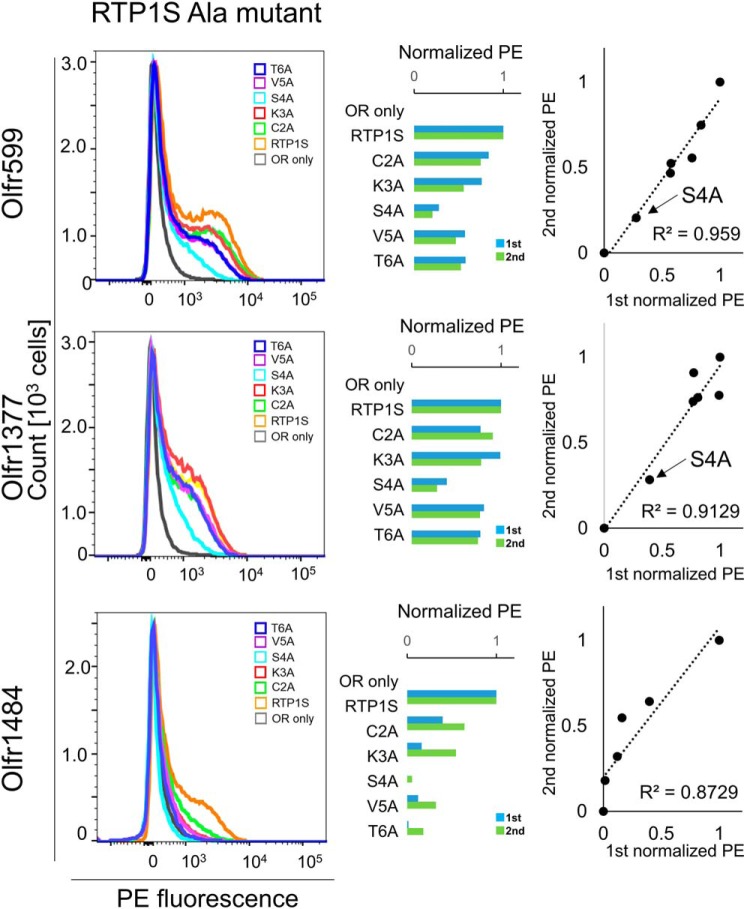
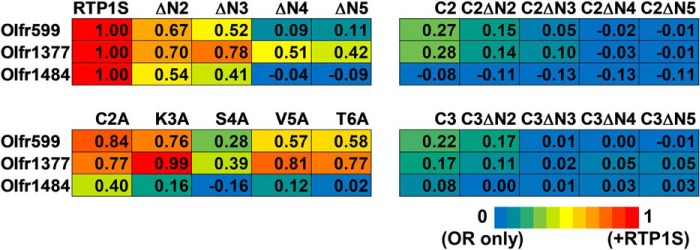
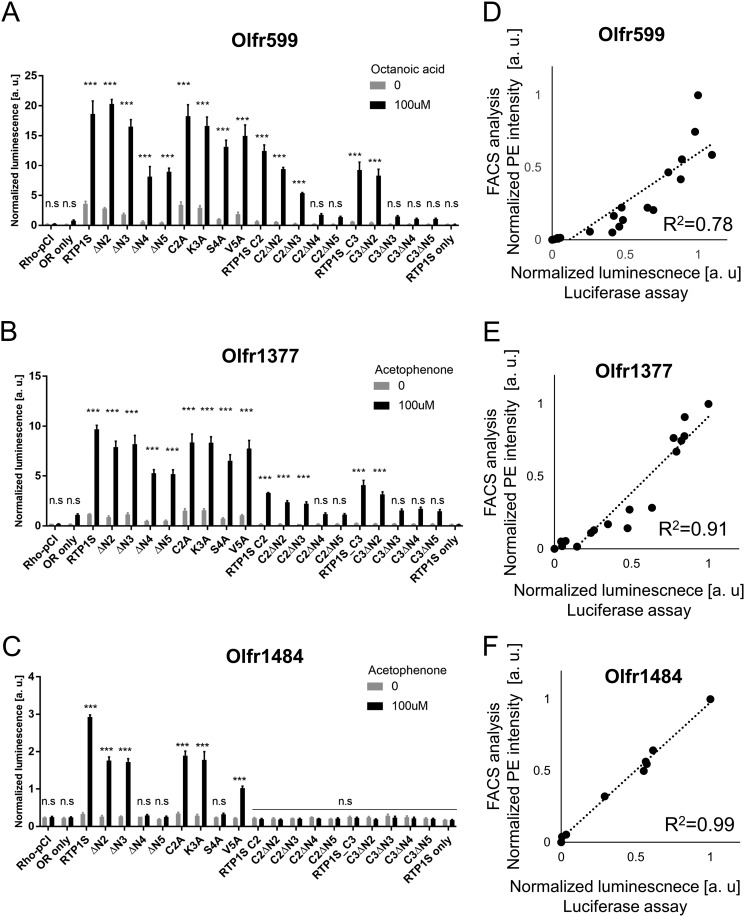
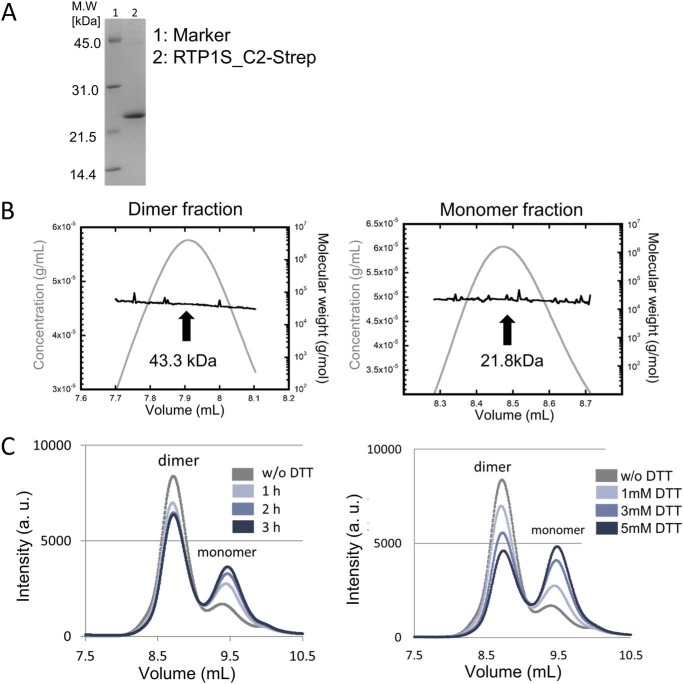
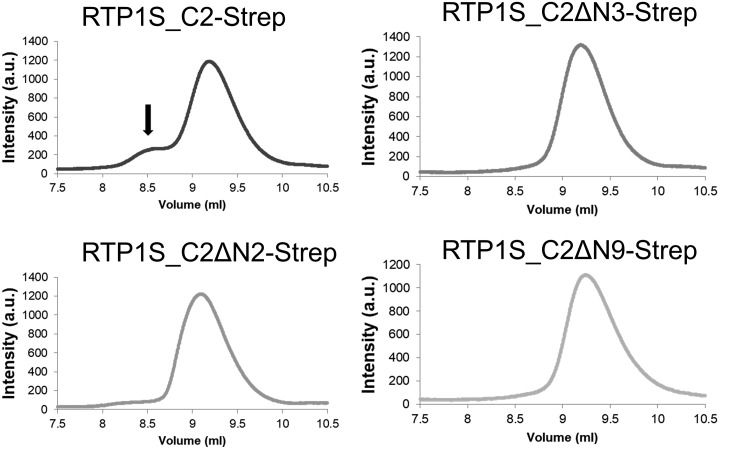
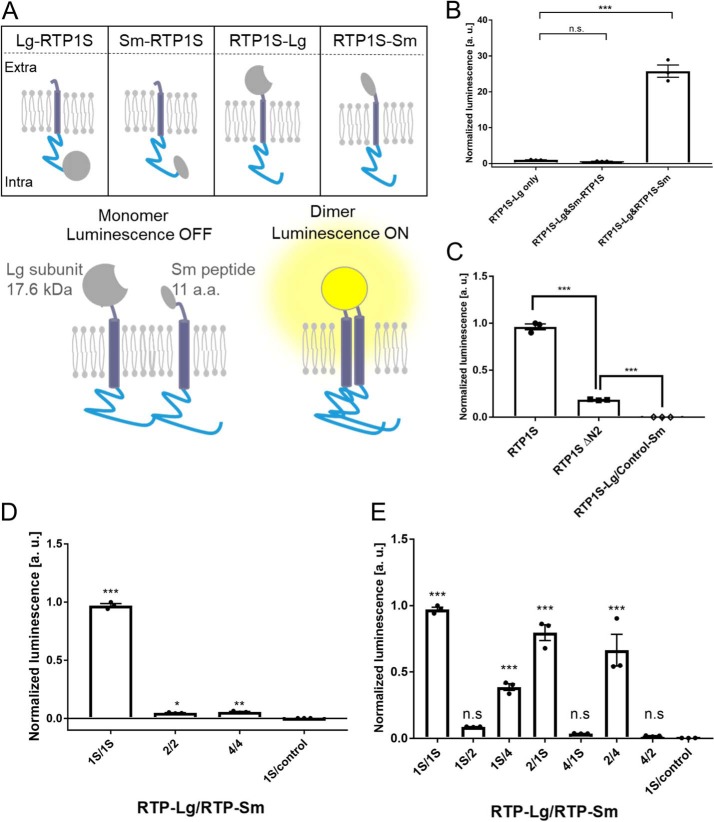
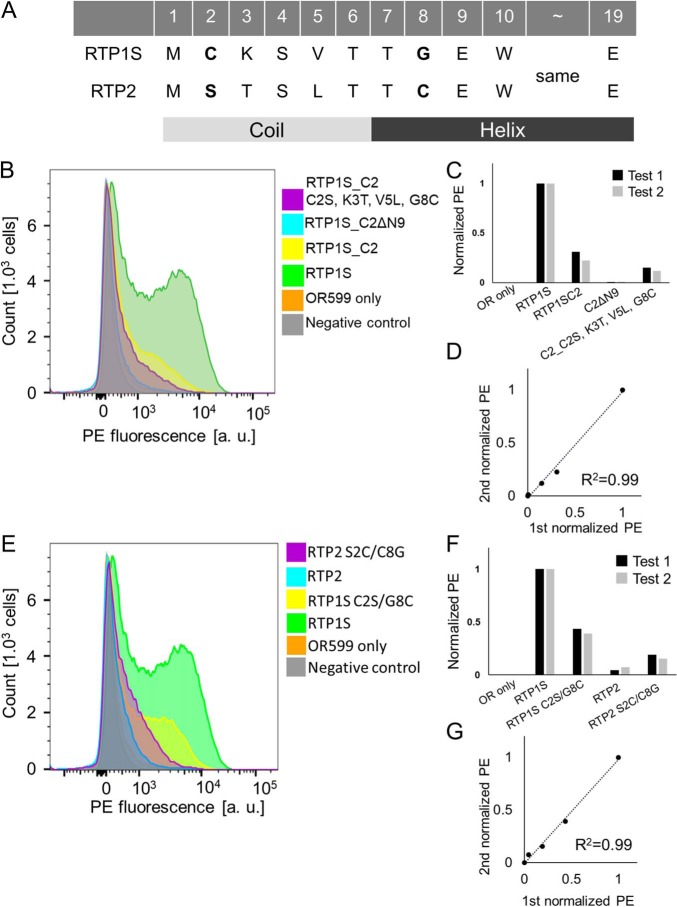
Receptor-transporting protein 1S (RTP1S) is an accessory protein that mediates the transport of mammalian odorant receptors (ORs) into the plasma membrane. Although most ORs fail to localize to the cell surface when expressed alone in nonolfactory cells, functional expression of ORs is achieved with the coexpression of RTP1S. However, the mechanism for RTP1S-mediated OR trafficking remains unclear. In this study, we attempted to reveal the mode of action and critical residues of RTP1S in OR trafficking. Experiments using N-terminal truncation and Ala substitution mutants of RTP1S demonstrated that four N-terminal amino acids have essential roles in OR trafficking. Additionally, using recombinant proteins and split luciferase assays in mammalian cells, we provided evidence for the dimer formation of RTP1S. Furthermore, we determined that the 2nd Cys residue is required for the efficient dimerization of RTP1S. Altogether, these findings provide insights into the mechanism for plasma membrane transport of ORs by RTP1S.

Keywords: G-protein–coupled receptor (GPCR); dimerization; flow cytometry; membrane transport; molecular chaperone; odorant receptors; receptor-transporting protein.


Conflict of interest statement

The authors declare that they have no conflicts of interest with the contents of this article

Figures

Figure 1.
Figure 1.
Diagram of the RTP1S variants used in this study. N-terminal truncation of RTP1S (A), RTP1S_C2 (B), and RTP1S_C3 (C) is shown. The N-terminal Ala replacement mutants of RTP1S is shown (D). The TM domain is shown as a black bar.
Figure 2.
Figure 2.
Cell-surface expression of the Rho-tagged ORs cotransfected with the RTP1S N-terminal truncation mutants. Each combination of mutant RTP1s and ORs (Olfr599, Olfr1377, and Olfr1484) was transfected into HEK293T cells, and the cell-surface expression level was measured. The results from two independent experiments are shown in each graph. x axis, PE fluorescence; y axis, cell number. The geometric mean of PE fluorescence of each measurement was used for comparison. The values of RTP1S and OR only were used as positive (= 1) and negative controls (= 0), respectively. Comparison of the normalized response was by different experiments. R2 values were calculated by Pearson's correlation coefficient from the linear regression analysis.
Figure 3.
Figure 3.
Cell-surface expression of the Rho-tagged ORs cotransfected with the N-terminal truncation mutants of RTP1S_C2. Each combination of mutant of RTP1_C2s and ORs (Olfr599, Olfr1377, and Olfr1484) was transfected into HEK293T cells, and the cell-surface expression level was measured. The results from two independent experiments are shown in each graph. x axis, PE fluorescence; y axis, cell number. The geometric mean of PE fluorescence of each measurement was used for comparison. The values of RTP1S and OR only were used as positive (= 1) and negative controls (= 0), respectively. Comparison of the normalized response was by different experiments. R2 values were calculated by Pearson's correlation coefficient from the linear regression analysis.
Figure 4.
Figure 4.
Cell-surface expression of the Rho-tagged ORs cotransfected with the N-terminal Ala replacement mutants of RTP1S. Each combination of mutants of RTP1s and ORs (Olfr599, Olfr1377, and Olfr1484) was transfected into HEK293T cells, and the cell-surface expression level was measured. The results from two independent experiments are shown in each graph. x axis, PE fluorescence; y axis, cell number. The geometric mean of the PE fluorescence of each measurement was used for comparison. The values of RTP1S and OR only were used as positive (= 1) and negative controls (= 0), respectively. Comparison of the normalized response was by different experiments. R2 values were calculated by Pearson's correlation coefficient from the linear regression analysis.
Figure 5.
Figure 5.
Heat map of the normalized geometric mean of PE fluorescence of the Rho-tagged ORs cotransfected with each RTP1S mutant. The values of RTP1S and OR only were used as the positive control (= 1; red) and the negative control (= 0; blue), respectively.
Figure 6.
Figure 6.
Correlation between surface expression and ligand response. Olfr599 (A), Olfr1377 (B), and Olfr1484 (C) were functionally coexpressed with the RTP1S mutants, as indicated by cAMP-mediated luciferase assays. A concentration of 100 μm odorants (caprylic acid for Olfr599 and acetophenone for Olfr1377 and Olfr1484) was used to stimulate ORs. Comparison of the analysis of the response against 100 mm of each odorant in the Luciferase assay and the cell surface expression level in the FACS analysis about Olfr599(D), Olfr1484(E) and Olfr1377(F). The straight line (black dot) is regression line and R2 indicates Pearson's correlation coefficient.
Figure 7.
Figure 7.
Oligomeric state of RTP1S_C2-Strep. A, SDS-PAGE image of purified RTP1S_C2-Strep. B, SEC-MALS analysis of the purified RTP1S_C2-Strep. Left, homodimer fraction, Right, monomer fraction. C, HPLC analysis with the addition of DTT. Reaction time dependence on 1 mm DTT (left) and DTT concentration dependence in the 1-h reaction (right) is shown.
Figure 8.
Figure 8.
Effect of N-terminal truncations on the dimer formation of RTP1S_C2-Strep. Size-exclusion chromatograms of RTP1S_C2-Strep N-terminal truncation mutants are shown. The black arrow indicates the dimer form of RTP1S.
Figure 9.
Figure 9.
Dimerization of RTP1S in living cells. A, schematic diagram of the Nanobit assay against RTP1S in HEK293T cells. a.a., amino acid. B, optimization of Nanobit against RTP1S fused to each Nanobit protein. Values of RTP1S-Lg only were used as the standard for multiple comparisons. C, Nanobit assay using RTP1SΔN2 fused with the Nanobit proteins at the C terminus. D, homodimerization of RTP2 and RTP4. Nanobit proteins were fused on the C terminus. 1S/1S indicates the coexpression of RTP1S-Lg and RTP1S-Sm. E, heterodimerization of RTP proteins. Nanobit proteins were fused to the C terminus of the RTPs. 1S/1S indicates the coexpression of RTP1S-Lg and RTP1S-Sm. Values of RTP1S-Lg only were used as the standard for multiple comparisons. The error bar indicates S.E.M. (n = 3). Multiple comparisons were performed using one-way analysis of variance followed by Tukey's (for B and C) and Dunnett's (for D and E) multiple comparison test (*, p < 0.05; **, p < 0.01; ***, p < 0.001; n.s., not significant).
Figure 10.
Figure 10.
Importance of conserved amino acids at the N-terminal region of RTP1S. A, amino acid sequence of the N termini of RTP1 and RTP2. Secondary structure was predicted with Jpred4 (37). FACS analyses are shown for the N-terminal deletion (ΔN9) and chimera (C2S, K3T, V5L, and G8C mutants) of RTP1S_C2 against Olfr599 (B) and cysteine replacement mutant of RTP1S and RTP2 against Olfr599 (E). Each combination of mutants of RTP1S and Olfr599 was transfected into HEK293T cells, and the cell-surface expression levels were measured. x axis, PE fluorescence; y axis, cell number. C and F, normalized geometric mean of PE fluorescence of each measurement was used for comparison. The values of RTP1S and OR only were used as the positive (= 1) and the negative controls (= 0), respectively. D and G, comparison of the normalized response by different experiments. R2 values were calculated by Pearson's correlation coefficient from the linear regression analysis.

Similar articles

Cited by

References

    1. Buck L., and Axel R. (1991) A novel multigene family may encode odorant receptors: a molecular basis for odor recognition. Cell 65, 175–187 10.1016/0092-8674(91)90418-X - DOI - PubMed
    1. DeMaria S., and Ngai J. (2010) The cell biology of smell. J. Cell Biol. 191, 443–452 10.1083/jcb.201008163 - DOI - PMC - PubMed
    1. Zou D. J., Chesler A., and Firestein S. (2009) How the olfactory bulb got its glomeruli: a just so story? Nat. Rev. Neurosci. 10, 611–618 10.1038/nrn2666 - DOI - PubMed
    1. Niimura Y. (2009) Evolutionary dynamics of olfactory receptor genes in chordates: interaction between environments and genomic contents. Hum. Genomics 4, 107–118 10.1186/1479-7364-4-2-107 - DOI - PMC - PubMed
    1. Zhang X., and Firestein S. (2002) The olfactory receptor gene superfamily of the mouse. Nat. Neurosci. 5, 124–133 10.1038/nn800 - DOI - PubMed

Publication types

LinkOut - more resources