. 2019 Oct;18(10):1822-1831.
doi: 10.1158/1535-7163.MCT-19-0115. Epub 2019 Aug 8.

A Novel Therapeutic Induces DEPTOR Degradation in Multiple Myeloma Cells with Resulting Tumor Cytotoxicity

Affiliations

A Novel Therapeutic Induces DEPTOR Degradation in Multiple Myeloma Cells with Resulting Tumor Cytotoxicity

Mario I Vega et al. Mol Cancer Ther. 2019 Oct.

Abstract

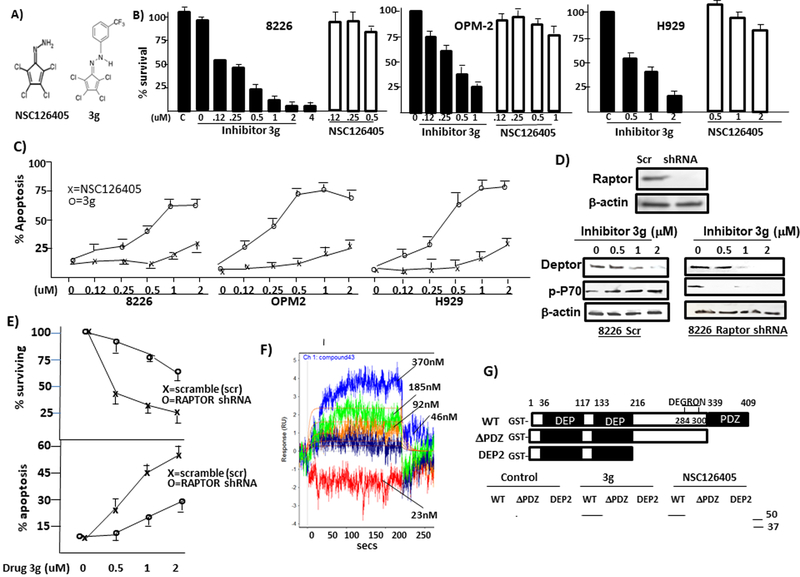
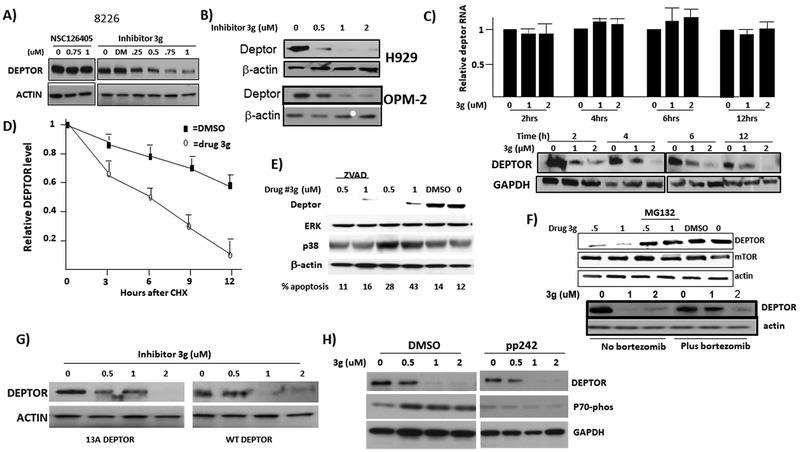
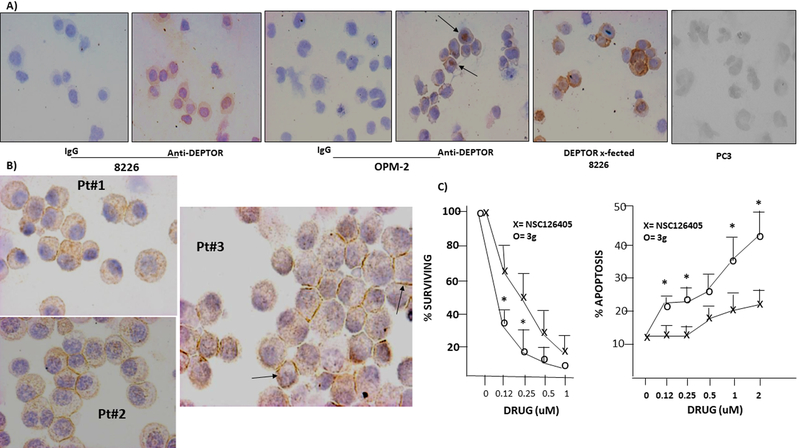
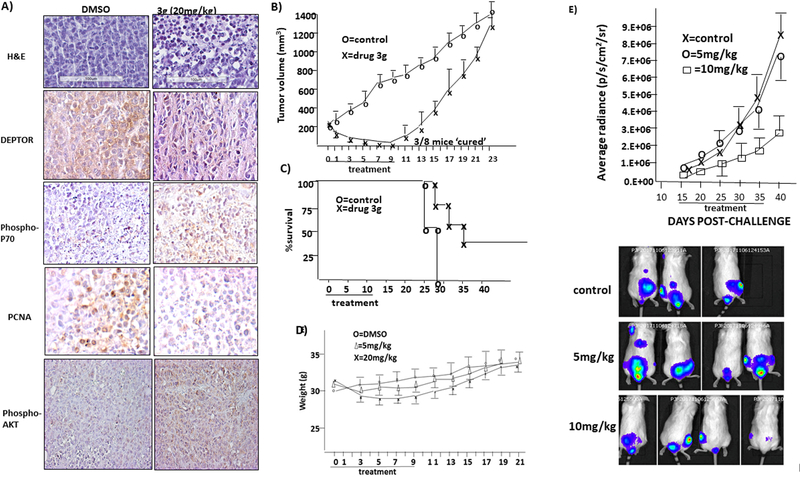
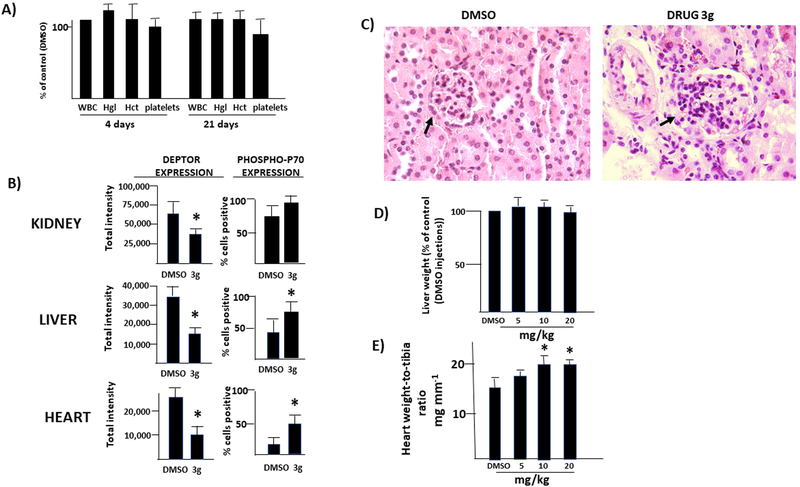
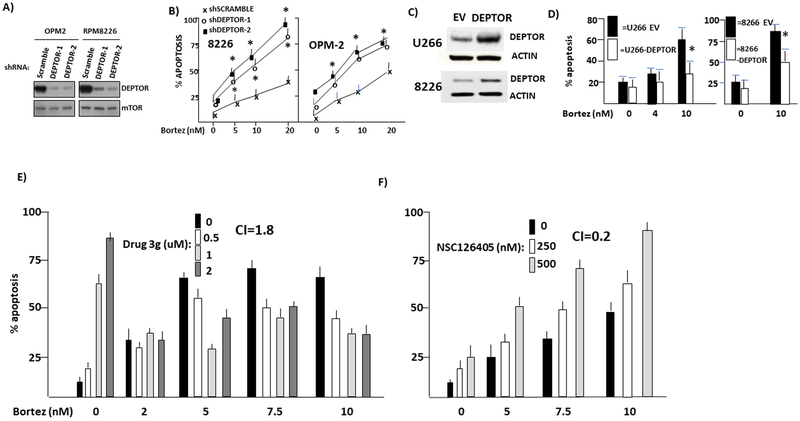
Prior work indicates DEPTOR expression in multiple myeloma cells could be a therapeutic target. DEPTOR binds to mTOR via its PDZ domain and inhibits mTOR kinase activity. We previously identified a drug, which prevented mTOR-DEPTOR binding (NSC126405) and induced multiple myeloma cytotoxicity. We now report on a related therapeutic, drug 3g, which induces proteasomal degradation of DEPTOR. DEPTOR degradation followed drug 3g binding to its PDZ domain and was not due to caspase activation or enhanced mTOR phosphorylation of DEPTOR. Drug 3g enhanced mTOR activity, and engaged the IRS-1/PI3K/AKT feedback loop with reduced phosphorylation of AKT on T308. Activation of TORC1, in part, mediated multiple myeloma cytotoxicity. Drug 3g was more effective than NSC126405 in preventing binding of recombinant DEPTOR to mTOR, preventing binding of DEPTOR to mTOR inside multiple myeloma cells, in activating mTOR and inducing apoptosis in multiple myeloma cells. In vivo, drug 3g injected daily abrogated DEPTOR expression in xenograft tumors and induced an antitumor effect although modest weight loss was seen. Every-other-day treatment, however, was equally effective without weight loss. Drug 3g also reduced DEPTOR expression in normal tissues. Although no potential toxicity was identified in hematopoietic or hepatic function, moderate cardiac enlargement and glomerular mesangial hypertrophy was seen. DEPTOR protected multiple myeloma cells against bortezomib suggesting anti-DEPTOR drugs could synergize with proteasome inhibitors (PI). Indeed, combinations of drug NSC126405 + bortezomib were synergistic. In contrast, drug 3g was not and was even antagonistic. This antagonism was probably due to prevention of proteasomal DEPTOR degradation.


Conflict of interest statement

Conflict of interest: The authors declare no potential conflicts of interest

Figures

Figure 1:
Figure 1:
Cytotoxic effects of DEPTOR inhibitors: A) Structures of NSC126405 and 3g; B) % survival (MTT assays) at increasing concentrations of inhibitors (48 hr assay) for 3 MM cell lines. Results are mean+/−SD, n=5; C) % apoptosis induced at 48 hrs (X=NSC126405; 0=3g), mean+/−SD, n=3; D) Immunoblot of control 8226 cells (Scr=scrambled sequence shRNA) or RAPTOR-silenced 8226 cells (upper panel) and immunoblot of control or RAPTOR-silenced cells incubated with drug 3g for 8 hrs (lower panel); E) MTT (upper) or apoptosis (lower) assays in both cell lines after 48 hrs; Means+/−SD, n=3. F) Surface plasmon resonance assay (see Materials & Methods) where increasing concentrations of 3G-containing analyte is passed over immobilized recombinant DEPTOR. G) upper panel, structure of 3 recombinant DEPTOR proteins used in drug binding assay (see Materials & Methods); bottom, binding of 3g or NSC126405 to wild type (WT) or truncated DEPTOR proteins;
Figure 2:
Figure 2:
Drug 3g induces DEPTOR degradation: A & B) Immunoblot of 8226, H929 or OPM-2 cells after 6 hr incubation with NSC126405 or 3g; C) 8226 cells incubated with 0, 1 or 2 uM of 3g for 2,4,6 or 12 hrs after which cells assayed for DEPTOR RNA (upper panel, mean+/−SD, n=3) or DEPTOR protein (lower panel); D) Pulse chase (8226 cells) experiment utilizing cycloheximide (CHX) comparing DMSO)- or 3g-treated cells; Results are means+/−SD, n=3; E) Immunoblot in 8226 cells after 4 hr treatment with DMSO or drug 3g at 0 (no DMSO), 0.5 or 1uM +/− ZVAD used at 0.5 uM. Below gel is % apoptosis assayed at 48 hrs; F) Immunoblot after 3 hr treatment with DMSO or drug 3g at 0, 0.5 or 1 uM +/− MG132 used at 10Um or +/− bortezomib used at 10 nM; G) MM cells transfected with either wild type (WT) FLAG-DEPTOR or 13A FLAG-DEPTOR mutant, treated with drug 3g (4hrs) followed by immunoblot assay for FLAG; H) 8226 cells treated with drug 3g+/− pp242 to inhibit mTOR, followed by immunoblot assay.
Figure 3:
Figure 3:
Effects on primary MM cells: A) Immunostaining of MM (8226, OPM-2) or prostate cancer (PC3) cell lines with anti-DEPTOR antibody; Magnification= 40x; B) Immunostaining of 3 primary MM specimens from patients (magnification=100x); C) Primary MM specimens (n=5) treated with increasing concentrations of NSC126405 or 3g for 20 hrs after which trypan blue staining and counting (% surviving, left panel) or apoptosis (right panel) assayed. Results are mean+/−SD, n=5. *=significantly (p<0.05) different from NSC126405.
Figure 4:
Figure 4:
Effects of 3g in mice: A) Immunostaining of tumors excised after 4 days of DMSO or 3g. Pictures are representative of all 4 murine tumors/group; magnification= 40x; B) Tumor outgrowth in mice treated daily for 9 days with DMSO or 3g at 20 mg/kg. Results are mean+/−SD tumor volume (n=8 mice/group); C) Survival curve of experiment described in ‘B’; D) Murine weights comparing DMSO injections to 5 or 20 mg/kg drug 3g administered IP daily for 9 days. Results are mean+/−SD; Wts of mice injected w/ 20 mg/kg were lower (p<0.05) than control mice during the 9 days of treatment; E) Bioluminescence results in mice challenged IV with luciferase-expressing 8226 cells. When signal is first detected (day 15 post-challenge) mice randomized to receive DMSO (control n=3) or drug 3g in IP daily injections for 20 days at either 5 or 10 mg/kg (n=4/group). Results are total bioluminescence (mean+/−SD). Below graph are representative images of control mice and 5mg/kg or 10mg/kg drug 3g-injected mice at day 40.
Figure 5:
Figure 5:
Effects of 3g in immunocompetent mice: A) Blood counts (white blood cells (WBC), hemoglobin (Hgl), hematocrit (HCT) & platelets after 4 or 21 days of daily drug 3g (20mg/kg) compared to control (DMSO treatment, assumed to be 100%); Results are mean+/−SD, n=4. B) Semi-quantitative assessment of DEPTOR or phosphorylated p70 expression (see Materials & Methods) in kidney, liver or heart (mean+/−SD, n=4) after 21 days of DMSO or 3g treatment (10 mg/kg × 21 days) *=different from DMSO control, p<0.05; C) Representative images of renal glomeruli (arrows) in DMSO-control-injected (left) or drug 3g-treated (10mg/kg, right) mice (magnification=400x); D) liver weights expressed as % of control (DMSO), mean+/−SD, n=4; E) heart weight-to-tibia length ratios expressed as mg mm−1 , mean+/−SD, n=4; *=different than DMSO control, p<0.05
Figure 6:
Figure 6:
Effects on bortezomib sensitivity: A) Immunoblot assay in cell lines transfected with shRNA to scrambled sequence or 2 separate sequences of DEPTOR.B) Apoptosis of cell lines of ‘A’ when exposed to increasing concentrations (nM) of bortezomib (Bortez) for 48 hrs; Data is mean+/−SD, n=3; *denotes apoptosis significantly greater (p<0.05) than scramble-transfected line; C) Immunoblot assay of DEPTOR expression in U266 or 8226 MM cell lines after transfection with empty vector (EV) or DEPTOR; D) % apoptosis of cell lines of ‘C’ following 48hr incubation with 0, 4 or 10 nM bortezomib; Data are mean+/−SD, n=3; *denotes significantly (p<0.05) decreased apoptosis vs EV-transfected control; E & F) % apoptosis (mean+/−SD) of 8226 MM cells treated for 48 hrs with increasing concentrations of bortezomib+/− NSC126405 or drug 3g; Combinatorial indices (CI) of combined treatment given above bars.

References

    1. Peterson TR, Laplante M, Thoreen CC, Sancak Y, Kang SA, Kuehl WM, et al. DEPTOR is an mTOR inhibitor frequently overexpressed in multiple myeloma cells and required for their survival. Cell 2009;137:873–886. - PMC - PubMed
    1. Zhang HR, Chen JM, Zeng ZY, Que WZ. Knockdown of DEPTOR inhibits cell proliferation and increases chemosensitivity to melphalan in human multiple myeloma RPMI-826 cells via inhibiting PI3K/AKT activity. J Int Med Res 2013;41:584–595 - PubMed
    1. Shi Y, Daniels-Wells T, Frost P, Lee J, Finn RS, Bardeleben C, et al. Cytotoxic properties of a DEPTOR-mTOR inhibitor in multiple myeloma cells. Cancer Res. 2016;76:5822–5831 - PMC - PubMed
    1. Yang Y, Bardeleben C, Frost P, Hoang B, Shi Y, Finn R et al. DEPTOR is linked to a TORC1-p21 survival/ proliferation pathway in multiple myeloma cells. Genes & Cancer 2014;5:407–419 - PMC - PubMed
    1. Benavides-Serrato A, Lee J, Holmes B, Landon KA, Bashir T, Jung ME, et al. Specific blockade of RICTOR-mTOR association inhibits mTORC2 activity and is cytotoxic in glioblastoma. PLOS one 2017;12(4)e0176599. - PMC - PubMed

Publication types

Substances