. 2019 Aug 23;365(6455):786-793.
doi: 10.1126/science.aax4438. Epub 2019 Aug 8.

Exploring genetic interaction manifolds constructed from rich single-cell phenotypes

Affiliations

Exploring genetic interaction manifolds constructed from rich single-cell phenotypes

Thomas M Norman et al. Science. .

Abstract

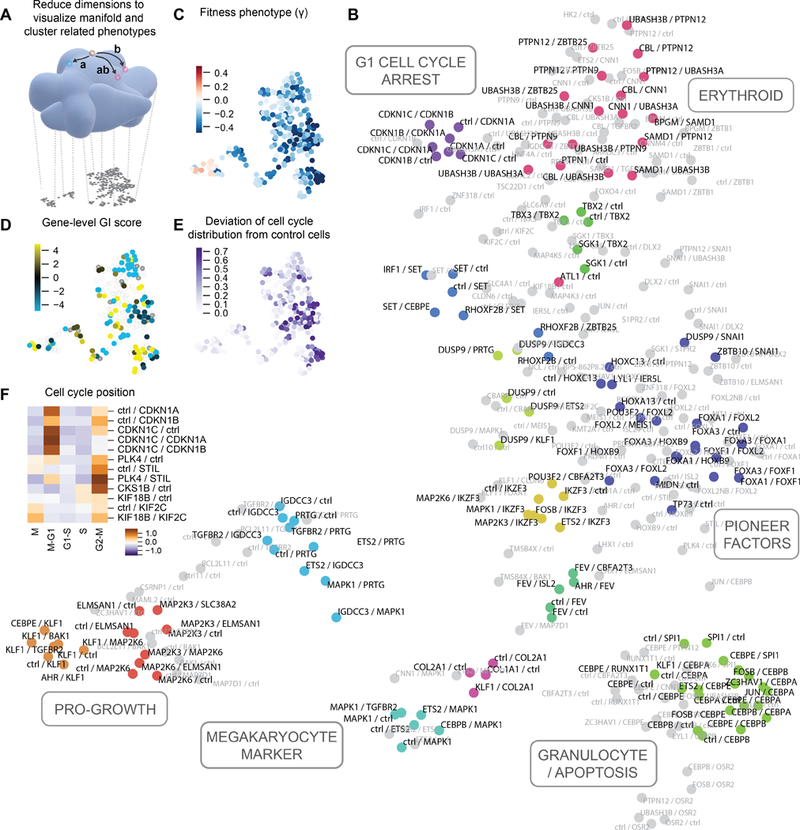
How cellular and organismal complexity emerges from combinatorial expression of genes is a central question in biology. High-content phenotyping approaches such as Perturb-seq (single-cell RNA-sequencing pooled CRISPR screens) present an opportunity for exploring such genetic interactions (GIs) at scale. Here, we present an analytical framework for interpreting high-dimensional landscapes of cell states (manifolds) constructed from transcriptional phenotypes. We applied this approach to Perturb-seq profiling of strong GIs mined from a growth-based, gain-of-function GI map. Exploration of this manifold enabled ordering of regulatory pathways, principled classification of GIs (e.g., identifying suppressors), and mechanistic elucidation of synergistic interactions, including an unexpected synergy between CBL and CNN1 driving erythroid differentiation. Finally, we applied recommender system machine learning to predict interactions, facilitating exploration of vastly larger GI manifolds.


Conflict of interest statement

Competing Interests: TMN, MAH, LAG, MJ, and JSW have filed patent applications related to CRISPRi/a screening, Perturb-seq and GI mapping. JSW consults for and holds equity in KSQ Therapeutics, Maze Therapeutics, and Tenaya Therapeutics. JSW is a venture partner at 5AM Ventures. TMN, MJ, JMR and MAH consult for Maze Therapeutics.

Figures

Figure 1.
Figure 1.. A CRISPRa fitness-level genetic interaction (GI) map.
(A) Experimental strategy. Pairs of genes were systematically co-activated using dual sgRNA CRISPRa libraries and a GI map was generated from the fitness measurements. A subset of GIs were then profiled transcriptionally using Perturb-seq. These high-dimensional measurements define a surface called a GI manifold. Distinct GIs that lie in markedly different parts of the GI manifold may result in similar outcomes when viewed only at the level of fitness. (B) CRISPRa fitness-level GI map. Gene-level GI profiles were clustered by average linkage hierarchical clustering based on Pearson correlation. Clusters were annotated by assigning DAVID annotations if a DAVID term was significantly enriched in that cluster (hypergeometric ln(p) ≤ −7.5; see Methods). (C-D) GI profile correlation between pairs of sgRNAs targeting any genes (black) or the same gene (green). Data is displayed as scatter plot of replicates (C) and histogram of replicate-averaged GIs (D). (E-F) Gene-level GI scores generated by averaging all sgRNA-level GIs for each gene pair. (E) Scatter plot of replicates. Red points indicate non-targeting control sgRNA pairs and dashed line indicates a radius of 6 standard deviations from non-targeting controls. (F) Histogram of gene-level GI scores with estimated empirical 5% FDR threshold. (G) Comparison of fold activation of target gene measured by Perturb-seq when the targeting sgRNA is in the A or B position in the dual sgRNA expression cassette. (H) Fold activation of the target gene compared with the total number of differentially expressed genes.
Figure 2.
Figure 2.. Visualization of the GI manifold.
(A) Using diverse genetic perturbations, the structure of the GI manifold can be inferred and then visualized by dimensionality reduction to a plane. (B) UMAP projection of all single gene and gene pair Perturb-seq profiles. Each dot represents a genetic perturbation characterized by its mean expression profile. Clusters of transcriptionally similar perturbations are colored identically, while grey dots are perturbations that do not fall within stable clusters. (C) Fitness measurements from the GI map, expressed as gene pair growth phenotypes (γ). (D) GI scores from the fitness-level GI map. Single gene perturbations are not included. (E) Cell cycle deviation scores. Stronger scores indicate alteration from the distribution of cell cycle positions observed in unperturbed cells. (F) Relative enrichment or depletion of cell cycle phases relative to unperturbed cells induced by selected genetic perturbations.
Figure 3.
Figure 3.. Dissecting a genetic interaction using Perturb-seq.
(A) Expression of marker genes for different hematopoietic cell types in GI manifold UMAP projection. Color is scaled by mean expression Z-score of a marker gene panel. (B) Hematopoietic differentiation hierarchy. K562 cells are a poorly differentiated erythroid-like cancer cell line. (C) Perturb-seq profiling of the CBL/CNN1 GI. Average transcriptional profiles for the two constituent single perturbations are compared to the double perturbation. Heatmaps show deviation in gene expression relative to unperturbed cells. (D) UMAP projection of single-cell Perturb-seq data in the CBL/CNN1 interaction. Each dot is a cell colored according to genetic background. (E) ARCHS4 (35) cell type term enrichment for genes showing large expression changes in CBL/CNN1 doubly-perturbed cells. (F) Expression of hemoglobin in HUDEP2 cells upon cDNA overexpression of CBL or CNN1. Hemoglobin was labeled with anti-HbF antibody and measured by flow cytometry. (G) Pelleted HUDEP2 cells. Hemoglobin expression appears red.
Figure 4.
Figure 4.. A quantitative model for high-dimensional GIs.
(A) Model of transcriptional genetic interactions. Different transcriptional states define points on the surface of the GI manifold and genetic perturbations define vectors of travel. The model decomposes double perturbations as a linear combination of the two constituent single perturbations. (B) Model fit across all GIs measured with Perturb-seq. (C) Magnitude of model coefficients compared to GI score from the fitness-level GI map. (D-E) Application of the model to selected GIs. For each GI, transcriptional profiles for the two constituent single perturbations are compared to the double perturbation and the model fit. Heatmaps show deviation in gene expression relative to unperturbed cells. (F) Visualization of all measured GIs in Perturb-seq experiment. Each GI was characterized using features derived from the model (x-axis) and by measures of similarity among the transcriptional profiles (y-axis). These two viewpoints were each clustered and collapsed to a single dimension using UMAP to define the two axes. The features defining the two axes are plotted next to them. Categories of GIs are annotated based on features shared within the clusters.
Figure 5.
Figure 5.. Inferring gene regulatory logic underlying GIs.
(A)-(C) Application of linear genetic interaction model to GIs among DUSP9, MAPK1, and ETS2. (D) Order of pathway inferred from model fits. (E) Epistatic buffering interactions oriented using the genetic interaction model. Each arrow denotes a genetic interaction, originating in the gene that dominates when the two genes are simultaneously perturbed. Arrow size denotes the degree of dominance as measured by asymmetry of model coefficients. Genetic perturbations with similar transcriptional profiles are colored identically. (F) Stochastic heterogeneity can cause individual cells (dots) bearing a given genetic perturbation to explore the space on the GI manifold surrounding the average direction of travel (arrows). (G) UMAP projection of single cells with overexpression of DUSP9 and/or MAPK1. Black line represents the principal curve, which tracks the primary direction of variation in the dataset that can be used to order all cells. (H) Gene expression averaged along the principal curve. Each row denotes a cell ordered according to position along the principal curve. The left three columns indicate that cell’s genetic background. At each point, cells that are close on the principal curve are averaged to produce a local estimate of median gene expression. The heatmap shows normalized expression of differentially expressed genes. The DUSP9 and MAPK1 expression columns show the same data for the targeted genes.
Figure 6.
Figure 6.. A recommender system for exploring the GI landscape.
(A) Schematic of prediction strategy. Fitness phenotypes of a limited subset of GIs are measured. Each gene is characterized by its Perturb-seq transcriptional profile, and similarity among these profiles is used as side information to constrain a recommender system model to impute remaining fitness GI scores and highlight regions of interest. (B) True vs. predicted GI map obtained by prediction from 10% of randomly sampled fitness-level GIs. (C) Block-averaged true and predicted GI maps obtained by averaging GI scores within clusters. (D) Scatter plot of true and predicted GI scores (blue dots) from (B). The dashed lines show 5% and 95% quantiles, used to designate strong GIs. Orange dots show equivalent scatter for block-averaged GI scores in (C). (E) Spearman correlation between true and predicted GI scores at different levels of random sampling. Fifty random subsets were measured for each sampling level. Blue and orange denote individual and block-averaged GIs. (F) Cophenetic correlation of GI profiles as a function of sampling level, measuring the similarity of correlation structure in the true and predicted GI maps. (G) To assess scaling ability, the representation of each perturbation in the Perturb-seq experiment was randomly downsampled to different levels of representation. Plot shows cophenetic correlation between downsampled and true transcriptional profiles used to construct the GI manifold visualization of Figure 2.

Comment in

References

    1. Costanzo M, Kuzmin E, van Leeuwen J, Mair B, Moffat J, Boone C, Andrews B, Global Genetic Networks and the Genotype-to-Phenotype Relationship. Cell 177, 85–100 (2019). - PMC - PubMed
    1. Domingo J, Baeza-Centurion P, Lehner B, The Causes and Consequences of Genetic Interactions (Epistasis). Annu Rev Genomics Hum Genet (2019), 10.1146/annurev-genom-083118-014857. - DOI - PubMed
    1. Hartman JL, Garvik B, Hartwell L, Principles for the buffering of genetic variation. Science 291, 1001–1004 (2001). - PubMed
    1. Takahashi K, Yamanaka S, Induction of pluripotent stem cells from mouse embryonic and adult fibroblast cultures by defined factors. Cell 126, 663–676 (2006). - PubMed
    1. Jaitin DA, Weiner A, Yofe I, Lara-Astiaso D, Keren-Shaul H, David E, Salame TM, Tanay A, van Oudenaarden A, Amit I, Dissecting Immune Circuits by Linking CRISPR-Pooled Screens with Single-Cell RNA-Seq. Cell 167, 1883–1896.e15 (2016). - PubMed

Publication types