. 2019 Aug 8;10(1):3585.
doi: 10.1038/s41467-019-11584-0.

Mild replication stress causes chromosome mis-segregation via premature centriole disengagement

Affiliations

Mild replication stress causes chromosome mis-segregation via premature centriole disengagement

Therese Wilhelm et al. Nat Commun. .

Abstract

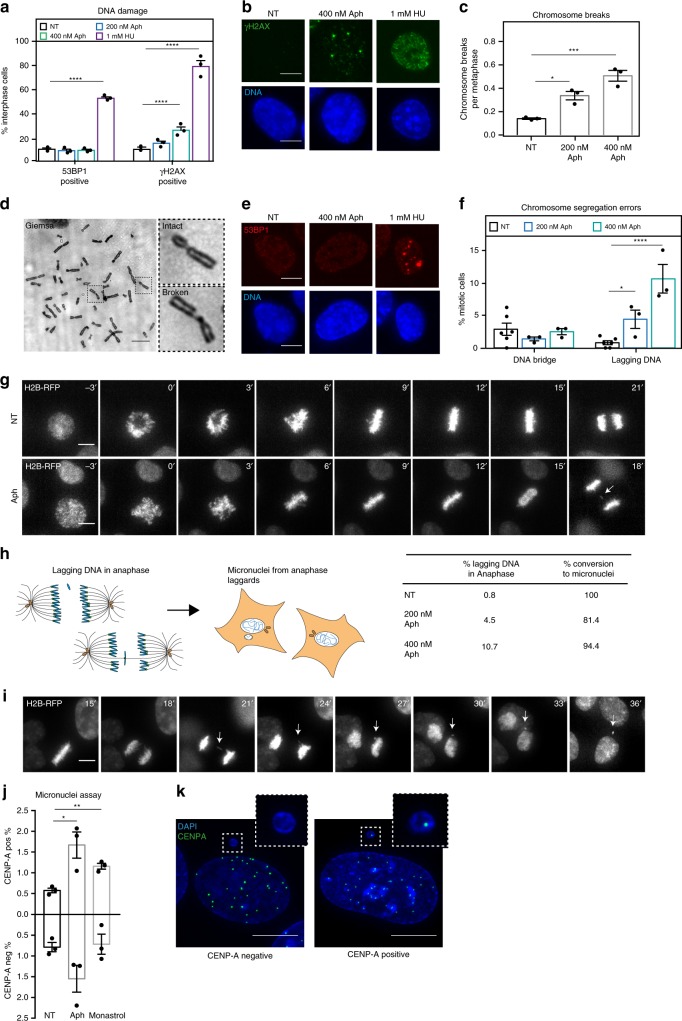
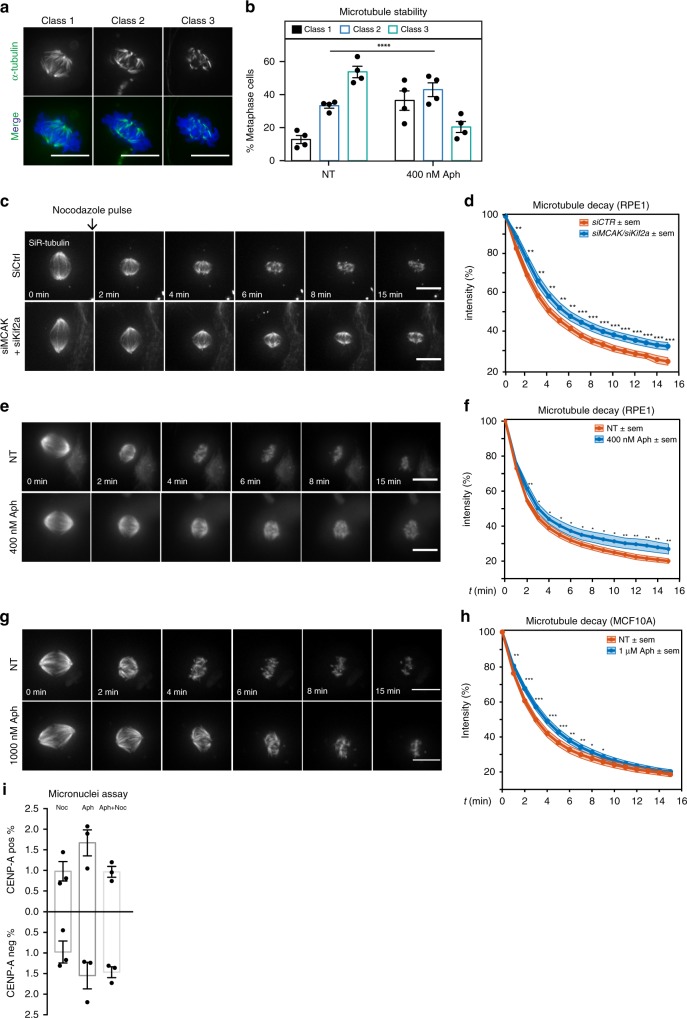
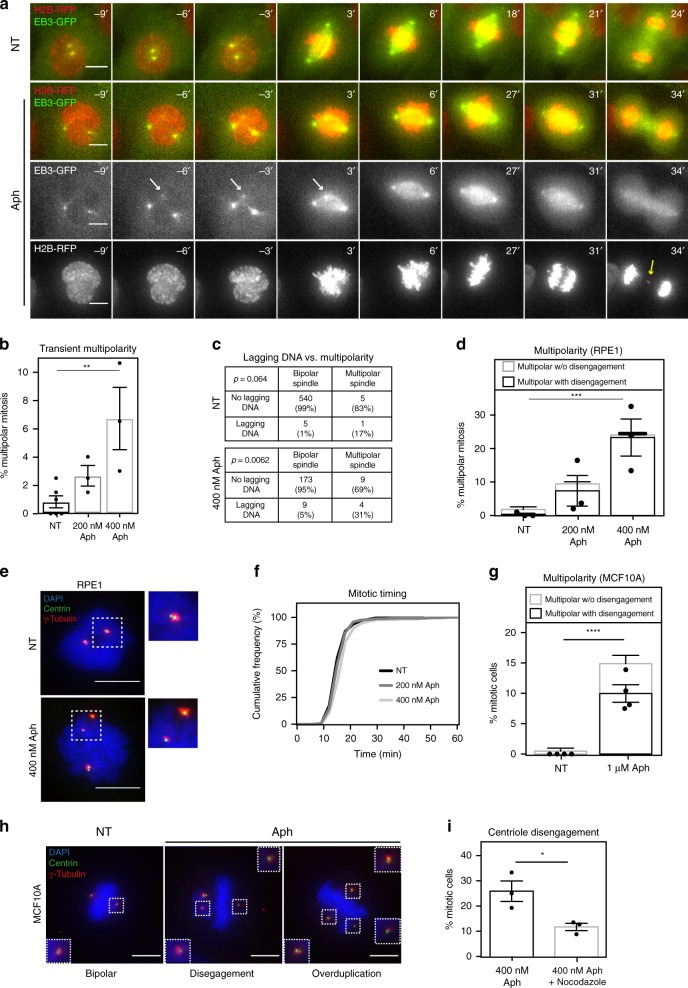
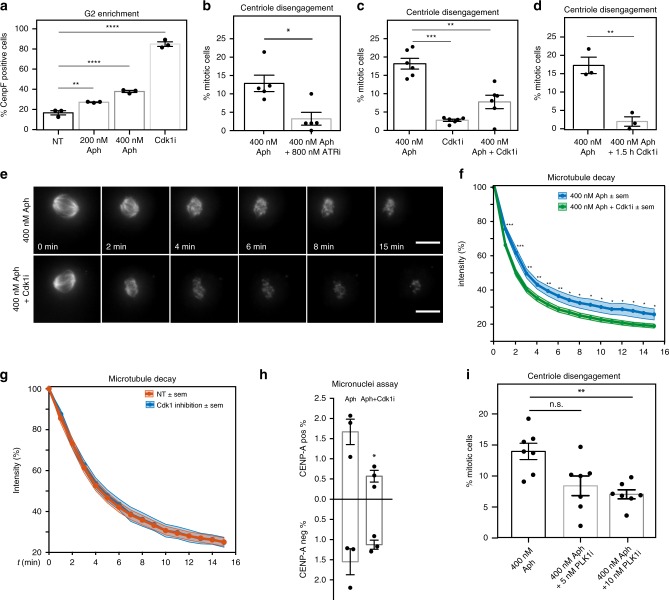
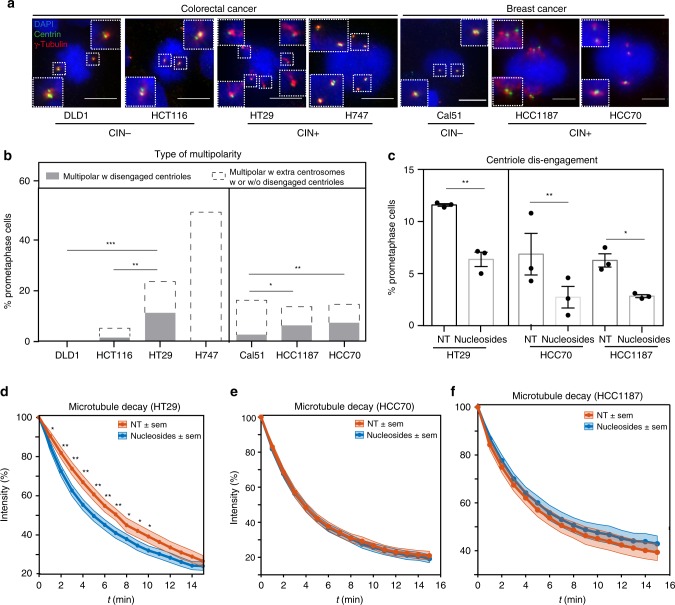
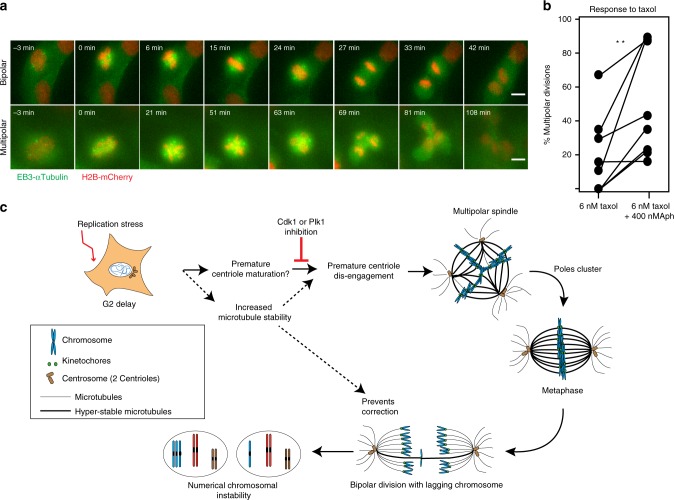
Replication stress, a hallmark of cancerous and pre-cancerous lesions, is linked to structural chromosomal aberrations. Recent studies demonstrated that it could also lead to numerical chromosomal instability (CIN). The mechanism, however, remains elusive. Here, we show that inducing replication stress in non-cancerous cells stabilizes spindle microtubules and favours premature centriole disengagement, causing transient multipolar spindles that lead to lagging chromosomes and micronuclei. Premature centriole disengagement depends on the G2 activity of the Cdk, Plk1 and ATR kinases, implying a DNA-damage induced deregulation of the centrosome cycle. Premature centriole disengagement also occurs spontaneously in some CIN+ cancer cell lines and can be suppressed by attenuating replication stress. Finally, we show that replication stress potentiates the effect of the chemotherapeutic agent taxol, by increasing the incidence of multipolar cell divisions. We postulate that replication stress in cancer cells induces numerical CIN via transient multipolar spindles caused by premature centriole disengagement.


Conflict of interest statement

The authors declare no competing interests.

Figures

Fig. 1
Fig. 1
Mild replication stress induces whole chromosome mis-segregation. a Mean percentage of γH2AX and 53BP1 positive RPE1 cells. N = 3 independent experiments examining NT = 909, 200 nM Aph = 963, 400 nM Aph = 971 and 1 mM HU = 637 cells; p < 0.0001 in two-way Anova test (yH2AX: NT vs. 400 nM Aph p < 0.0001; NT vs. HU p < 0.0001; 53BP1: NT vs. HU p < 0.0001). b Representatives images of cells stained for γH2AX and DNA after indicated treatments. All scale bars in Figure = 10 μm. c Number of metaphase chromosome breaks. N = 3 examining NT = 222 and Aph = 212 metaphase spreads; p = 0.0008 in one-way Anova test (NT vs. 200 nM Aph p = 0.0114; NT vs. 400 nM Aph p = 0.0005). d Representative image of a Giemsa stained metaphase after a 400 nM Aph treatment; insets show an intact and broken chromosome. e Representative images of RPE1 cells stained for 53BP1 and DNA after indicated treatments. f Percentage of chromosome segregation errors as quantified from time-lapse imaging experiments of RPE1 H2B-mCherry/EB3-GFP cells. N = 3 (Aph) and 6 (NT) examining NT = 551, 200 nM Aph = 423 and 400 nM Aph = 195 anaphases; p = 0.0003 in two-way Anova test (lagging DNA: NT vs. 200 nM Aph p = 0.04; NT vs. 400 nM Aph p = 0.0001). g Representative time-lapse sequence after indicated treatments quantified in (f). Nuclear envelope breakdown (NEBD) is t = 0. White arrow indicates lagging DNA. h Conversion rate of lagging DNA to micronuclei according to the left schematic (created by TW). i Representative time-lapse sequence of cells forming a micronucleus from persistent lagging DNA (white arrow). NEBD is t = 0. j Percentage of interphase cells containing CENP-A-negative and CENP-A-positive micronuclei after indicated treatments. N = 3 examining NT = 2928, Aph = 2421 and Monastrol = 2653. CENP-A positive MN: NT vs. Aph p = 0.0269 in unpaired t-test; NT vs monastrol p = 0.0029. k Representatives image of cells with micronuclei containing (right) or not (left) CENP-A signal; error bars indicate sem. Source data are provided as a Source Data file
Fig. 2
Fig. 2
Mild replication stress stabilizes microtubules. a Representative images of cold- treated RPE1 centrin1-GFP cells stained with α-tubulin antibodies (green) and DAPI (blue). Cells were categorized into Class 1, 2 or 3 depending on the integrity of the mitotic spindle. All scale bars in Figure = 10 μm. b Mean percentages of class 1, class 2 and class 3 RPE1 centrin1-GFP cells; N = 4 examining in NT = 159 and Aph = 170 metaphases; p < 0.0001 in chi-square test. c Representative time-lapse images of metaphasic RPE1 centrin1-GFP cells stained with SiR-tubulin and treated with a nocodazole pulse at t = 0 after indicated treatments. d Quantification of the spindle intensity over time after a nocodazole pulse, as shown in (c), in metaphase RPE1 centrin1-GFP cells; N = 33 metaphases for siCTR and 31 for siMCAK/Kif2a. *p < 0.05; **p < 0.01; ***p < 0.001 in a repeated measurement Anova test. e Representative time-lapse images of metaphasic RPE1 centrin1-GFP cells stained with SiR-tubulin and treated with a nocodazole pulse at t = 0 after indicated treatments. f Quantification of the spindle signal as in (d); N = 32 for NT and 31 for Aph. *p < 0.05; **p < 0.01; ***p < 0.001 in a repeated measurement Anova test. g Representative time-lapse images of metaphasic MCF10A cells, stained with SiR-tubulin and treated with a nocodazole pulse at t = 0 after indicated treatments. h Quantification of the spindle signal as in (d) and (f); N = 49 metaphases/condition. *p < 0.05; **p < 0.01; ***p < 0.001 in a repeated measurement Anova test. i Mean percentage of RPE1 cells containing CENP-A-negative and CENP-A-positive micronuclei, treated with 10 ng/µl Nocodazole, 400 nM Aphidicolin or both combined. N = 3 examining Noc = 3125, Aph = 2421 and Aph/Noc = 2397 interphase cells, error bars indicate sem. CENP-A positive MN: Noc vs. Aph p = 0.1539; Aph vs Aph/Noc p = 0.0029 in unpaired t-test. Source data are provided as a Source Data file
Fig. 3
Fig. 3
Replication stress leads to transient spindle multipolarity. a Representatives time-lapse images of RPE1 H2B-mCherry/EB3-GFP cells after indicated treatments showing a normal (top) or transient multipolar spindle (white arrow) followed by a lagging chromosome in anaphase (yellow arrow); NEBD is set as t = 0; All scale bars in Figure = 10 μm. b Mean percentage of transient multipolar spindles quantified from time-lapse images as shown in (a); N = 3 for Aph and 6 for NT examining NT = 551, 200 nM Aph = 423 and 400 nM Aph = 195 anaphases; p = 0.009 in one-way Anova (NT vs. 400 nM Aph; p = 0.005). c Number of NT or Aphidicolin-treated RPE1 H2B-mCherry/EB3-GFP cells with or without lagging DNA depending on whether they have formed a multipolar spindle or not; same N as in b (indicated p-values were calculated with Fischer’s test). d Mean percentages of multipolar mitoses with or without centriole disengagement in RPE1 Centrin1-GFP cells; N = 3; n = 46–190; p = 0.03 in two-way Anova (Multipolar with disengagement: NT vs. 400 nM Aph p = 0.0003). e Representative images of prometaphase RPE1 centrin1-GFP (green) cells stained with γ-tubulin (pericentriolar material marker; red) and DAPI. Represented is a non-treated cell with engaged centrioles (top) and an Aphidicolin-treated cell with disengaged centrioles (bottom). f Cumulative frequency plot of the time between nuclear envelope breakdown (t = 0) and anaphase onset in RPE1 H2B-mCherry/EB3-GFP cells after indicated treatments; same N and number of cells as in (b). g Mean percentages of multipolar mitoses with or without premature centriole disengagement in MCF10A cells; N = 4 examining NT = 189 and Aph = 161 mitoses; p < 0.0001 in two-way Anova (multipolarity with disengagement p < 0.0001, multipolarity without disengagement p = 0.0201). h Representative images of prometaphase MCF10A cells stained with antibodies against γ-tubulin (red), centrin (centriole marker; green) and DAPI. Shown is a non-treated cell with engaged centrioles (left), and Aphidicolin-treated cells with disengaged centrioles (middle) or centriole overduplication (right). i Mean percentage of RPE1 centrin1-GFP cells with dis-engaged centrioles; N = 3 examining Aph = 168 and Aph/Noc = 118 mitoses; p = 0.03 in unpaired t-test. Error bars indicate sem
Fig. 4
Fig. 4
Replication stress phenotypes depend on Cdk1-, Plk1- and ATR. a Mean percentages of CENP-F positive RPE1 cells; N = 3 examining NT = 1398, 200 nM Aph = 1549, 400 nM Aph = 1632 and Cdk1i = 865 interphase cells; p < 0.0001 in a one-way Anova (NT vs. 200 nM Aph p = 0.005; NT vs. 400 nM Aph p < 0.0001; NT vs. Cdk1 inhibition p < 0.0001). b Mean percentages of disengaged RPE1 centrin1-GFP cells; N = 5 examining Aph = 210 and Aph/ATR = 221 mitoses; p = 0.0275 in paired t-test. c Mean percentages of disengaged RPE1 centrin1-GFP cells; N = 6 examining Aph = 369, Cdk1i = 440 and Aph/Cdk1i = 457 mitoses; p < 0.0001 in a one-way Anova (400 nM Aph vs. Cdk1 inhibition p = 0.0005 and 400 nM Aph vs. 400 nM Aph + Cdk1 inhibition p = 0.003). d Mean percentages of disengaged RPE1 centrin1-GFP cells; N = 3 examining Aph = 159 and Aph/Cdk1i = 208 mitoses; p = 0.004 in unpaired t-test. e Representative time-lapse images of metaphasic RPE centrin1-GFP cells stained with SiR-tubulin and treated with a 200 nM nocodazole pulse at t = 0 after indicated treatments; scale bars = 10 μm. f Quantification of the spindle signal as in Fig. 2d; N = 20 for Aph and 23 cells for Aph/Cdk1i; *p < 0.05; **p < 0.01; ***p < 0.001 in a repeated measurement Anova test. g Quantification of the spindle signal as in Fig. 2d; N = 31 for Cdk1i and 34 for NT. h Mean percentage of RPE cells containing CENP-A-negative and positive micronuclei. N = 3 examining Aph = 2421 and Aph/Cdk1i = 1793 interphase cells p = 0.0339 in unpaired t-test. i Mean percentages of disengaged RPE1 centrin1-GFP cells; N = 7 examining Aph = 321, Aph/5 nM Plk1i = 336 and Aph/10nMPlk1i = 357 mitoses; p = 0.0377 in a one-way Anova (400 nM Aph vs. 5 nM Plk1 inhibition p = 0.1787 and 400 nM Aph vs. 400 nM Aph + 10 nM PLK1 inhibition p = 0.0091). Error bars indicate sem. Source data are provided as a Source Data file
Fig. 5
Fig. 5
CIN cancer cells present centriole disengagement. a Representative images of prometaphase DLD1, HCT116, HT29, H747 Cal51, HCC70 and HCC1187 cells stained with antibodies against centrin (green), γ-tubulin (red) and DAPI (blue); scale bars = 10 μm. b Percentages of prometaphase cells with multipolar spindle with either premature centriole disengagement (grey) or extra centrosomes (white) in indicated cell lines; N = 93 prometaphase cells for DLD1, 92 for HCT116, 81 for HT29, 91 for H747, 203 for Cal51, 323 for HCC1187 and 359 for HCC70; p < 0.0001 in a chi-square test (DLD1 vs. HT29 p = 0.001, HCT116 vs. HT29 p = 0.0048, H7474 vs. HT29 p = 0.0011, Cal51 vs HCC1187 p = 0.0214 and Cal51 vs HCC70 p = 0.0066). c Mean percentage of prometaphase HT29, HCC1187 and HCC70 cells with premature centriole disengagement with or without a 20 μM nucleosides supplement; N = 3 examining NT/HT29 = 138, nucleosides/HT29 = 125; NT/HCC1187 = 323, nucleosides/HCC1187 = 350, NT/HCC70 = 359 and nucleosides/HCC70 = 350 prometaphase cells; p < 0.0001 in two-way Anova test. (HT29 p = 0.002, HCC1187 p = 0.0158 and HCC70 p = 0.0065). df Quantification of the spindle intensity over time after a nocodazole pulse, as shown in Fig. 2d, in metaphase HT29 (d), HCC70 (e) or HCC1187 cells (f) supplemented with or without nucleosides; N = 33 for HT29/NT and 23 for HT29/nucleosides, 74 for HCC70/NT and 55 for HCC70/nucleosides, 74 for HCC1187/NT and 65 for HCC1187/nucleosides. *p < 0.05; **p < 0.01; ***p < 0.001 in a repeated measurement Anova test. Error bars indicate sem. Source data are provided as a Source Data file
Fig. 6
Fig. 6
Cells with replication stress are more sensitive to taxol. a Representative time-lapse sequences of hTert-RPE1 H2B-mCherry/EB3-GFP cells dividing in a bipolar (top) or multipolar (bottom) fashion; scale bars = 10 μm. b Mean percentage of multipolar divisions in hTert-RPE1 cells treated with either 6 nM taxol alone or with 6 nM taxol + 400 nM Aphidicolin. Individual connected dots represent single paired experiments; N = 8 examining Taxol = 257 and Aph/Taxol = 214 anaphases; p = 0.0097 in paired t-test; Source data are provided as a Source Data file. c Speculative model on how mild replication stress impacts mitotic progression and leads to numerical aneuploidy; Mild replication stress imposed during S-phase may lead to premature centriole maturation. This induces a Cdk1 and Plk1-dependent premature centriole disengagement and causes transient multipolarity during the subsequent mitosis. These events elevate the incident of lagging chromosome in anaphase giving rise to daughter cells with unequal number of chromosomes. Note that in non-cancerous cells replication stress in addition increases microtubule stability, which may further favour the centriole dis-engagement and prevent correction of erroneous kinetochore-microtubule attachments in anaphase. Model created by T.W. and P.M.

References

    1. McGranahan N, Burrell RA, Endesfelder D, Novelli MR, Swanton C. Cancer chromosomal instability: therapeutic and diagnostic challenges. EMBO Rep. 2012;13:528–538. doi: 10.1038/embor.2012.61. - DOI - PMC - PubMed
    1. Shih IM, et al. Evidence that genetic instability occurs at an early stage of colorectal tumorigenesis. Cancer Res. 2001;61:818–822. - PubMed
    1. Mankouri HW, Huttner D, Hickson ID. Review How unfinished business from S-phase affects mitosis and beyond. EMBO J. 2013;32:2661–2671. doi: 10.1038/emboj.2013.211. - DOI - PMC - PubMed
    1. Bakhoum SF, et al. The mitotic origin of chromosomal instability. CURBIO. 2014;24:R148–R149. - PMC - PubMed
    1. Gregan J, Polakova S, Zhang L, Tolić-Nørrelykke IM, Cimini D. Merotelic kinetochore attachment: causes and effects. Trends Cell Biol. 2011;21:374–381. doi: 10.1016/j.tcb.2011.01.003. - DOI - PMC - PubMed

Publication types

MeSH terms

Substances