. 2020 Oct;17(10):1026-1041.
doi: 10.1038/s41423-019-0266-5. Epub 2019 Aug 8.

CMIP is a negative regulator of T cell signaling

Affiliations

CMIP is a negative regulator of T cell signaling

Julie Oniszczuk et al. Cell Mol Immunol. 2020 Oct.

Abstract

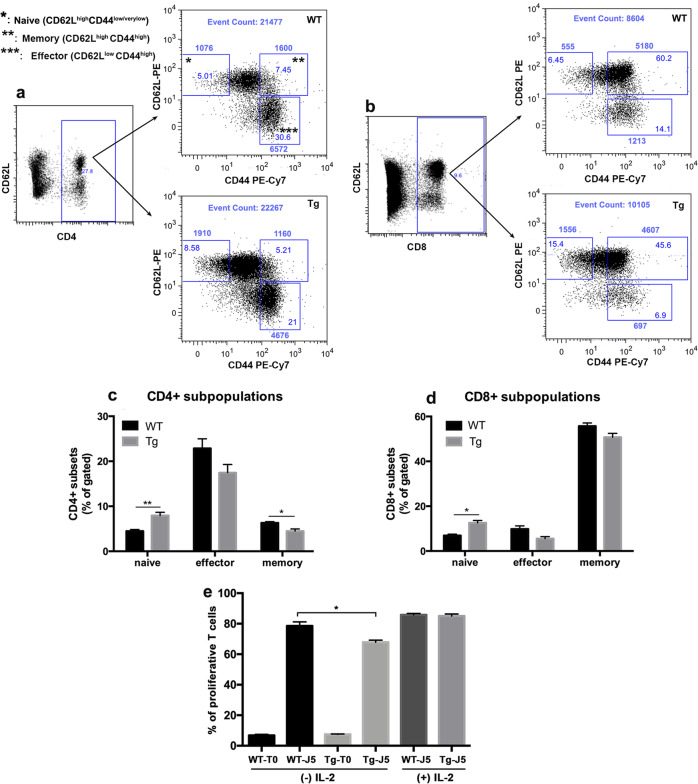
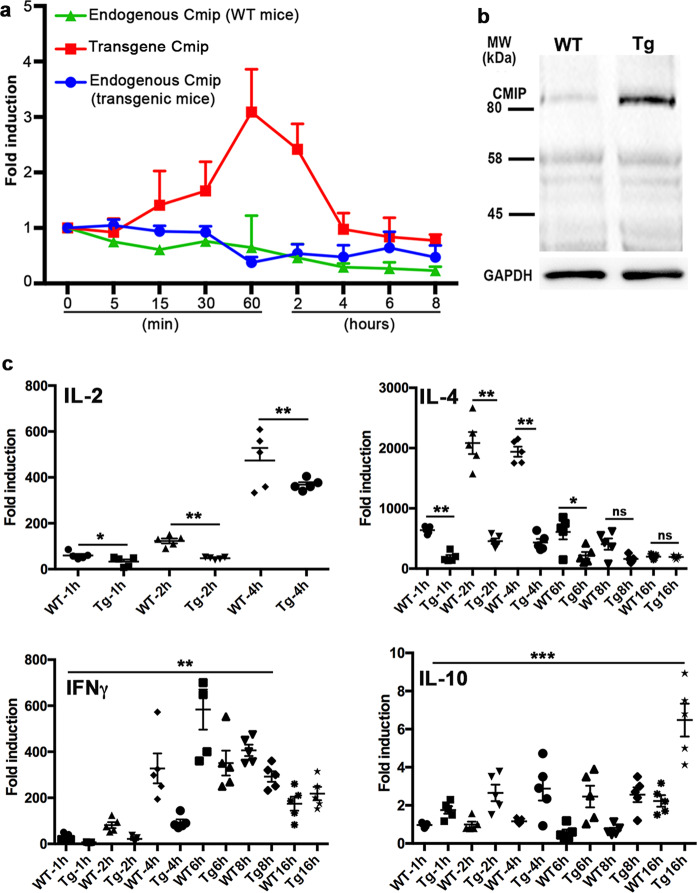
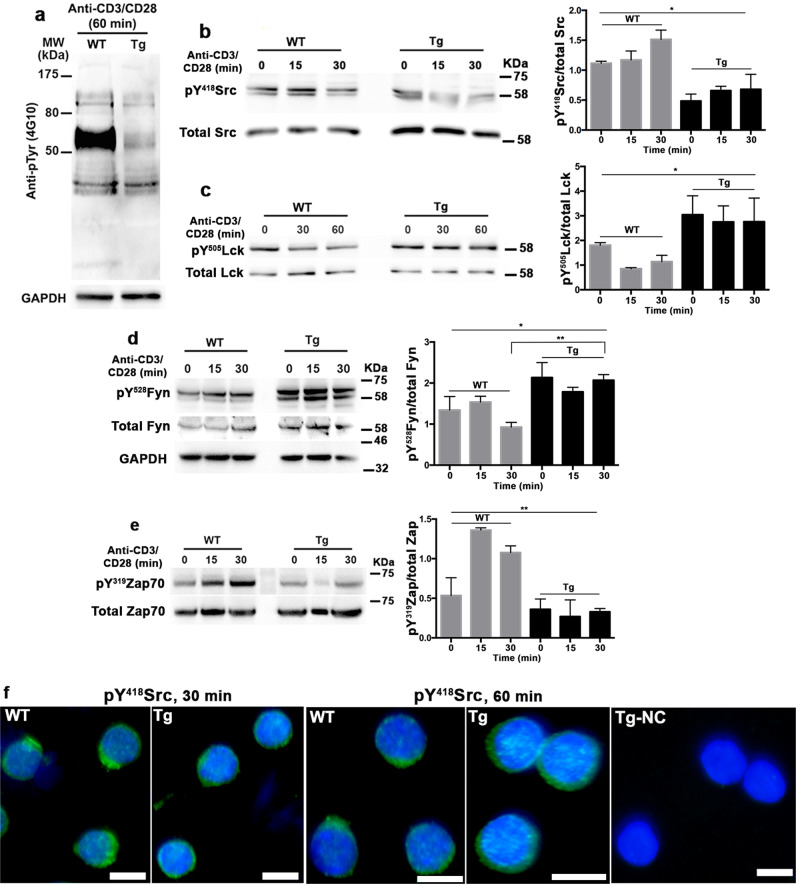
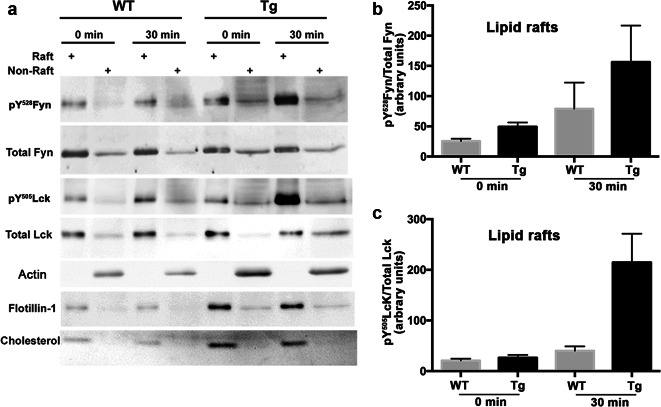
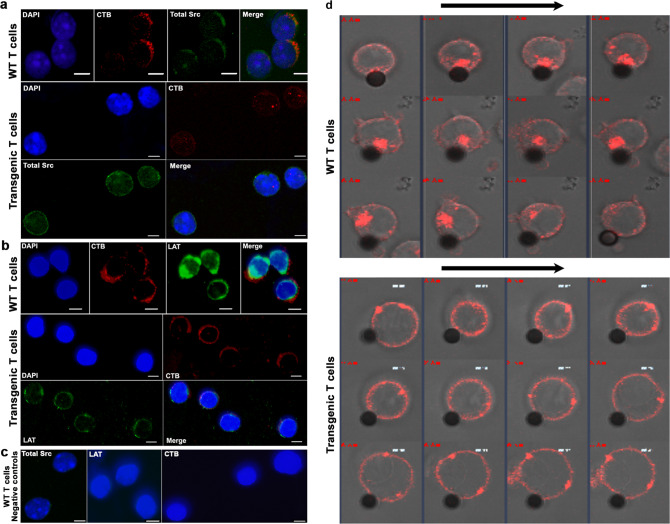
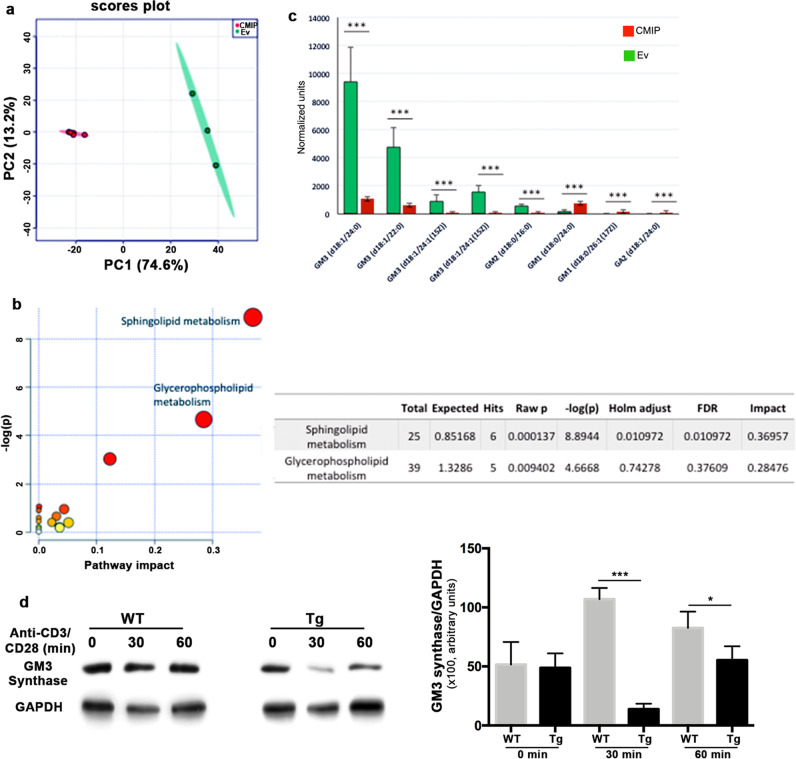
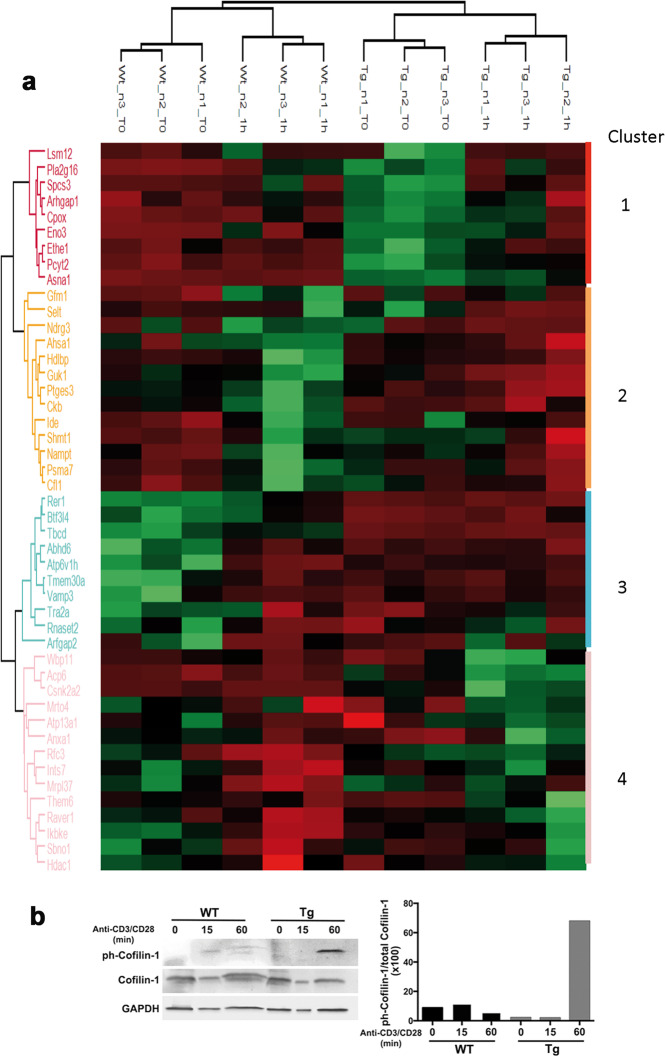
Upon their interaction with cognate antigen, T cells integrate different extracellular and intracellular signals involving basal and induced protein-protein interactions, as well as the binding of proteins to lipids, which can lead to either cell activation or inhibition. Here, we show that the selective T cell expression of CMIP, a new adapter protein, by targeted transgenesis drives T cells toward a naïve phenotype. We found that CMIP inhibits activation of the Src kinases Fyn and Lck after CD3/CD28 costimulation and the subsequent localization of Fyn and Lck to LRs. Video microscopy analysis showed that CMIP blocks the recruitment of LAT and the lipid raft marker cholera toxin B at the site of TCR engagement. Proteomic analysis identified several protein clusters differentially modulated by CMIP and, notably, Cofilin-1, which is inactivated in CMIP-expressing T cells. Moreover, transgenic T cells exhibited the downregulation of GM3 synthase, a key enzyme involved in the biosynthesis of gangliosides. These results suggest that CMIP negatively impacts proximal signaling and cytoskeletal rearrangement and defines a new mechanism for the negative regulation of T cells that could be a therapeutic target.

Keywords: CMIP; T cells; Transgenic mice.


Conflict of interest statement

The authors declare no competing interests.

Figures

Fig. 1
Fig. 1
Expression of CMIP in MCNS. a RT-qPCR to determine CMIP expression in healthy subjects (n = 10) and MCNS patients (n = 10) at relapse and in steroid-free remission. The data are quantified as the fold-change in induction relative to the control subject (mean with SEM, *p = 0.0156, Mann-Whitney test). b Western blot analysis of CMIP expression in the PBMCs of MCNS patients in relapse and remission. HEK cells transfected with recombinant human CMIP served as a positive control. c Confocal microscopy analysis of Tcells isolated by negative immunoselection and double-labeled with CMIP (green) and CD3 (red) antibodies. Left panel: control: healthy subject; right panel: MCNS T cells from relapse
Fig. 2
Fig. 2
Generation of CMIP transgenic mice. a Schematic diagram of targeted transgenesis into the HPRT locus (see details in the Materials and Methods section). All mice analyzed in this study were hemizygous males from the F10 to F18 generations. b PCR genotyping of mouse tail DNA. The HPRT PCR product was amplified from the WT allele in homozygous transgenic females (Tg+/+) or hemizygous transgenic males (Tg+) but not the reconstituted HPRT gene. c Quantification of mouse and human CMIP transcripts in transgenic mice and WT mice by RT-qPCR. d Confocal immunofluorescence microscopy of CMIP expression in T cells from WT and transgenic mice. The rightmost figure in the panel corresponds to the negative control, in which IgG isotype control antibody was used instead of primary antibody (Cmip/CD4) in Tg T cells
Fig. 3
Fig. 3
Transgenic mice develop an altered T cell phenotype. a, b Representative flow cytometry analysis of naïve, effector and memory T cells in transgenic and WT T cells. Splenocytes from 12-week-old transgenic mice (Tg) and WT mice were gated for CD4 + cells (a) or CD8 + cells (b) and analyzed for CD44 and CD62L expression. T cell subpopulations were defined as naïve (CD44low/verylowCD62Lhigh), memory (CD44highCD62Lhigh), or effector T cells (CD44highCD62Llow). The numbers inside and outside each small square indicate the percentage and the absolute number of cells, respectively. The total number of events is shown at the top. c and d Frequencies of naïve, effector and memory T cells. The results are representative of three independent experiments (n = 5 each for WT and transgenic mice). The frequency of naïve T cells in both CD4 + and CD8 + compartments was significantly increased, whereas the level of memory CD4 + T cells was decreased in transgenic mice compared to WT mice (Tg vs. WT, mean with SEM: naïve CD4 + , **p = 0.0079; naïve CD8 + , p = 0.0159; memory CD4 + , p = 0.0303, Mann-Whitney test). Although effector CD4+ and CD8 + subsets were decreased in Tg mice, this difference did not reach statistical significance. e Transgenic T cells exhibited a decreased proliferative capacity compared to WT T cells. T cells were isolated from Tg and WT mice and labeled with CFSE (1 μM). After synchronization, the cells were stimulated with anti-CD3/CD28 antibodies (1 μg/ml each). After 5 days, proliferation was analyzed by flow cytometry as the percentage of dividing cells. The addition of mouse recombinant IL2 (30 U/ml) at 24 and 72 h after stimulation restored the T cell proliferation rate, which was comparable between Tg and WT mice. Data are presented as the mean of four independent experiments. (Tg vs. WT at day 5, mean with SD: * p = 0.0286, Mann-Whitney test)
Fig. 4
Fig. 4
Influence of CMIP induction on cytokine expression. a Expression of the CMIP transcript. Total RNA was extracted from synchronized T cells before and after CD3/CD28 stimulation (1 μg/ml each) at the indicated times. The expression of endogenous Cmip in WT (green) and Tg mice (blue) along with Tg Cmip (red) is shown. b Expression of CMIP protein under the same conditions. c IL-2, IFNγ, IL-4, and IL-10 transcripts were quantified by RT-qPCR. The results are representative of three independent experiments (n = 5 mice in each group). [Tg vs. WT, mean with SEM; IL-2, 1 h: *p = 0.0278, 2 h: **p = 0.0040, 4 h: **p = 0.0040; IL-4, 1 h: **p = 0.0040, 2 h: **p = 0,0040, 4 h: **p = 0,0040, 6 h: *p = 0.0278, 8 and 16 h: nonsignificant (ns); IFNγ, 1 h: *p = 0.0257, 2 h: **p = 0.0040, 4 h: **p = 0.0079, 6 h: *p = 0.0317, 8 h: *p = 0.0317 and 16 h: p = 0.532 (ns); IL-10, 1 h: *p = 0.0286, 2 h: *p = 0.0159, 4 h: p = 0.1508 (ns), 6 h: *p = 0.0159, 8 h: **p = 0.0079, 16 h: **p = 0.0079; Mann-Whitney tests]
Fig. 5
Fig. 5
Transgenic T cells exhibit a hypophosphorylated protein profile with the downregulation of active Src. a Representative Western blot of protein lysates from transgenic and WT T cells after 60 min of activation by anti-CD3/CD28 antibodies incubated with anti-phosphotyrosine 4G10; blots were stripped and reprobed with anti-GAPDH antibody. be Western blots of protein lysates from transgenic and WT T cells several time points following anti-CD3/CD28 antibody activation (1 µg/ml each); blots were stripped and reprobed with an antibody raised against total specific protein. The results are representative of three independent experiments [pY418Src/total Src: one-way ANOVA, *p = 0.0163; pY505Lck/total Lck: Kruskal-Wallis test, *p = 0.0362; pY528Fyn/total GAPDH, one-way ANOVA, *p = 0.0204, Tg vs. WT (30 min), **p = 0.0015; pYr319Zap70/total Zap70, one-way Anova, **p = 0.0068]. f Immunofluorescence staining for pY418Src in transgenic and WT T cells isolated by negative immunoselection
Fig. 6
Fig. 6
Transgenic T cells exhibit higher levels of inactive Fyn and Lck in LRs and fail to be activated after CD3/CD28 costimulation. a Western blotting and TLC of raft (R) and nonraft (NR) fractions prepared at rest (0 min) and after the activation (30 min) of transgenic and WT mouse T cells. Rafts are enriched in Flotillin-1 and cholesterol. Samples were analyzed with anti-pY528Fyn and anti-pY505Lck antibodies, which recognize the inactive forms of Fyn and Lck, respectively, followed by antibodies recognizing total Fyn and Lck, respectively. Cholesterol was analyzed by TLC. b, c Inactive/total Fyn and inactive/total Lck in raft microdomains according to densitometric analysis of the bands shown in a
Fig. 7
Fig. 7
CMIP inhibits clustering and activation of the raft signaling platform. a CMIP inhibits membrane clustering of Src kinases and CTB after CD3/CD28 stimulation. Immunofluorescence analysis of transgenic and WT T cells after 30 min of activation by anti-CD3/CD28 antibodies (1 μg/ml each) that were then fixed and immunostained for total Src (green) and CTB (red). Cellular nuclei were revealed by counterstaining with DAPI dye. Confocal analysis shows that Src kinases and CTB colocalize in WT but not transgenic T cells. b CMIP inhibits the clustering of LAT and CTB into LRs after CD3/CD28 stimulation. Fluorescence analysis of LAT and CTB after T cell activation performed as in a. c Negative Src, LAT and CTB controls: the specificity of each signal in WT T cells was assessed using IgG isotype control antibody instead of primary antibody. d CMIP inhibits LR clustering and T cell polarization. Transgenic and WT T cells were synchronized, stained with CTB, loaded into 8-well plates at 50,000 cells/well and activated with anti-CD3-coated beads (cells:beads, 2:1) and soluble anti-CD28 (1 μg/ml). Cells were kept at 37 °C. Data were acquired with a confocal microscope at 1 image/15 s. Images were extracted from movies (1 image/min) and analyzed by ImageJ software (magnification: ×63)
Fig. 8
Fig. 8
CMIP induces alterations in the glycosphingolipid biosynthetic pathway and ganglioside species. A mouse podocyte cell line was stably transfected with a CMIP expression vector or an empty vector (EV). Lipids were extracted and subjected to LC-MS analysis. a Principal component analysis of ion abundance in the positive and negative modes discriminated between CMIP-transfected and EV-transfected cells. PC1 accounted for 74.6% of the total variance. b Metabolome view after MetPA shows sphingolipid metabolism to be the pathway most significantly altered by CMIP expression. Total: the total number of compounds in the pathway; Hits: the actual matched number from the uploaded data; Raw p: original p value calculated from enrichment analysis; Holm p: p value adjusted by the Holm-Bonferroni method; FDR p: p value adjusted using the false discovery rate; Impact: pathway impact value calculated from pathway topology analysis. c The relative abundances of several ganglioside species are very significantly different between empty vector-transfected and CMIP-transfected cells. Data are expressed as the means ± SDs of normalized arbitrary units. ***p < 0.001. EV: n = 3. CMIP: n = 6. d Representative Western blot showing GM3 synthase (St3Gal5 gene) in protein lysates at rest (0 min) or after 30 and 60 min of the activation of transgenic and WT T cells with anti-CD3/CD28 antibodies; blots were stripped and reprobed with anti-GAPDH antibody. Statistical analyses of three independent experiments were performed [Tg vs. WT (30 min), ***p = 0.0005 and Tg vs. WT (60 min), *p = 0.0254)]
Fig. 9
Fig. 9
Impact of CMIP expression and T cell activation on the total proteome. a Heat map showing 46 differentially expressed proteins in T cells obtained from transgenic and WT mice that were or were not subjected to 60 min of costimulation with anti-CD3/CD28 antibodies (1 μg/ml each). The column tree denotes mice grouped by hierarchical clustering. Rows correspond to 46 proteins whose differential expression was significant according to two-way ANOVA (p < 0.01) distributed into four clusters. Each cluster corresponds to proteins showing a similar pattern in variation depending on both parameters (CMIP expression and T cell activation). Proteins are labeled with their gene acronyms. b Phosphorylation/inactivation of Cofilin-1 in transgenic T cells. Western blot showing cofilin-1 in total extracts of transgenic and WT T cells isolated by negative immunoselection at reset (0 min) and after 15 or 60 min of costimulation with anti-CD3/CD28 antibodies (1 μg/ml each). Samples were analyzed with an anti-pSer3-Cofilin-1 antibody that recognizes the inactive form of cofilin-1 and an antibody recognizing the total Cofilin-1. GAPDH was used as a loading control. The right panel shows the inactive/total Cofilin-1 ratio according to densitometric analysis

References

    1. Brubaker SW, Bonham KS, Zanoni I, Kagan JC. Innate immune pattern recognition: a cell biological perspective. Annu. Rev. Immunol. 2015;33:257–290. - PMC - PubMed
    1. Chakraborty AK, Weiss A. Insights into the initiation of TCR signaling. Nat. Immunol. 2014;15:798–807. - PMC - PubMed
    1. Viola A, Gupta N. Tether and trap: regulation of membrane-raft dynamics by actin-binding proteins. Nat. Rev. Immunol. 2007;7:889–896. - PubMed
    1. Brownlie RJ, Zamoyska R. T cell receptor signalling networks: branched, diversified and bounded. Nat. Rev. Immunol. 2013;13:257–269. - PubMed
    1. Sahali D, et al. A novel approach to investigation of the pathogenesis of active minimal- change nephrotic syndrome using subtracted cDNA library screening. J. Am. Soc. Nephrol. 2002;13:1238–1247. - PubMed

Publication types

MeSH terms