

Protein crystal structure determination with the crystallophore, a nucleating and phasing agent
- PMID: 31396026
- PMCID: PMC6662991
- DOI: 10.1107/S1600576719006381
Protein crystal structure determination with the crystallophore, a nucleating and phasing agent
Abstract
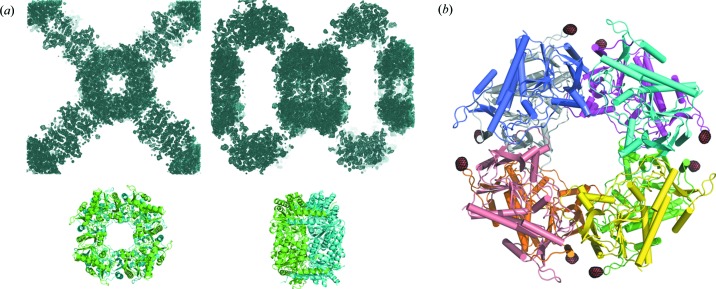
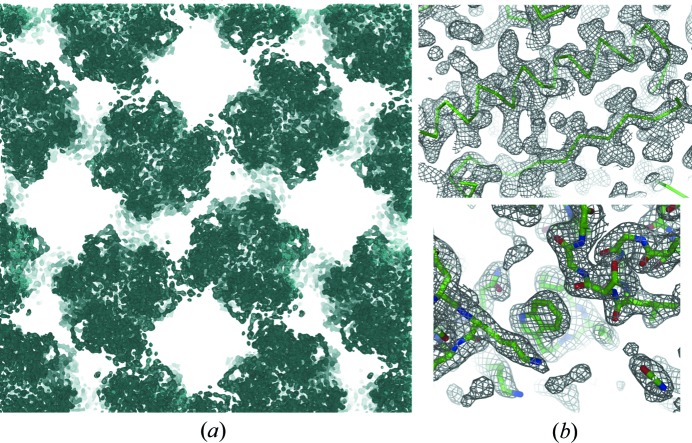
Obtaining crystals and solving the phase problem remain major hurdles encountered by bio-crystallographers in their race to obtain new high-quality structures. Both issues can be overcome by the crystallophore, Tb-Xo4, a lanthanide-based molecular complex with unique nucleating and phasing properties. This article presents examples of new crystallization conditions induced by the presence of Tb-Xo4. These new crystalline forms bypass crystal defects often encountered by crystallographers, such as low-resolution diffracting samples or crystals with twinning. Thanks to Tb-Xo4's high phasing power, the structure determination process is greatly facilitated and can be extended to serial crystallography approaches.
Keywords: Tb-Xo4; anomalous-scattering-based methods; de novo phasing; macromolecular crystallization; protein crystallography; serial crystallography; the crystallophore.
Figures
Similar articles
-
Crystallophore: a versatile lanthanide complex for protein crystallography combining nucleating effects, phasing properties, and luminescence.Chem Sci. 2017 Sep 1;8(9):5909-5917. doi: 10.1039/c7sc00758b. Epub 2017 Jun 6. Chem Sci. 2017. PMID: 29619195 Free PMC article.
-
Unveiling the Binding Modes of the Crystallophore, a Terbium-based Nucleating and Phasing Molecular Agent for Protein Crystallography.Chemistry. 2018 Jul 11;24(39):9739-9746. doi: 10.1002/chem.201802172. Epub 2018 Jun 25. Chemistry. 2018. PMID: 29806881
-
Influence of Chemical Modifications of the Crystallophore on Protein Nucleating Properties and Supramolecular Interactions Network.Chemistry. 2024 Jul 5;30(38):e202400900. doi: 10.1002/chem.202400900. Epub 2024 Jun 20. Chemistry. 2024. PMID: 38738452
-
Advances in multiple wavelength anomalous diffraction crystallography.Curr Opin Chem Biol. 2000 Oct;4(5):495-9. doi: 10.1016/s1367-5931(00)00122-8. Curr Opin Chem Biol. 2000. PMID: 11006535 Review.
-
Crystallographic phasing from weak anomalous signals.Curr Opin Struct Biol. 2015 Oct;34:99-107. doi: 10.1016/j.sbi.2015.08.003. Epub 2015 Sep 30. Curr Opin Struct Biol. 2015. PMID: 26432413 Free PMC article. Review.
Cited by
-
NMR Spectroscopy of supramolecular chemistry on protein surfaces.Beilstein J Org Chem. 2020 Oct 9;16:2505-2522. doi: 10.3762/bjoc.16.203. eCollection 2020. Beilstein J Org Chem. 2020. PMID: 33093929 Free PMC article. Review.
-
Differences in regulation mechanisms of glutamine synthetases from methanogenic archaea unveiled by structural investigations.Commun Biol. 2024 Jan 19;7(1):111. doi: 10.1038/s42003-023-05726-w. Commun Biol. 2024. PMID: 38243071 Free PMC article.
-
Multi-crystal data collection using synchrotron radiation as exemplified with low-symmetry crystals of Dps.Acta Crystallogr F Struct Biol Commun. 2020 Nov 1;76(Pt 11):568-576. doi: 10.1107/S2053230X20012571. Epub 2020 Oct 8. Acta Crystallogr F Struct Biol Commun. 2020. PMID: 33135675 Free PMC article.
-
Exploring the potential of a bioassembler for protein crystallization in space.NPJ Microgravity. 2025 Jun 14;11(1):25. doi: 10.1038/s41526-025-00477-w. NPJ Microgravity. 2025. PMID: 40517138 Free PMC article.
-
The adhesive PitA pilus protein from the early dental plaque colonizer Streptococcus oralis: expression, purification, crystallization and X-ray diffraction analysis.Acta Crystallogr F Struct Biol Commun. 2020 Jan 1;76(Pt 1):8-13. doi: 10.1107/S2053230X1901642X. Epub 2020 Jan 1. Acta Crystallogr F Struct Biol Commun. 2020. PMID: 31929180 Free PMC article.
References
-
- Alex, J. M., Rennie, M. L., Volpi, S., Sansone, F., Casnati, A. & Crowley, P. B. (2018). Cryst. Growth Des. 18, 2467–2473.
-
- Barends, T. R. M., Foucar, L., Botha, S., Doak, R. B., Shoeman, R. L., Nass, K., Koglin, J. E., Williams, G. J., Boutet, S., Messerschmidt, M. & Schlichting, I. (2014). Nature, 505, 244–247. - PubMed
-
- Brown, J., Walter, T. S., Carter, L., Abrescia, N. G. A., Aricescu, A. R., Batuwangala, T. D., Bird, L. E., Brown, N., Chamberlain, P. P., Davis, S. J., Dubinina, E., Endicott, J., Fennelly, J. A., Gilbert, R. J. C., Harkiolaki, M., Hon, W.-C., Kimberley, F., Love, C. A., Mancini, E. J., Manso-Sancho, R., Nichols, C. E., Robinson, R. A., Sutton, G. C., Schueller, N., Sleeman, M. C., Stewart-Jones, G. B., Vuong, M., Welburn, J., Zhang, Z., Stammers, D. K., Owens, R. J., Jones, E. Y., Harlos, K. & Stuart, D. I. (2003). J. Appl. Cryst. 36, 315–318.
LinkOut - more resources
Full Text Sources