. 2019 Jul 18:10:1650.
doi: 10.3389/fimmu.2019.01650. eCollection 2019.

Site-Specific DC Surface Signatures Influence CD4+ T Cell Co-stimulation and Lung-Homing

Affiliations

Site-Specific DC Surface Signatures Influence CD4+ T Cell Co-stimulation and Lung-Homing

David Pejoski et al. Front Immunol. .

Erratum in

Abstract

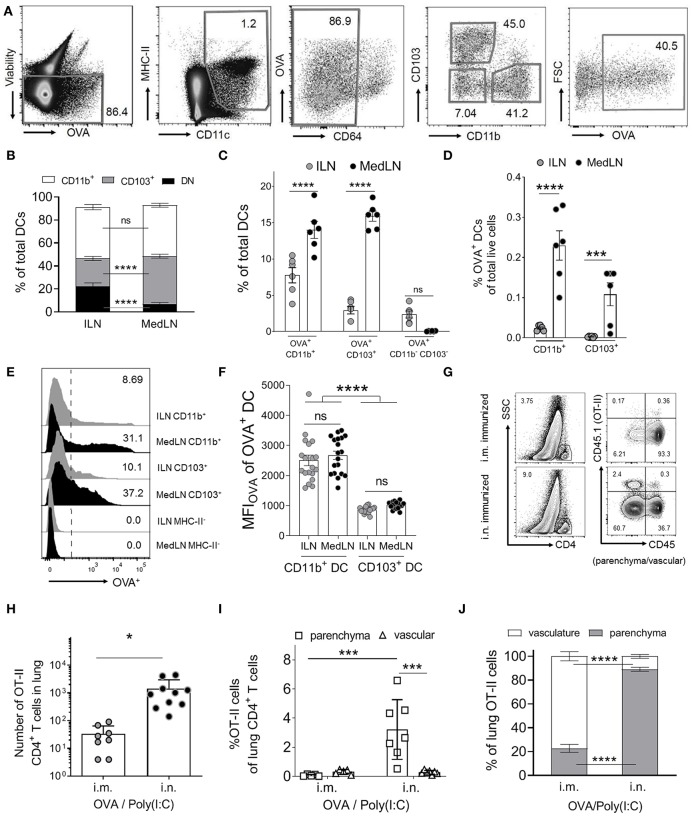
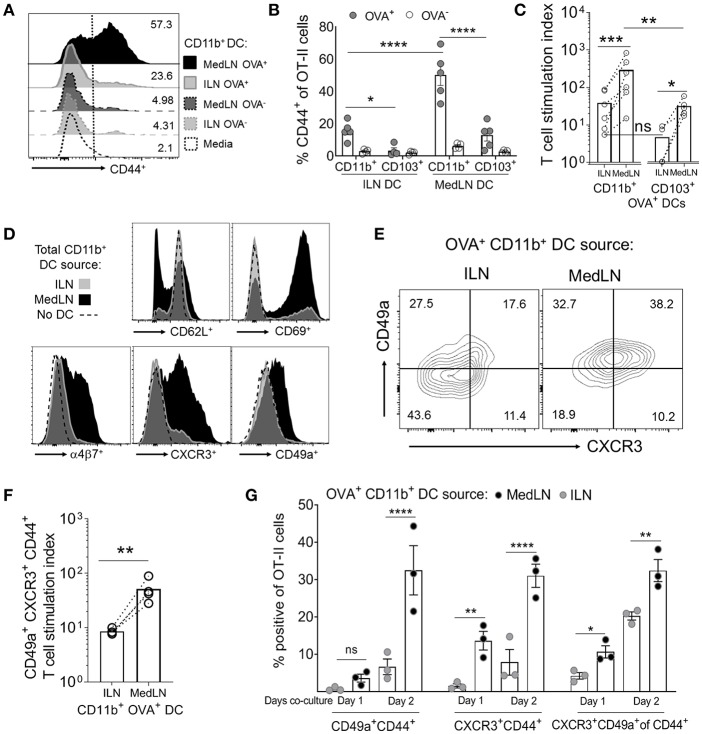
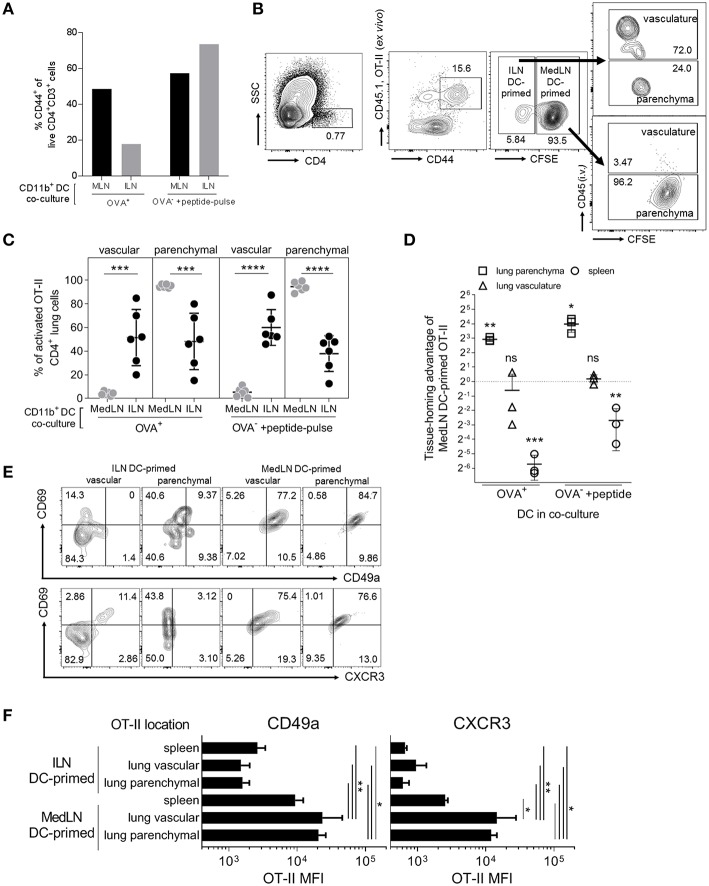
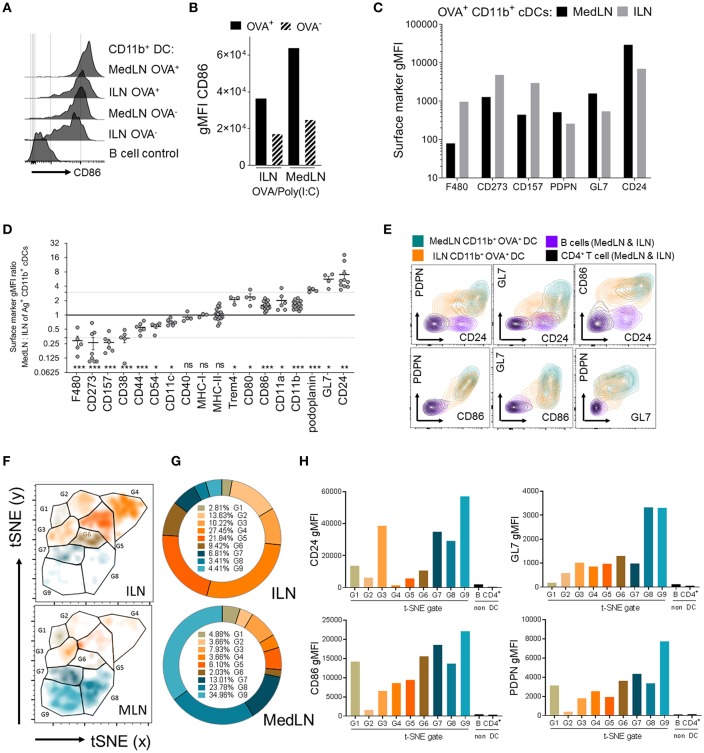
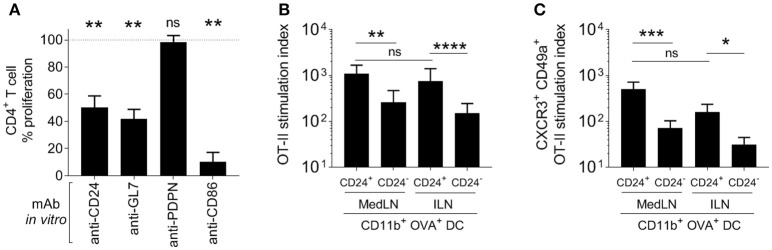
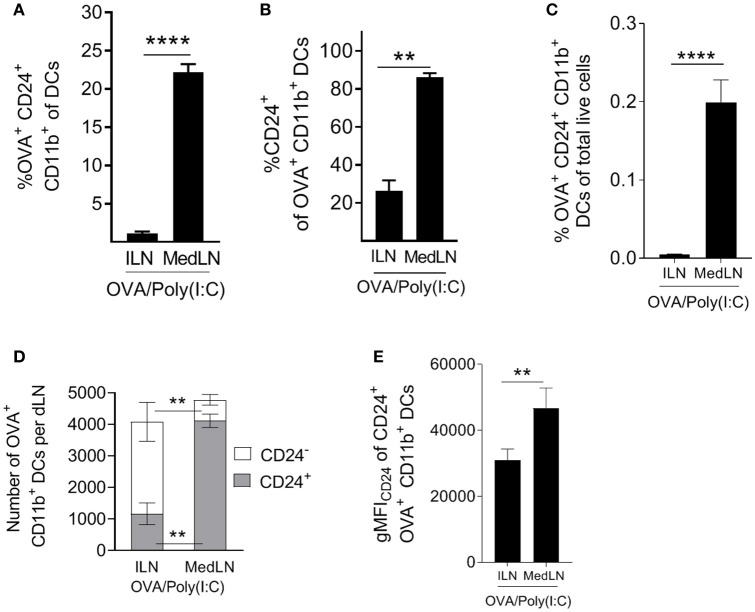
Dendritic cells (DCs) that drain the gut and skin are known to favor the establishment of T cell populations that home to the original site of DC-antigen (Ag) encounter by providing soluble "imprinting" signals to T cells in the lymph node (LN). To study the induction of lung T cell-trafficking, we used a protein-adjuvant murine intranasal and intramuscular immunization model to compare in vivo-activated Ag+ DCs in the lung and muscle-draining LNs. Higher frequencies of Ag+ CD11b+ DCs were observed in lung-draining mediastinal LNs (MedLN) compared to muscle-draining inguinal LNs (ILN). Ag+ CD11b+ MedLN DCs were qualitatively superior at priming CD4+ T cells, which then expressed CD49a and CXCR3, and preferentially trafficked into the lung parenchyma. CD11b+ DCs from the MedLN expressed higher levels of surface podoplanin, Trem4, GL7, and the known co-stimulatory molecules CD80, CD86, and CD24. Blockade of specific MedLN DC molecules or the use of sorted DC and T cell co-cultures demonstrated that DC surface phenotype influences the ability to prime T cells that then home to the lung. Thus, the density of dLN Ag+ DCs, and DC surface molecule signatures are factors that can influence the output and differentiation of lung-homing CD4+ T cells.

Keywords: CD11b+ dendritic cells; costimulation; lung CD4+ T cells; lung homing; tissue imprinting; vaccination route.


Figures

Figure 1
Figure 1
Intranasal immunization results in higher percentages of specific Ag+ DC subsets and increases lung-trafficking of CD4+ T cells. (A–F) Draining LN (dLN) suspensions from mice immunized i.n. or i.m. with fluorescent Ag (OVA) and Poly(I:C) 24 h earlier were stained with specific Abs prior to flow cytometric analyses. (A) Representative cytometry plots of the gating strategy for conventional DCs, based on (43). DCs were defined as viable (non-autofluorescent, B220, singlets; not shown), MHC-II+, CD11c+, CD64low/int. DC subsets were based on CD11b, CD103, and Ag (OVA) expression. (B) Shows the percentage of DC subsets from total conventional DCs, (C) the percentage of OVA+ cells within DC subsets and (D) the percentage of OVA+ DC subsets as a percentage of total live dLN cells. (B–D) Show 6 pooled experiments with 6–12 mice per route per experiment. (E) Representative histograms of the OVA+ signal in selected DC subsets and an MHC-II control cell subset. (F) Shows the MFIOVA of the indicated DC subsets; 19 experiments pooled, 3–12 mice per route per experiment. (G–J) Purified naïve CD4+ OVA-specific (OT-II) T cells were transferred into naive CD45.1 BL6 mice prior to i.m. or i.n. immunization with OVA/Poly(I:C). Ten days later, in vivo staining of vascular leukocytes was performed immediately before removing the lungs to stain CD45.1+ OT-II cells. (G) Shows the gating strategy for representative mice from one experiment, to identify OT-II cells in the lung parenchyma (CD45) or vasculature (CD45+), after gating SSClow CD4+ T cells (singlet, viability, and CD3+ gates not shown). OT-II cells in the indicated lung compartments are shown as (H) total numbers or (I) as percentages of total CD4+ cells or (J) total OT-II cells in the lung, with individual mice (N = 8–10), pooled from two or more independent experiments. Statistical significance was calculated using an ANOVA when comparing three or more groups, or a t-test for two groups, with SEM bars shown for pooled averages of multiple experiments, or SD bars for pooled individual mouse data, as detailed in the Materials and Methods. P > 0.05; “ns,” not significant; *P < 0.05; ***P < 0.001; ****P < 0.0001.
Figure 2
Figure 2
In vivo-activated DCs in the lung- and muscle-draining LNs differentially prime CD4+ T cells in terms of speed, magnitude, and induction of lung homing molecules. (A–G) Mice were immunized by the i.n. or i.m. route with fluorescent OVA and Poly(I:C). After 24 h, the indicated DC subsets (5,000 cells per subset) were sorted from dLN suspensions and co-cultured with 100,000 naive OT-II CD4+ T cells for 1–3 days in the absence of exogenous cytokines or antigen. (A) Representative flow cytometry histograms of CD44 expression of gated OT-II cells after 3 days of DC co-culture. (B) The percentage of CD44+ OT-II cells after 3 days of co-culture with either OVA+ or OVA CD11b+ or CD103+ DC subsets from the draining ILN or MedLN of immunized mice. (C) OVA+ DC subset priming of OT-II cells, expressed as a stimulation index that represents the fold-change in OT-II numbers per well, compared to the media control. (D) Representative histograms of OT-II CD4+ T cell phenotype after 3 days of DC co-culture. (E–G) OVA+ CD11b+ DCs were sorted from the dLNs of i.m. or i.n. immunized mice and co-cultured with naïve OT-II cells for 3 days or as indicated. (E) Representative flow cytometry contour plots of CD49a and CXCR3 expression of CD44+ CD4+ T cells after DC co-culture with OT-II cells on day 2 of in vitro activation. (F) OVA+ CD11b+ DC subset induction of lung homing molecules CXCR3 and CD49a on OT-II cells, expressed as a stimulation index, which represents the fold-change in numbers per well, compared to the media control OT-II cell culture. (G) The percentage of gated OT-II cells expressing the indicated lung-homing molecules after 1 or 2 days of DC co-culture. In (B,C,F,G), points represent the mean response from individual experiments with SEM bars. An ANOVA was used in (B,G), and a two-tailed ratio t-test was used in (C,F), as described in the Materials and Methods. P > 0.05; “ns,” not significant; *P < 0.05; **P < 0.01; ***P < 0.001; ****P < 0.0001.
Figure 3
Figure 3
In vivo lung parenchyma-homing advantage of OT-II cells primed by MedLN DCs. OT-II cells were co-cultured for 3 days with OVA+ or OT-II peptide-pulsed OVA CD11b+ DCs from the draining ILN or MedLN of immunized mice. (A) Co-cultured OT-II cells were stained for flow cytometric analysis to determine CD44 expression, one representative experiment shown. Cells from MedLN or ILN DC co-cultures were labeled with high or low concentrations of CFSE, respectively, and mixed at a 1:1 ratio of live cells before i.v. injection into T cell deficient Rag2−/− mice (n = 6 per DC co-culture type). The following day, mice were injected i.v. with labeled anti-CD45 Ab prior to sacrifice to distinguish parenchymal vs. vascular lung leukocytes, and organs were harvested for flow cytometric analysis. (B) Flow cytometry contour plot gating strategy using 6 concatenated samples to distinguish the lung compartment and cell-culture origin (ILN or MedLN DC primed) of the transferred OT-II cells recovered ex vivo. (C) The percentage of activated OT-II from DC co-cultures detected in different lung compartments. (D) The tissue homing index, expressed as a ratio of the number of MedLN to ILN DC-primed (CD44+) OT-II cells detected in different tissues after normalization, see Materials and Methods. (C,D) Data represents individual mice (n = 3–6) from one of two independent experiments. (E,F) Phenotype of CD44+ OT-II cells detected in recipient mice lung compartments, shown as (E) concatenated flow cytometry contour plots, or (F) the expression intensity of the indicated lung homing markers, from six mice representing one of two independent experiments. Statistical analysis comprised of a one way ANOVA in (C,F), single sample t-test in (D), and SD error bars, as detailed in the Materials and Methods. P > 0.05; “ns,” not significant; *P < 0.05; **P < 0.01; ***P < 0.001; ****P < 0.0001.
Figure 4
Figure 4
Phenotypic differences between MedLN and ILN CD11b+ DCs. Draining LNs of male or female mice, after i.n. or i.m. immunization 24 h earlier with fluorescent OVA and Poly(I:C), stained for flow cytometric analysis. (A) Shows histograms of CD86 expression, (B) shows CD86 MFI of OVA+ or OVA CD11b+ DCs, and (C) shows the MFI of various markers in CD11b+ DCs from the indicated LNs. (A–C) Show data from one of three similar experiments (D) shows the ratio of gMFI for the indicated markers from MedLN to ILN Ag+ CD11b+ DCs, calculated after normalizing each sample with isotype or “fluorescence minus one” Ab staining controls. The dotted line indicates an arbitrary 3-fold higher or lower ratios of expression, individual points represent experimental repeats, pooling LNs from 3 to 12 mice per immunization route, with p-values calculated using a single-sample t-test (0.05 alpha, expected MFI ratio of 1). (E) Co-expression of the indicated surface markers in the indicated cell subsets from one of three similar experiments. (F) Shows a t-SNE analysis of an equal number of OVA+ CD11b+ cDCs from the dLNs of i.n. or i.m. immunized mice as described in the Materials and Methods. t-SNE data was used to generate (G) pie graphs showing the percentage of cells in each t-SNE gate, relative to total OVA+ CD11b+ cDCs from the same LN, and (H) column graphs show the cell surface gMFI of the indicated markers in each of the t-SNE gates using combined ILN and MedLN data. t-SNE data is representative of three independent experiments. P > 0.05; “ns,” not significant; *P < 0.05; **P < 0.01; ***P < 0.001.
Figure 5
Figure 5
Role of specific DC surface molecules and subsets in the activation of T cells and the induction of lung-trafficking molecules. (A) Draining MedLN OVA+ CD11b+ DCs from mice immunized 24 h earlier, were incubated with isotype control Abs or the indicated blocking mAbs before co-culture and evaluation of % CD44+ OT-II cells. Values are relative to the isotype control reference (100%) for 3–5 independent experiments, showing SEM error bars and compared using a one sample t-test with expected value of 100%. In (B,C), 5000 OVA+ CD24+ or CD24 DCs were isolated from the dLNs of i.n. or i.m.-immunized mice and co-cultured with 100,000 naïve OT-II cells. The stimulation index refers to a fold-increase of the numbers of (B) CD44+, or (C) CD49+ CXCR3+ CD44+ OT-II cells compared to the media-only control. (B,C) Show 4–5 independent experiment repeats with SEM error bars, and statistical differences were calculated with a ratio paired t-test. P > 0.05; “ns,” not significant; *P < 0.05; **P < 0.01; ***P < 0.001; ****P < 0.0001.
Figure 6
Figure 6
Intranasal immunization elicits higher frequencies and numbers of DCs with potent T cell priming capacity. (A–E) Conventional flow cytometric analysis of DCs from the dLN of mice immunized 1 day earlier by the i.n. or i.m. route with fluorescent OVA/Poly(I:C). (A) The percentage of OVA+ CD24+ CD11b+ DCs of total DCs, (B) the percentage of CD24+ cells of OVA+ CD11b+ DCs, (C) the percentage of OVA+ CD24+ CD11b+ DCs of total live cells. (D) Shows the number of CD24+ or CD24 OVA+ CD11b+ DCs per dLN (E) shows the number of CD24+ or CD24 OVA+ CD11b+ DCs per dLN. (E) Shows CD24 gMFI of OVA+ CD24+ CD11b+ DCs. (A–E) Show 4–7 independent experiment repeats with SEM error bars, and a paired t-test statistical comparison. **P < 0.01; ****P < 0.0001.

References

    1. Belyakov IM, Ahlers JD. Comment on “Trafficking lymphocytes to mucosal surfaces”. J Immunol. (2009) 182:1779 10.4049/jimmunol.0990002 - DOI - PubMed
    1. Kaufman DR, Barouch DH. Response to Comment on “Trafficking of antigen-specific CD8+ T lymphocytes to mucosal surfaces following intramuscular vaccination”. J Immunol. (2009) 182:1779–80. 10.4049/jimmunol.09-90003 - DOI - PubMed
    1. Lai R, Afkhami S, Haddadi S, Jeyanathan M, Xing Z. Mucosal immunity and novel tuberculosis vaccine strategies: Route of immunisation determined T-cell homing to restricted lung mucosal compartments. Eur Respir Rev. (2015) 24:356–60. 10.1183/16000617.00002515 - DOI - PMC - PubMed
    1. Samaha H, Pignata A, Fousek K, Ren J, Lam FW, Stossi F, et al. . A homing system targets therapeutic T cells to brain cancer. Nature. (2018) 561:331–7. 10.1038/s41586-018-0499-y - DOI - PMC - PubMed
    1. Agace WW. Tissue-tropic effector T cells: generation and targeting opportunities. Nat Rev Immunol. (2006) 6:682–92. 10.1038/nri1869 - DOI - PubMed

Publication types