

The Impact of cDNA Normalization on Long-Read Sequencing of a Complex Transcriptome
- PMID: 31396260
- PMCID: PMC6664245
- DOI: 10.3389/fgene.2019.00654
The Impact of cDNA Normalization on Long-Read Sequencing of a Complex Transcriptome
Abstract
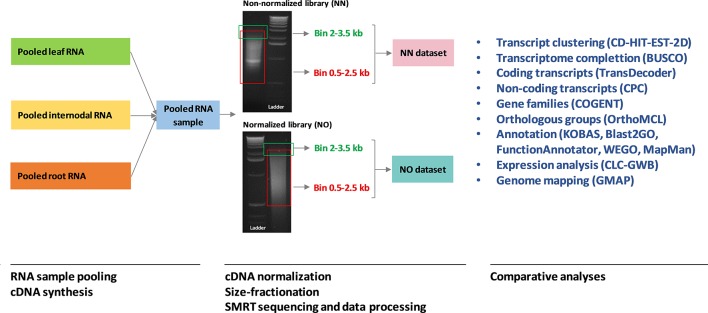
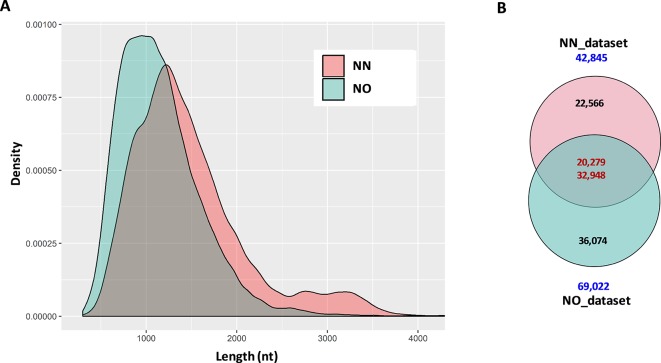
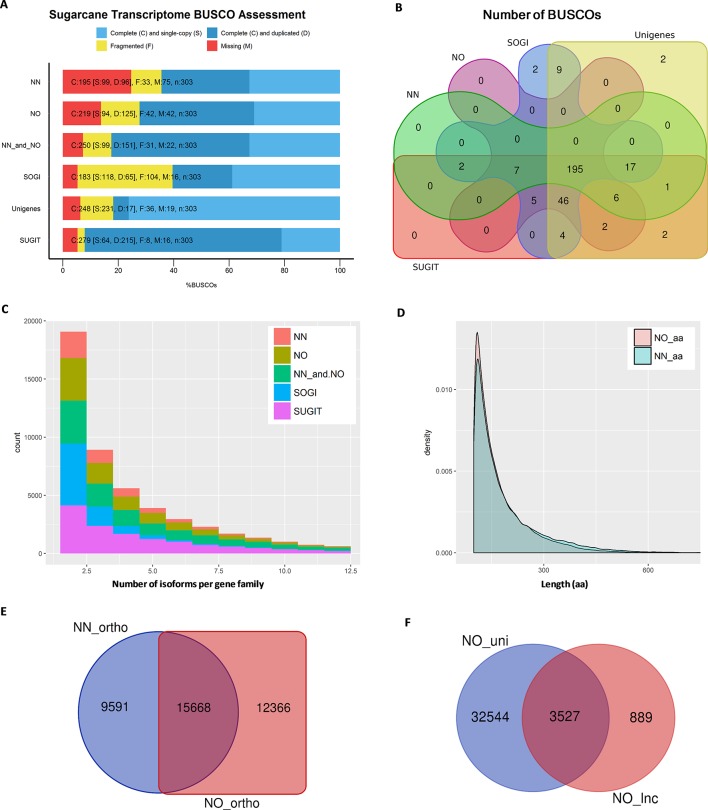
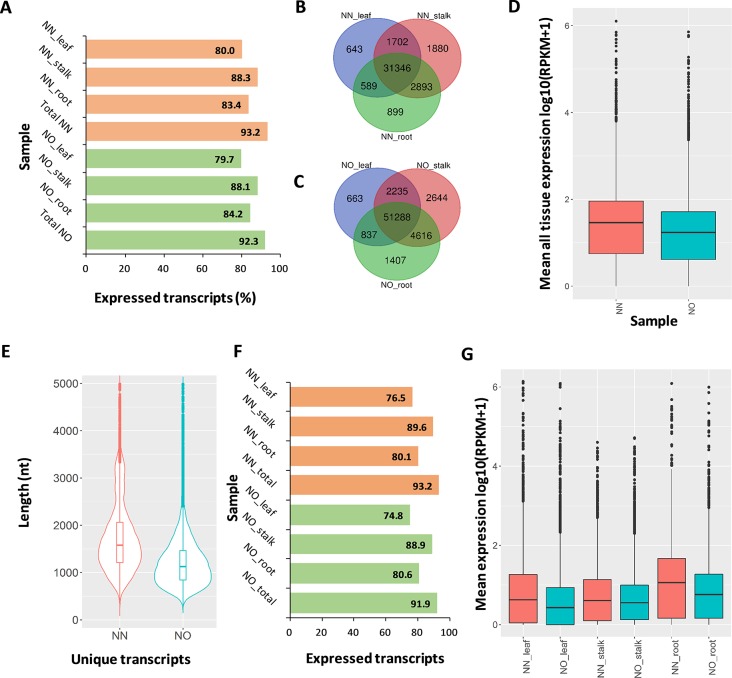
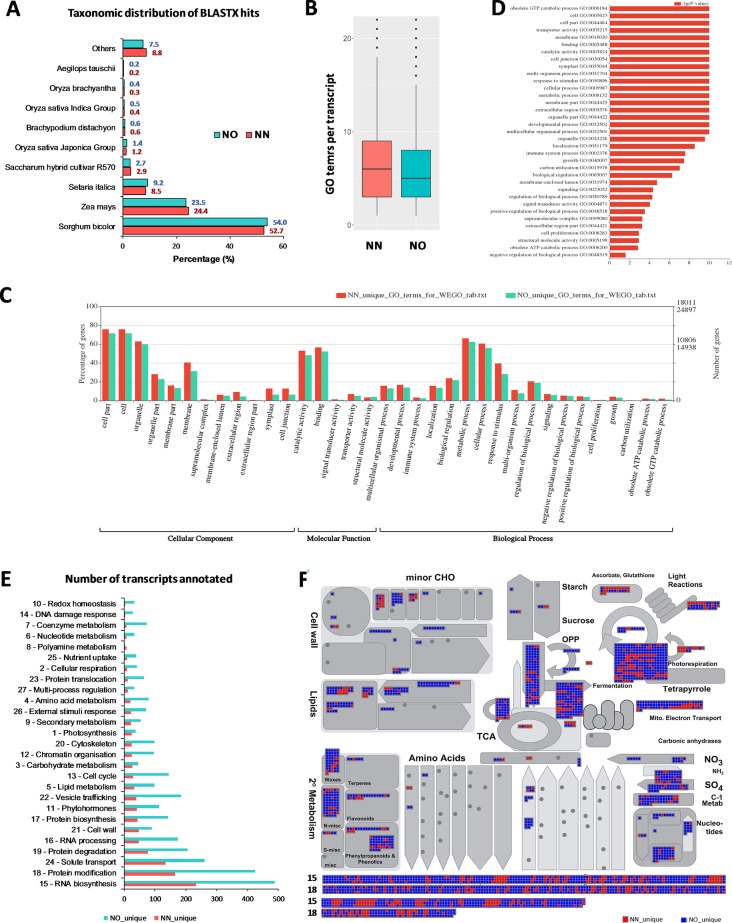
Normalization of cDNA is widely used to improve the coverage of rare transcripts in analysis of transcriptomes employing next-generation sequencing. Recently, long-read technology has been emerging as a powerful tool for sequencing and construction of transcriptomes, especially for complex genomes containing highly similar transcripts and transcript-spliced isoforms. Here, we analyzed the transcriptome of sugarcane, a highly polyploidy plant genome, by PacBio isoform sequencing (Iso-Seq) of two different cDNA library preparations, with and without a normalization step. The results demonstrated that, while the two libraries included many of the same transcripts, many longer transcripts were removed, and many new generally shorter transcripts were detected by normalization. For the same input cDNA and data yield, the normalized library recovered more total transcript isoforms and number of predicted gene families and orthologous groups, resulting in a higher representation for the sugarcane transcriptome, compared to the non-normalized library. The non-normalized library, on the other hand, included a wider transcript length range with more longer transcripts above ∼1.25 kb and more transcript isoforms per gene family and gene ontology terms per transcript. A large proportion of the unique transcripts comprising ∼52% of the normalized library were expressed at a lower level than the unique transcripts from the non-normalized library, across three tissue types tested including leaf, stalk, and root. About 83% of the total 5,348 predicted long noncoding transcripts was derived from the normalized library, of which ∼80% was derived from the lowly expressed fraction. Functional annotation of the unique transcripts suggested that each library enriched different functional transcript fractions. This demonstrated the complementation of the two approaches in obtaining a complete transcriptome of a complex genome at the sequencing depth used in this study.
Keywords: isoform sequencing; normalization impact; polyploid transcriptome; sugarcane transcriptome; transcript enrichment; transcriptome normalization.
Figures
Similar articles
-
A survey of the complex transcriptome from the highly polyploid sugarcane genome using full-length isoform sequencing and de novo assembly from short read sequencing.BMC Genomics. 2017 May 22;18(1):395. doi: 10.1186/s12864-017-3757-8. BMC Genomics. 2017. PMID: 28532419 Free PMC article.
-
Uncovering full-length transcript isoforms of sugarcane cultivar Khon Kaen 3 using single-molecule long-read sequencing.PeerJ. 2018 Oct 30;6:e5818. doi: 10.7717/peerj.5818. eCollection 2018. PeerJ. 2018. PMID: 30397543 Free PMC article.
-
Illuminating the dark side of the human transcriptome with long read transcript sequencing.BMC Genomics. 2020 Oct 30;21(1):751. doi: 10.1186/s12864-020-07123-7. BMC Genomics. 2020. PMID: 33126848 Free PMC article.
-
Methodologies for Transcript Profiling Using Long-Read Technologies.Front Genet. 2020 Jul 7;11:606. doi: 10.3389/fgene.2020.00606. eCollection 2020. Front Genet. 2020. PMID: 32733532 Free PMC article. Review.
-
Reviving the Transcriptome Studies: An Insight Into the Emergence of Single-Molecule Transcriptome Sequencing.Front Genet. 2019 Apr 26;10:384. doi: 10.3389/fgene.2019.00384. eCollection 2019. Front Genet. 2019. PMID: 31105749 Free PMC article. Review.
Cited by
-
Unraveling the Risk Factors and Etiology of the Canine Oral Mucosal Melanoma: Results of an Epidemiological Questionnaire, Oral Microbiome Analysis and Investigation of Papillomavirus Infection.Cancers (Basel). 2022 Jul 13;14(14):3397. doi: 10.3390/cancers14143397. Cancers (Basel). 2022. PMID: 35884456 Free PMC article.
-
De novo transcriptome assembly of Dalbergia sissoo Roxb. (Fabaceae) under Botryodiplodia theobromae-induced dieback disease.Sci Rep. 2023 Nov 22;13(1):20503. doi: 10.1038/s41598-023-45982-8. Sci Rep. 2023. PMID: 37993468 Free PMC article.
-
An improved repertoire of splicing variants and their potential roles in Arabidopsis photomorphogenic development.Genome Biol. 2022 Feb 9;23(1):50. doi: 10.1186/s13059-022-02620-2. Genome Biol. 2022. PMID: 35139889 Free PMC article.
References
-
- Alberts B., Bray D., Lewis J., Raff M., Roberts K., Watson J. (1994). Molecular biology of the cell. 3rd Oxford: Garland Science.
LinkOut - more resources
Full Text Sources